
Introduction
Experimental
Results
| Primer Sequence | Tm (°C) | |
|---|---|---|
| COX-2 F ATATCAGGTCATCGGTGGAGAG | 64.9 | |
| COX-2 R CACTCTGTTGTGCTCCCGAA | 65.4 | |
| iNOS F GTGCTAATGCGGAAGGTCAT | 64.3 | |
| iNOS R AAATGTGCTTGTCACCACCAG | 64.7 |
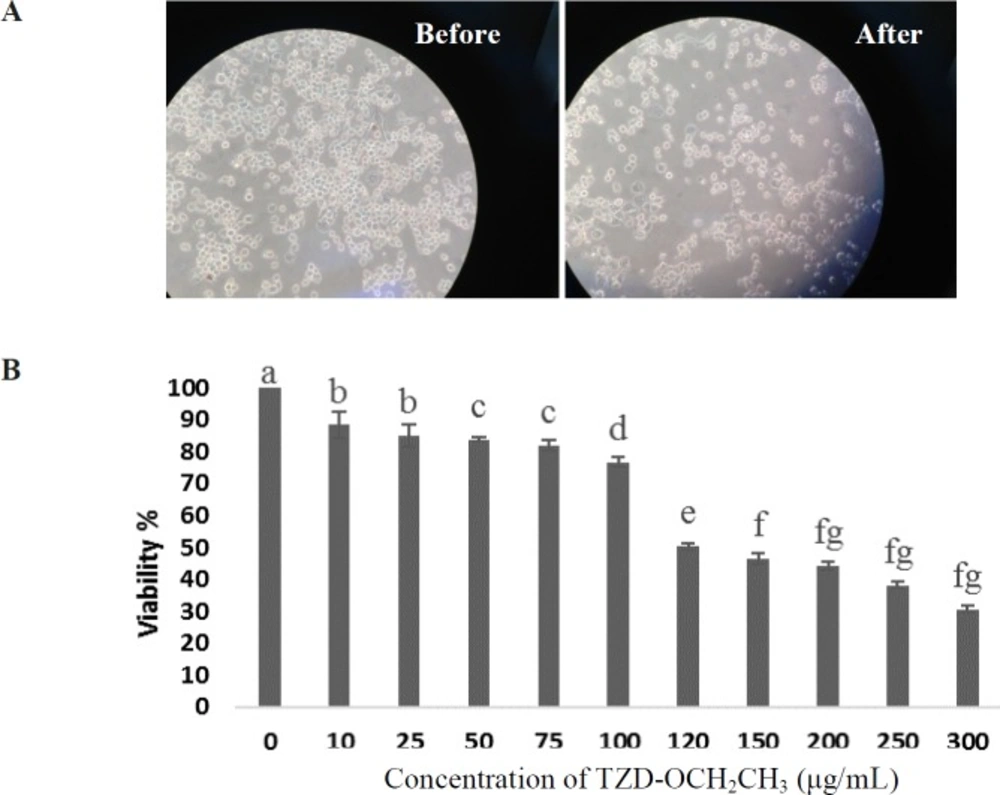
Effect of TZD-OCH2CH3 on cell viability in LPS-stimulated RAW264.7 cells. (A) Before and 24 h after TZD-OCH2CH3 treatment. (B) Cells were incubated in the presence of TZD-OCH2CH3 (0-300 μg/mL) with the addition of 1 µg/mL LPS for 24 h. Cell viability was determined by the MTT assay. Values represent the means ± SDs of three independent experiments. *P < 0.05 indicates statistically significant differences from the control group
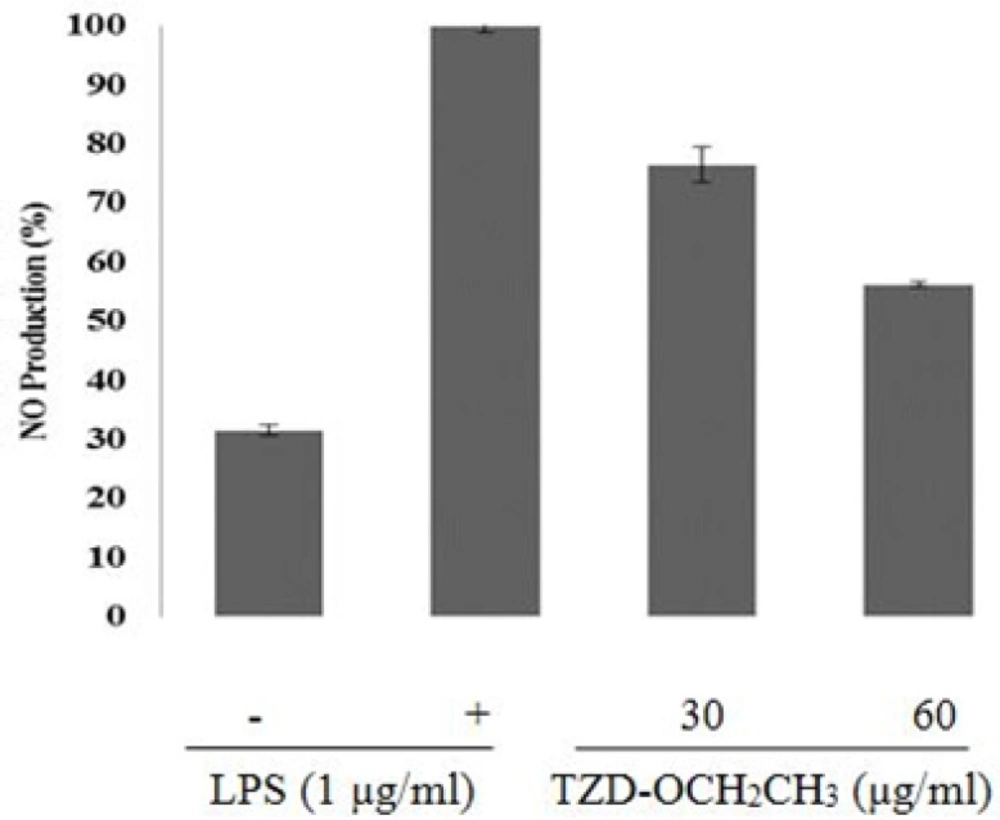
Effect of TZD-OCH2CH3 on LPS-induced NO level in RAW 264.7 cells. The cells were stimulated with 1 μg/mL of LPS only or with different concentrations of TZD-OCH2CH3 for 24 h. NO levels were determined using Griess assays in culture media. Values represent the means ± SDs of three independent experiments. *P < 0.05 indicates statistically significant differences from the control group
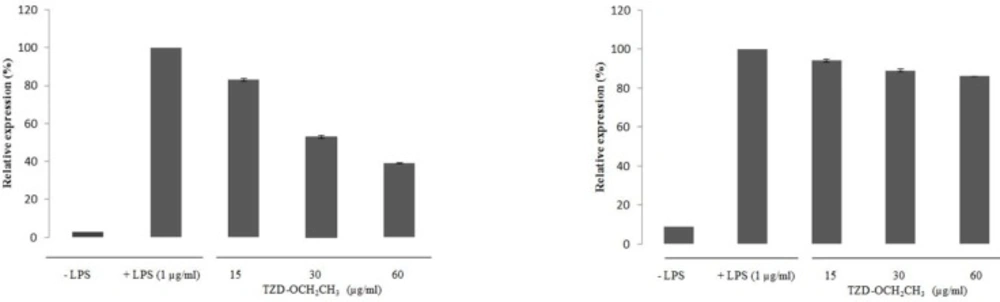
Effect of TZD-OCH2CH3 on the mRNA expression of COX-2 and iNOS in LPS-activated RAW 264.7 cells. RAW 264.7 cells were pretreated with various concentration of TZD-OCH2CH3 (15, 30 and 60 μg/mL) for 1 h before being incubated with LPS (1 μg/mL) for 18 h. Total RNAs were isolated and mRNA expression of COX-2 and iNOS was determined by real-time RT–PCR. Data represent three independent experiments and are expressed as mean ± SDs. *P < 0.05 indicates statistically significant differences from the control group
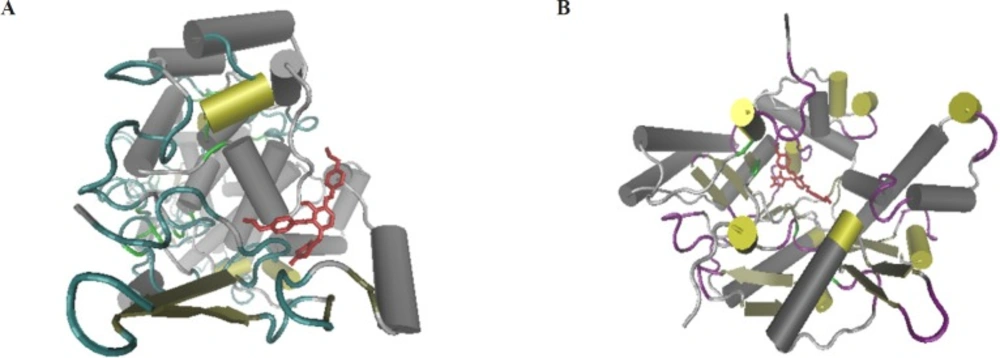
3D secondary structure of COX-2 (A) and iNOS (B) binding site that shows the three dimensional position of TZD-OCH2CH3 at the binding site of the protein
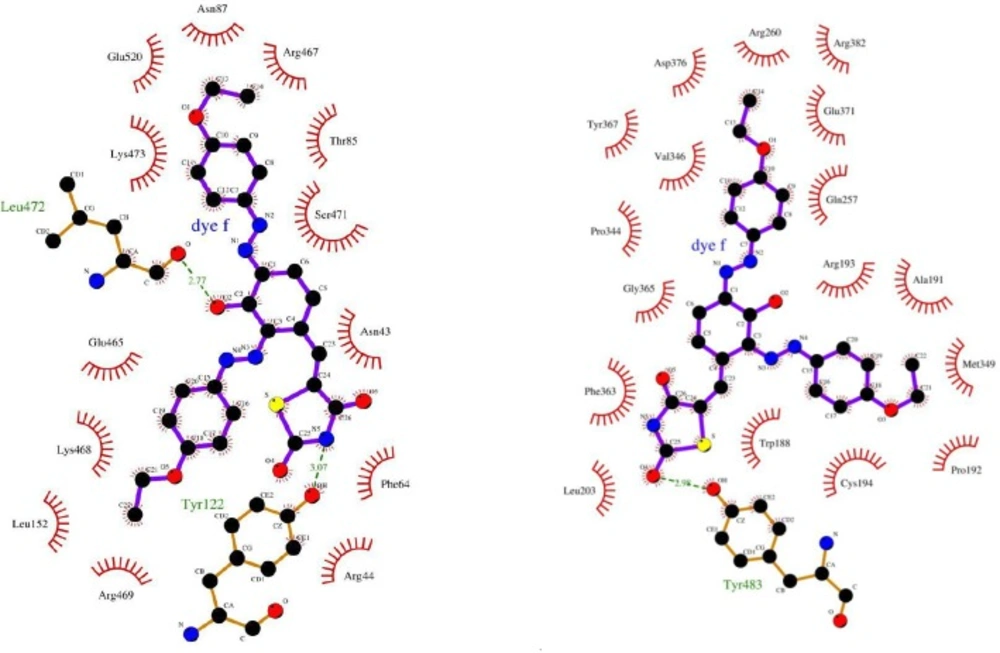
Two dimensional plot of COX-2 (A) and iNOS (B) at the present of TZD-OCH2CH3. LigPlot v.1.0, which generates from the PDB file input
