Experimental Design
This study was conducted on male Wistar rats (170-210 g). The animals were housed at the animal house under diurnal cycle of 12 h light/12 h darkness at an approximate temperature of 22-25 °C. Rats received standard chow and water ad libitum. The experimental protocols were approved by the Animal Ethics Care and Use Committee of Shahid Sadoughi University of Medical Sciences. The animals were divided into the seven experimental groups (n = 10).
1. Ctl group: Intact animals served as control.
2. H group: To induce hypertrophy model, animals underwent abdominal aorta banding.
3. Car25+H group
4. Car50+H group
5. Car75+H group
The treated groups (3, 4, and 5) received carvacrol (Car, Purity ≥98%- Sigma- Aldrich, USA), at doses of 25, 50 and 75 mg/kg/day (ip). Treatment had been started seven days before induction of hypertrophy and continued for three weeks.
6. DMSO+H group: Since carvacrol was dissolved in 4% dimethyl sulfoxide [DMSO], this group of animals, as the sham, received DMSO.
Car50 group: the rats were given carvacrol (50 mg/kg/day), without hypertrophy induction.
7. In all experimental groups blood pressure was recorded directly via carotid artery cannulation.
Rat model of pressure overload-induced hypertrophy
The rats were anesthetized by the intraperitoneal injection of ketamine (70-90 mg/kg) and xylazine (10 mg/kg). An incision was made in the left flank. After exposing the abdominal aorta a 21-guage needle was placed beside the artery and the suture was tied around it, then the needle was removed and abdominal wall muscles and skin were sutured. Three weeks after abdominal aorta stenosis, the myocardial hypertrophy model was induced due to chronic hypertension. At the end of the third week, the left carotid artery was cannulated to record the blood pressure directly. Then, the hearts were weighed to estimate the ratio of the heart weight (HW) to the body weight (BW). To separate the serum, the blood samples were drawn from atrium and centrifuged at 3000 rpm for 20 min at room temperature. The animal serums were kept at -80 ºC for biochemical studies. Finally, the heart was excised quickly through thoracotomy, the left ventricle tissue was separated and placed in liquid nitrogen for molecular studies.
Abdominal aorta banding in rats, is a reproducible model of cardiac hypertrophy which has been commonly used for studying pressure overload-induced LVH. Our previous study along with other studies has shown that blood pressure increases significantly within 3-4 days after aortic banding, and over time, this chronic hemodynamic overload leads the hypertrophy response in the left ventricle (
22,
23).
Histological study
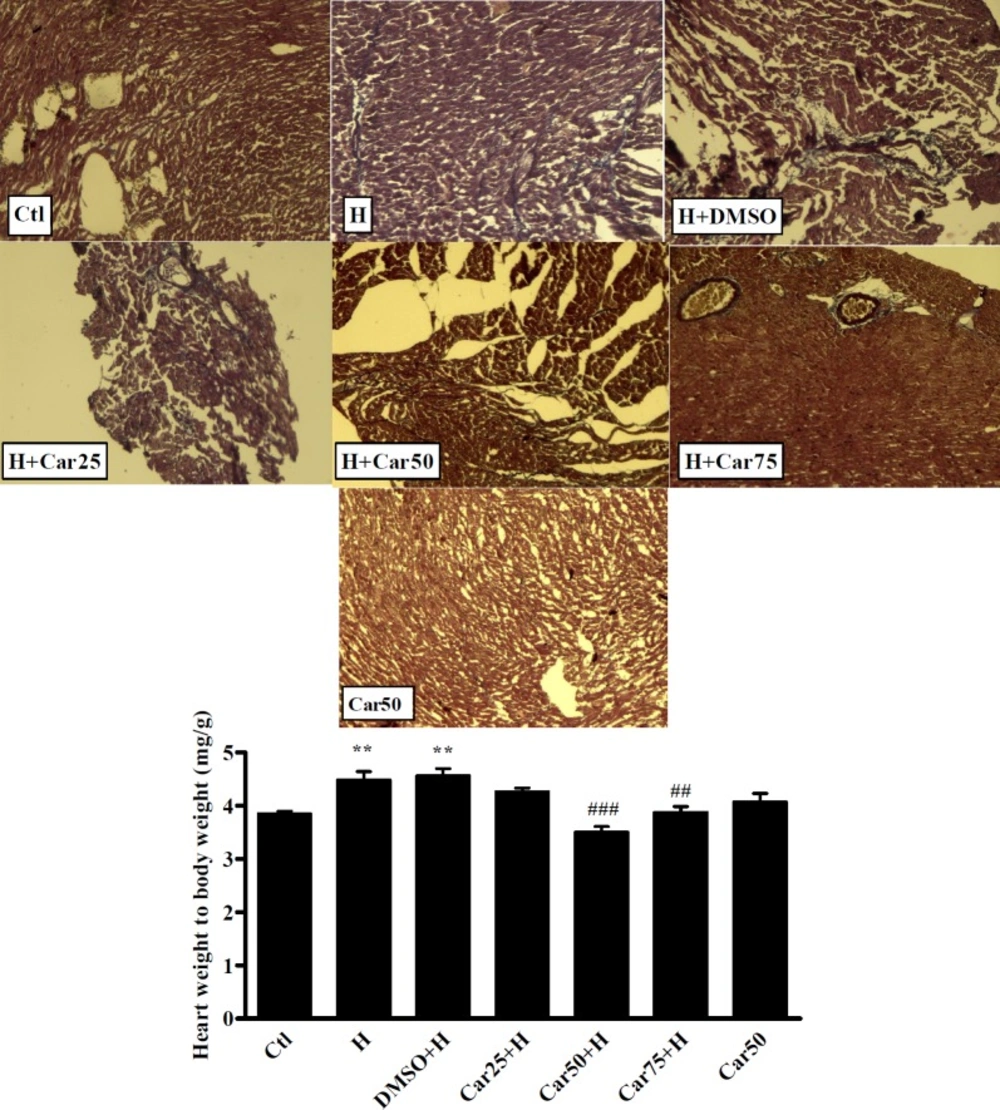
To assess the cardiac fibrosis in experimental groups, three samples of each group were fixed in 10% formaldehyde. After tissue processing and paraffin embedding, the cross-sectional slices were stained with Masson trichrome for collagen deposition assessment. In this staining technique, the nucleus appears in dark blue, while the cytoplasm is light scarlet, the muscle is dark scarlet, and also, the collagen is green or blue.
Cell culture and Angiotensin II-induced hypertrophy model
Rat myocyte H9c2 cell series were obtained from the Pasteur Institute-Iran, and were serially passaged in DMEM (Dulbecco′s Modified Eagle′s Medium, Gibco®) made up of 10% fetal bovine serum (FBS) as a supplement, 100 U/mL penicillin and 100 μg/mL streptomycin. The cells were seeded onto 6-well plates at a density of 1 × 10⁵ cells/well and incubated in 37 °C with humidified atmosphere of 5% CO2. The cell cultures between passages 5 to 7 were used for the experiments. The cells treated with 0.01 to 100 μmol of carvacrol for 24 h. The cell viability was evaluated using MTT test. Based on the results of MTT, the cells pretreated with 0.01, 0.1, and 1 μmol of carvacrol to evaluate its preventive effect on cardiac hypertrophy. Twenty-four hours after carvacrol pretreatment, angiotensin II (Sigma®, A9525, 1 μmol/L) was added to induce hypertrophy model.
Cell size measurement
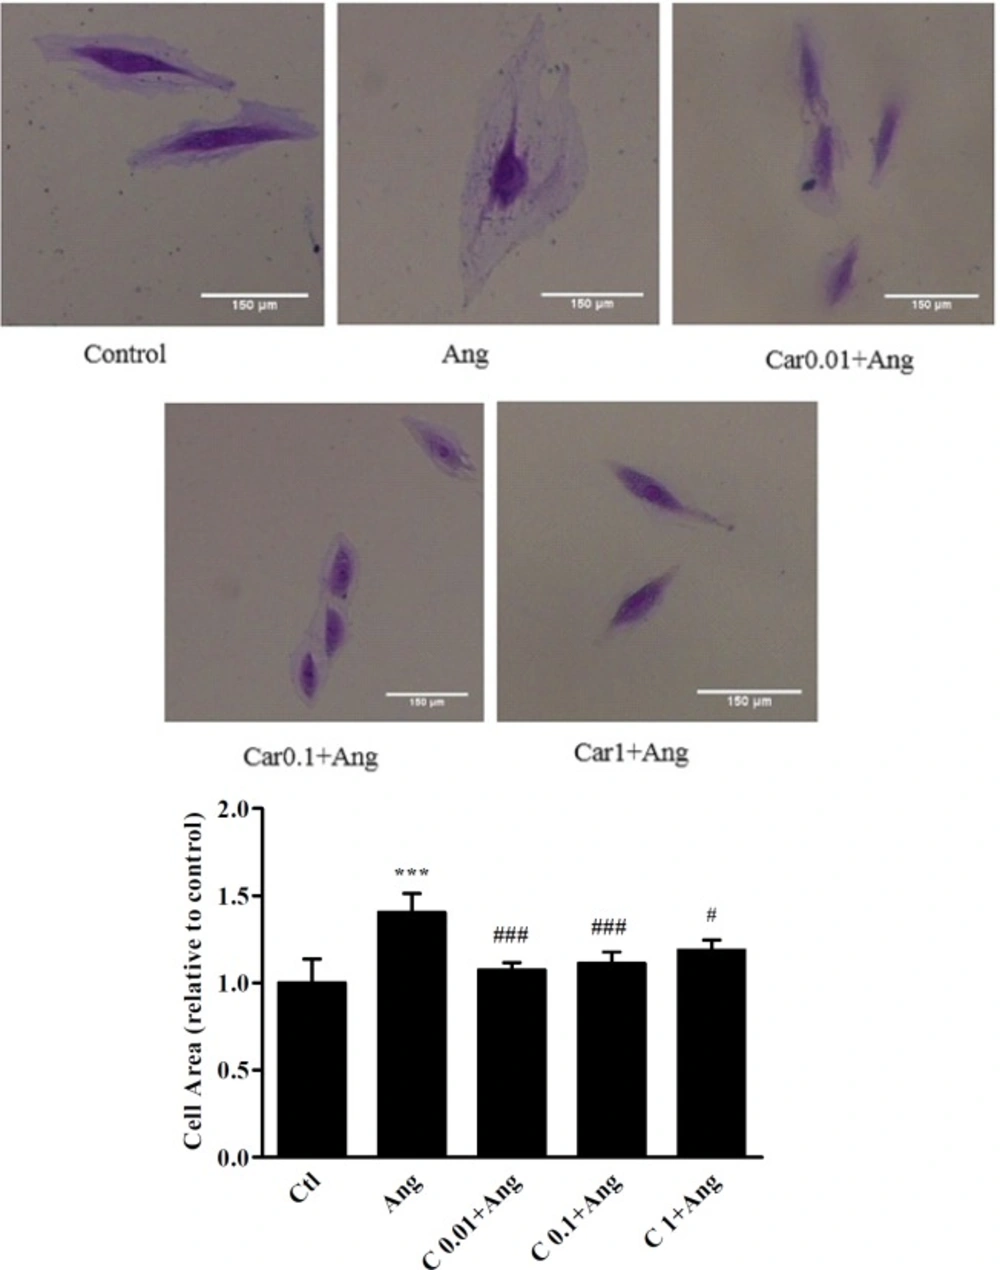
In order to measure H9c2 cells area, the cells were fixed with 10% formaldehyde for 1-2 min, and stained with crystal violet solution. After irrigating the plate with water, the cells were observed using a microscope (Zeiss) and the images were captured at 10X magnification (Sony, Syber-shot, DSCWX200 camera). The cell area was measured applying ImageJ software 1.49v. (Parlee et al. 2014). In each group, at least 150 cells were measured.
| Gene | Forward primer (5'–3') | Reverse primer (5'–3') |
|---|
| ANP | GAGGAGAAGATGCCGGTAG | CTAGAGAGGGAGCTAAGTG |
| BNP | TGATTCTGCTCCTGCTTTTC | GTGGATTGTTCTGGAGACTG |
| B-actin | GAACCCTAAGGCCAACCGTGAA | ATAGCAGCCACAAAAAGGGAAA |
| Groups | SP (mmHg) | DP (mmHg) | HR (beats/min) |
|---|
| Ctl | 102.8 ± 6 | 81.75 ± 6 | 292 ± 14 |
| H | 153 ± 5.7*** | 128.8 ± 2*** | 271 ± 11 |
| DMSO+H | 140 ± 7* | 116 ± 5.6*** | 259 ± 8 |
| Car25+H | 106.7 ± 5### | 61.2 ± 6### | 236 ± 16** |
| Car50+H | 116.3 ± 6.5# | 92.5 ± 5## | 229 ± 17* |
| Car75+H | 100.8 ± 6### | 65.75 ± 4### | 239 ± 18* |
| Car50 | 98.2 ± 5 | 72.2 ± 5.4 | 243 ± 15* |
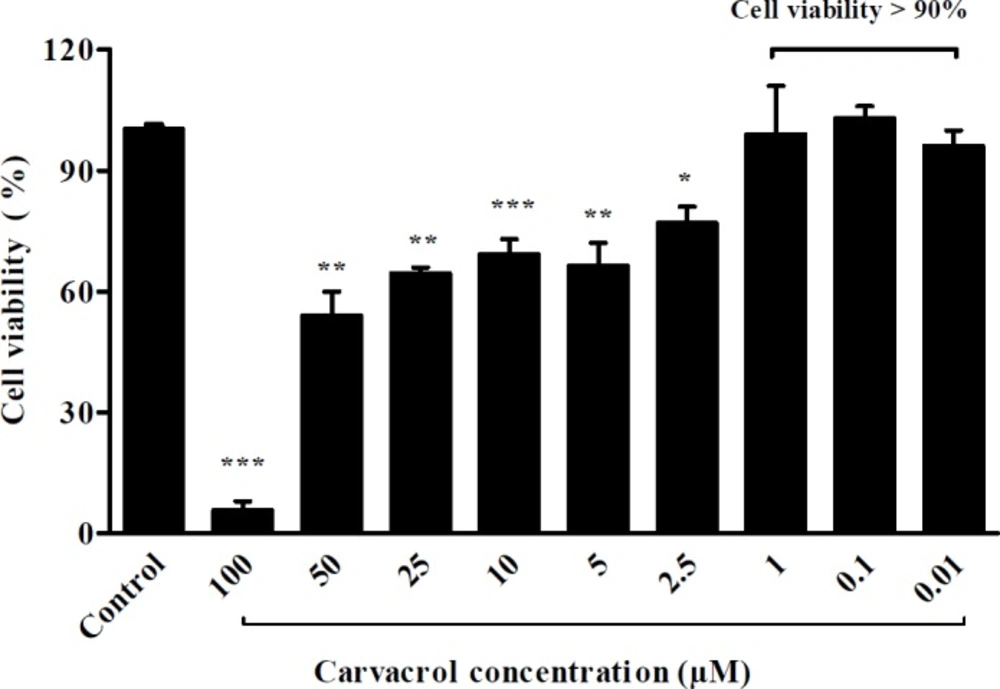
Assessment of H9c2 cells viability after treatment with different concentrations of carvacrol. Untreated cells served as control. Cell viability was evaluated by MTT test. Data are expressed as mean ± SEM. *P < 0.05, **P < 0.01 and ***P < 0.001 vs. control
H9c2 cells size after treatment with different concentrations of carvacrol. The images show the cell size in un-treated (Ctl) and angiotensin II treated H9c2 cells (Ang, 1 μM) in the presence or absence of carvacrol. A significant decrease in cell size was observed when hypertrophied cells were pretreated with 0.01, 0.1 and 1 μM of carvacrol. Data are expressed as mean ± SEM. ***P < 0.001 vs. Ctl, #P < 0.05 and ###P < 0.001 vs. Ang
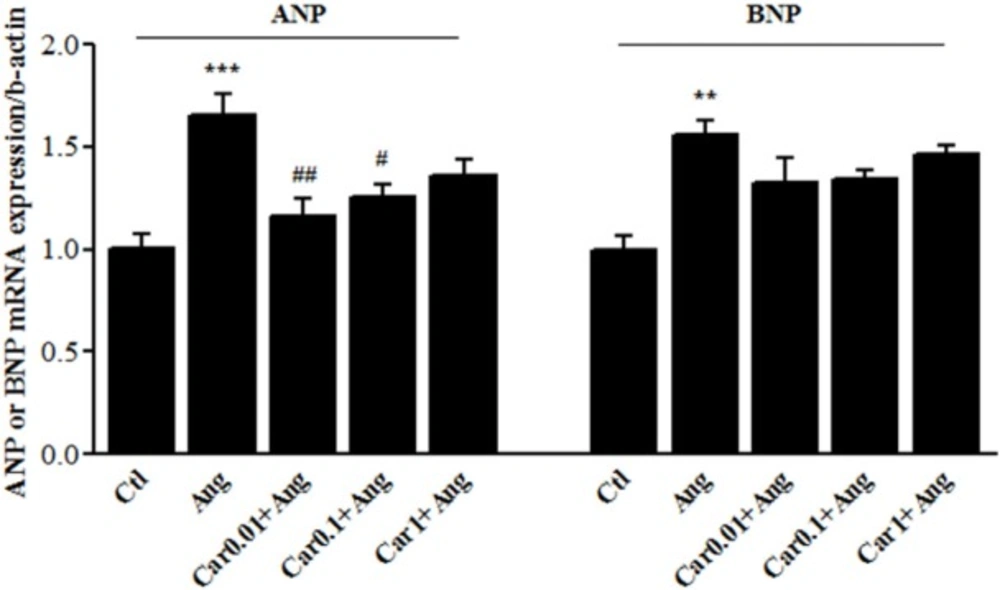
Transcription level of natriuretic peptides in H9c2 cells. Atrial and brain Natriuretic peptides (ANP and BNP, respectively) mRNA levels were assessed in the Angiotensin II (Ang)-induced hypertrophied H9c2 cells in the presence or absence of carvacrol (Car) at different concentrations. Un-treated cells served as control (Ctl). The data are displayed as mean ± SEM. **P < 0.01 and ***P < 0.001 vs. Ctl. #P < 0.05 and ##P < 0.01 vs. Ang
The heart weight to body weight ratio (HW/BW) in experimental groups. As an important marker of cardiac hypertrophy, HW/BW ratio was measured in the control (Ctl), hypertrophy (H), and carvacrol (Car+H) treated groups. DMSO used as the solvent. Animals were treated with 25, 50 and 75 mg/kg/day of carvacrol for three weeks. The data are displayed as mean ± SEM. **P < 0.01 vs. Ctl. ##P < 0.01 and ###P < 0.001 vs. H group (n = 10). The top panel shows representative photomicrographs of Masson's Trichrome stained heart sections confirms fibrosis in un-treated hypertrophied hearts (20x magnification)
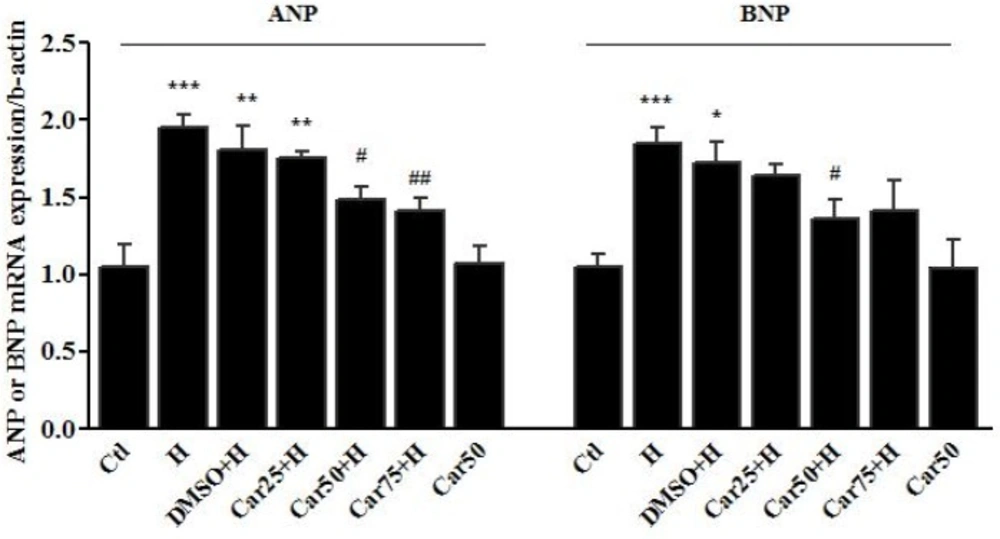
Cardiac transcription of natriuretic peptides. Atrial and brain Natriuretic peptides (ANP and BNP, respectively) mRNA levels were assessed in the left ventricular tissue of rats subjected to pressure overload-induced hypertrophy (H) in the presence or absence of carvacrol (Car) at different concentrations. Intact animals served as control (Ctl). DMSO used as the solvent of carvacrol. The data are displayed as mean ± SEM. *P < 0.05, **P < 0.01 and ***P < 0.001 vs. Ctl group. #P < 0.05 and ##P < 0.01 vs. Ang or H group
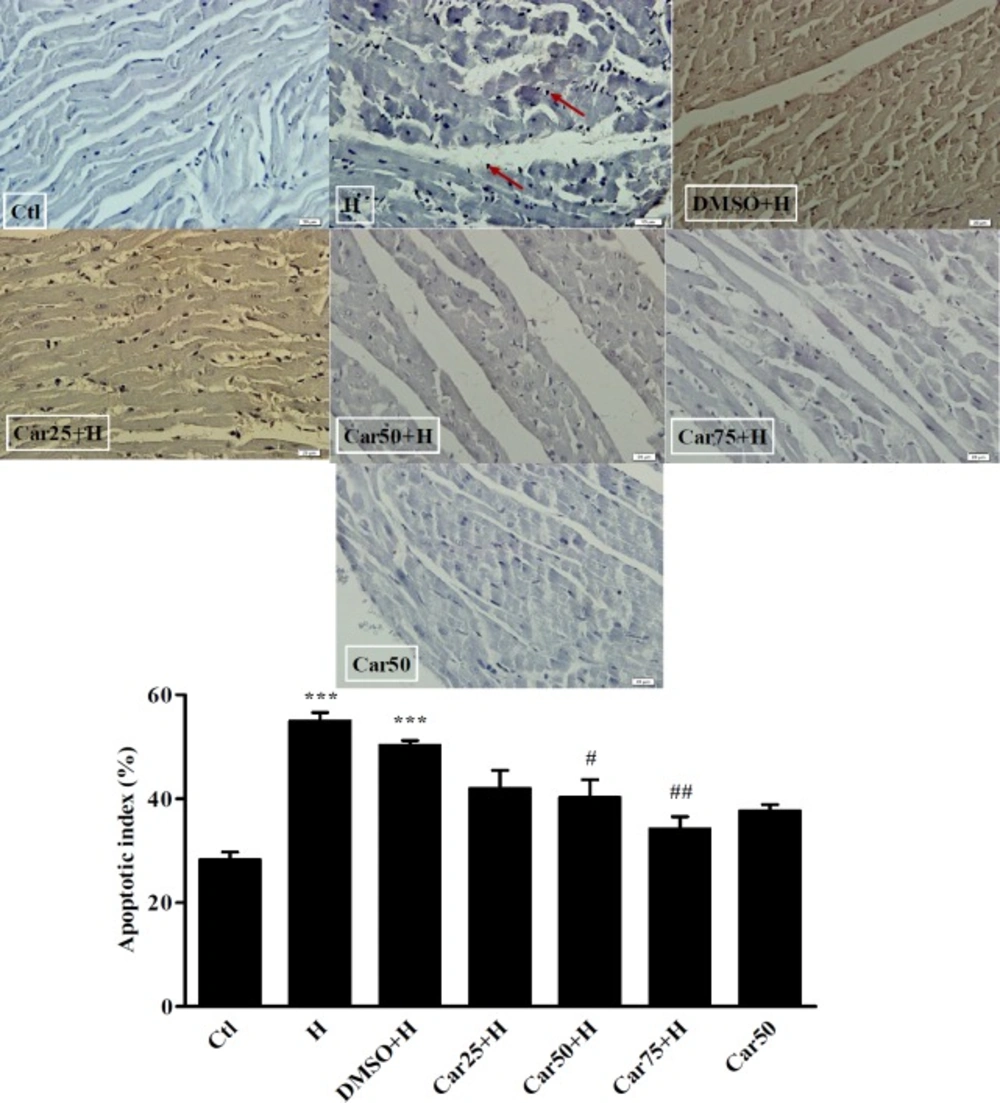
TUNEL staining and the apoptotic rate of cardiomyocytes. Cardiomyocytes apoptosis (arrows) was detected in untreated (H) and carvacrol (Car+H) treated rats subjected to aortic banding-induced hypertrophy. Intact animals served as control (Ctl). DMSO used as the solvent of carvacrol. Animals were treated with 25, 50 and 75 mg/kg/day of carvacrol for three weeks. In H group the apoptotic index was increased significantly. In Car50+H and Car75+H groups it was far less than that in the H group. Data are expressed as mean ± SEM. ***P < 0.001 vs. Ctl, #P < 0.05 and ##P < 0.01, vs. H group
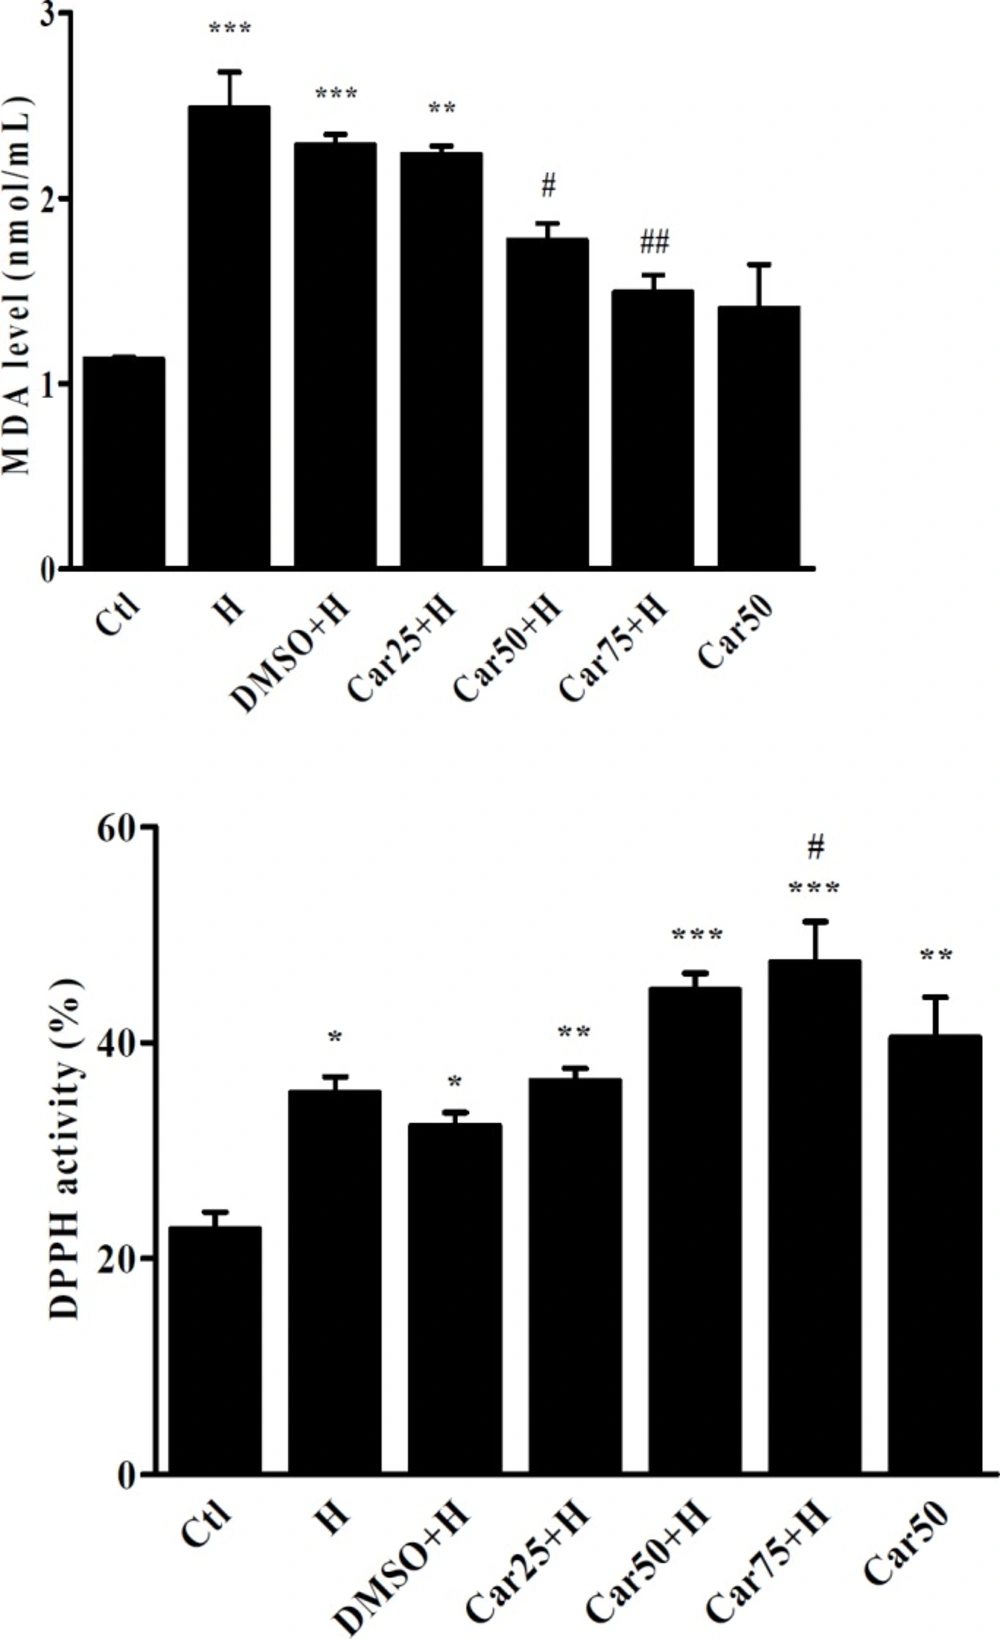
Serum concentration of Malondealdehyde (MDA) and 2-2-diphenyl 1-picril-hydrasil (DPPH) radical scavenging activity. MDA and DPPH activity were measured in the serum of untreated (H) carvacrol (Car+H) treated rats subjected to aortic banding-induced hypertrophy. Intact animals served as control (Ctl). DMSO used as the solvent of carvacrol. Animals were treated with 25, 50 and 75 mg/kg/day of carvacrol for three weeks. Data are expressed as mean ± SEM. *P < 0.05, **P < 0.01, ***P < 0.001 vs. Ctl, #P < 0.05 and ##P < 0.01, vs. H group
MTT (3-[4, 5-dimethylthiazol-2-yl]-2, 5-diphenyl-tetrazolium bromide) assay
To assess the effect of carvacrol on H9c2 cells viability, the sub confluent cells were treated with different concentrations of carvacrol (100, 50, 25, 10, 5, 2.5, 1, 0.1, and 0.01 μmol/L) diluted from carvacrol stock (66000 μmol/L dissolved in DMSO) for twenty-four hours. After treatment with drug, the medium was replaced by 20 μL of MTT (5 mg/mL dissolved in PBS) per well incubated in 37 °C for three hours. After removing MTT from wells, 150 μL of DMSO (Cinagen®, Iran) was added to each well. Optical density was read at 570 and 630 nm on a multi well ELISA reader (Biotech Instrument Model- Box998). The percentage of cell viability was measured in comparison with the control group.
RNA Isolation and real time RT-PCR assay
The tissue of left ventricle and the cellular samples were lysed by RNX-plus solution (Sinagen, Iran) and homogenized (T10Bhomogenizer- Germany).
The extraction processes were followed according to the manufacturer′s instructions. To estimate the RNA concentration with spectrophotometry using the nanodrop set (Biotech Instrument Model- Box998), a concentration of the sample was read at 260 nanometer wavelength. The extracted RNA was immediately used in cDNA synthesis or preserved in -80 ºC freezer. To prepare cDNA, the reverse transcription reaction was performed using RevertAid™M-MuLV Reverse transcriptase (Fermentas, USA). After optimization of the reaction, the cDNAs pertaining to the experimental groups were obtained by MasterMix containing cyber green (Takara) and specific primers under RT-PCR reaction. The sequence of the primers was used is summarized in
Table 1.
The Beta-actin gene was considered as the reference gene. The ratio of expression of the target gene to the reference gene was estimated according to 2-ΔΔct method.
Antioxidant capacity of carvacrol by the use of DPPH
The antioxidant effect of carvacrol was assessed by 2-2-diphenyl 1-picril-hydrasil (DPPH Merck, Germany). DPPH solution (400 µL), phosphate buffer (380 µL, pH 7.4) and serum (20 µL) were mixed and placed at ambient temperature for 30 min. The samples absorption was read by nanodrop set (Biotech Instrument Model- Box998) at 517 nanometer wavelength (
24) .DPPH along with methanol and phosphate buffer were used as control. The antioxidant capacity of carvacrol was calculated with DPPH using the following formula:
DPPH radical scavenging activity% = [(ODcontrol – ODsample) ÷ ODcontrol] × 100
Malondialdehyde Measurement
To measure the serum MDA level, 100 µL of serum, 5 µL of butilated toluene hydroxide, and 400 µL of 5% triclorostic acid were mixed and the prepared solution was centrifuged for 10 min at 300 rpm. After removing 200 µL of the obtained solution, 150 µL of thiobarbitoric was added to it and the mixture was placed in 95 ºC for 1 h. Then, it was preserved at -4 ºC and the absorption rate was measured at 532 and 572 nanometer wavelengths (
25). To determine the concentration of MDA, tetroxypropan was used as control to plot the standard curve.
TUNEL assays
Three slides from each heart were evaluated for cardiomyocytes apoptosis detection using a TUNEL assay kit (TUNEL Assay, Roche Applied Science) according to the manufacturer′s instructions. Briefly, the cardiac tissue slices deparaffinized in xylenes and rehydrated at gradient concentration ethanol. Proteinase k was added to increase membrane permeability.
TUNEL mix and PI (Propidium iodide) were used for labeling and tracing. After washing, the slices were examined with the light microscope at 400x magnification. The numbers of total and TUNEL-positive cells were counted in each field. The results were expressed as apoptotic index (number of TUNEL-positive myocytes/total myocytes) × 100%.
Statistical analysis
Data are presented as mean ± standard error of mean (SEM). Hemodynamic values were analyzed by the Kruskal–Wallis test with Dunn’s post-test for multiple comparison. Other statistical significances were evaluated using One-way analysis of variance (ANOVA), followed by Tukey′s multiple comparison post-hoc test. Statistical significance was designated at P < 0.05. Statistical analysis was performed using Prism-5 software.