
1. Background
Malignant tumors in the nasal cavity and paranasal sinuses are rare entities, accounting for 3% of all head and neck malignancies and 1% of all cancers (1). These neoplasms are highly diverse, ranging from lymphomas to carcinomas and different types of sarcomas (2). Sinonasal malignancies are subdivided into epithelial and non-epithelial types. Squamous cell carcinoma (SCC) is the most common epithelial subtype, while olfactory neuroblastoma, mucosal melanoma, malignant lymphoma, and extramedullary plasmacytoma (EMP) are the non-epithelial subtypes (3).
EMP is a plasma cell neoplasm involving the soft tissue, without bone marrow involvement or other systemic features of multiple myeloma (4). It is an extremely rare entity, accounting for 3% of all plasmacytomas (5) and 1% of all head and neck tumors. It is also responsible for 4% of non-epithelial neoplasms of the sinonasal tract (6, 7). EMP has some common clinical features and is often associated with soft tissue swelling and nasal symptoms, such as nasal blockage; it may also cause nasal discharge and epistaxis. Besides, pain, proptosis, and cervical lymphadenopathy have been reported; less commonly, cranial nerves may be also affected, causing paresis (8). However, these findings are often non-specific and may lead to the misdiagnosis of sinonasal malignancies.
Although both computed tomography (CT) and magnetic resonance imaging (MRI) provide useful information for diagnosing EMP, many imaging features of these tumors are non-specific and similar to those of other more common malignancies, such as sinonasal non-Hodgkin’s lymphoma (NHL) and SCC (8). Therefore, knowledge of the specific imaging features of sinonasal EMP can be useful in the diagnosis of sinonasal malignancies. Moreover, distinguishing between EMP, NHL, and SCC is clinically important, because their treatment strategies are completely different.
2. Objectives
In this study, we aimed to analyze the CT and MR images of sinonasal EMP, NHL, and SCC patients to identify the characteristic features distinguishing EMP from NHL and SCC.
3. Patients and Methods
3.1. Study Design
The present study is an applied, cross-sectional research.
3.2. Study Population
The medical and imaging records of the patients were retrieved and analyzed retrospectively. Thirty-seven patients pathologically diagnosed with sinonasal EMP, 46 patients diagnosed with NHL, and 44 patients diagnosed with SCC were included in this study. Data were collected from seven institutions between January 1999 and December 2018. We only included patients with definite sinonasal malignancies on paranasal sinus CT or MR images, as well as histopathological findings clearly indicating the characteristics of EMP, NHL, or SCC. On the other hand, patients who had previously received chemotherapy, radiotherapy, or surgery were excluded.
This study was conducted according to the principles of the Declaration of Helsinki and its appendices. The ethics committee of our institute approved this study (code: H-1910-034-084).
3.3. Image Analysis
A radiologist specialized in head and neck imaging (with 28 years of experience), besides two otolaryngologists specialized in rhinology (with 6 and 16 years of experience, respectively), reviewed all images by consensus. The CT and MR images were evaluated for tumor volume, homogeneity, apparent diffusion coefficient (ADC), and degree of enhancement. Moreover, bone destruction around tumor and tumor invasion to Waldeyer’s ring and cervical or retropharyngeal lymph nodes were assessed.
The tumor volume was determined by measuring the region of interest (ROI) in the picture archiving and communication system (PACS) program. The axial area of a cross-section was then multiplied by the interval of slices (mm) and the total number of tumor slices to calculate the tumor volume. The tumor homogeneity on CT and MR images was classified as homogeneous or heterogeneous. If the signal intensity of a tumor was within 10% of the median value on 90% of voxels within the tumor, the tumor was classified as homogeneous (Figure 1).
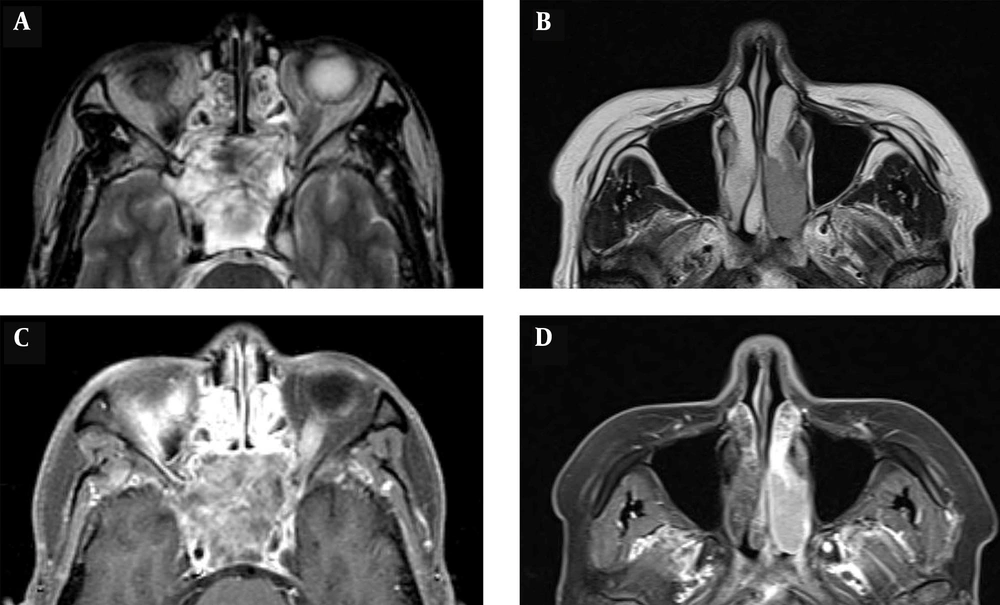
Figure 1.
Assessment of tumor homogeneity. Extramedullary plasmacytoma (EMP) is considered heterogeneous (A and C) and non-Hodgkin’s lymphoma (NHL) is considered homogeneous (B and D). A and B, Axial T2W MR images; and C and D: Axial gadolinium-enhanced T1W MR images.
Moreover, ADC maps were used to measure the ADCs by placing the ROI over the tumor and tabulating the mean ADC (Figure 2). The degree of enhancement was also categorized into two groups: (1) avid, when enhancement was equal to or greater than that of the nasal mucosa; and (2) minimal, when enhancement was lower than that of the nasal mucosa (Figure 3). Additionally, the adjacent bone destruction was estimated on CT images using a bone algorithm (Figure 4). If lingual or palatine tonsils were involved, tumor invasion to Waldeyer’s ring was considered.
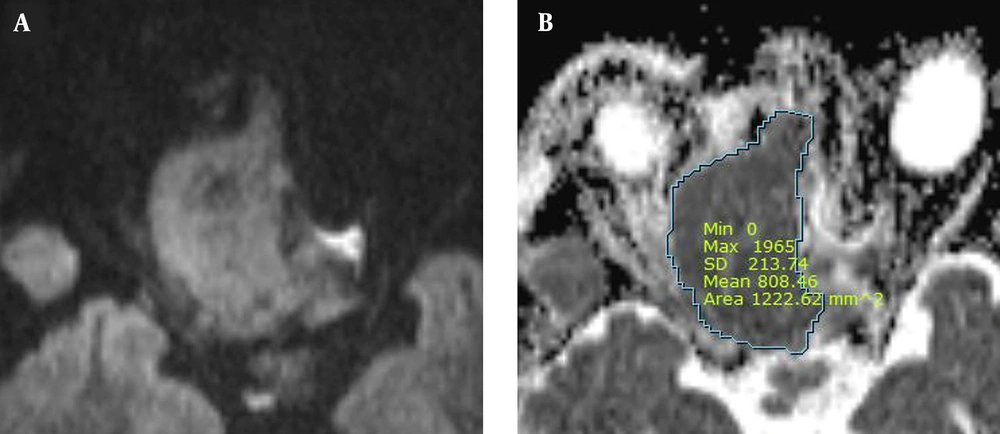
Figure 2.
Measurement of apparent diffusion coefficients (ADCs). The mass shows high signal intensity in the diffusion-weighted image (A) and low signal intensity in the ADC map (B). The ADC is 0.808 × 10⁻³ mm2/s.
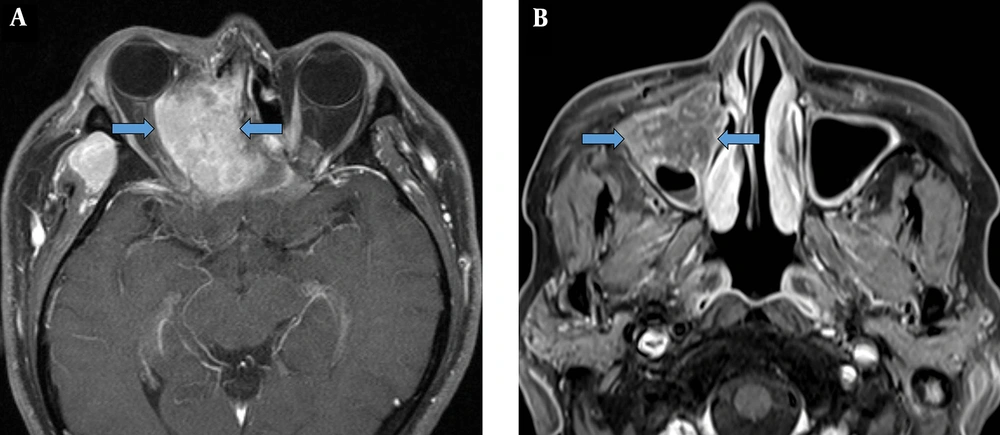
Figure 3.
Assessment of enhancement degree. Axial gadolinium-enhanced T1W MR images of sinonasal extramedullary plasmacytoma (EMP) show avid (blue arrows) (A) and minimal (B) enhancement (blue arrows).
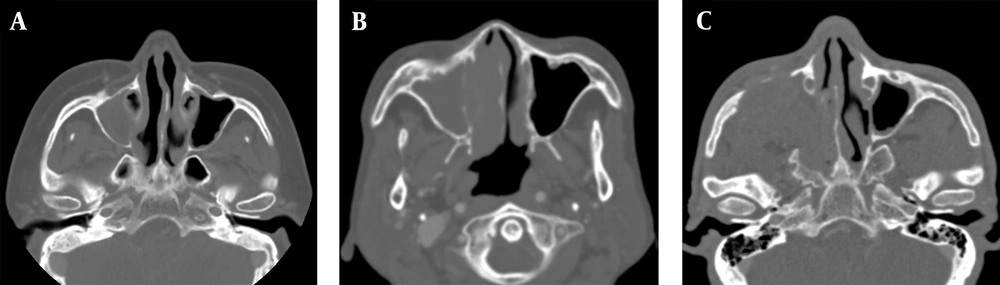
Figure 4.
Assessment of adjacent bone destruction. A, A patient with extramedullary plasmacytoma (EMP) shows no bone destruction in the right maxillary sinus wall; B, A patient with non-Hodgkin’s lymphoma (NHL) shows an erosive change of the right maxillary sinus wall; C, Bone destruction is seen in the right maxillary sinus walls in a patient with squamous cell carcinoma (SCC).
3.4. Statistical Analysis
The tumor volume and ADC were analyzed using one-way ANOVA (SPSS 23.0; IBM Inc., Chicago, IL, USA). The homogeneity of tumor, degree of enhancement, destruction of the adjacent bone, and tumor invasion to Waldeyer’s ring and cervical or retropharyngeal lymph nodes were also investigated using Kruskal-Wallis test. Data are presented as mean ± standard deviation (SD). P-value < 0.05 was considered statistically significant.
If statistical significance was observed in multiple comparisons, a post hoc test was conducted to identify significantly different groups. Moreover, a Scheffe test was performed as a post hoc test to assess differences in tumor volume and ADC among different groups; the adjusted level of significance was P < 0.05. Moreover, a Bonferroni correction was applied to assess significant differences in the homogeneity of tumor, degree of enhancement, adjacent bone destruction, and tumor invasion to Waldeyer’s ring and cervical or retropharyngeal lymph nodes. In this test, P-value < 0.0167 was considered as the adjusted level of significance.
4. Results
4.1. Clinical Characteristics
Thirty male and seven female patients diagnosed with EMP (mean age: 52.5 years; age range: 28 - 86 years), 28 male and 18 female patients diagnosed with NHL (mean age: 59.4 years; age range: 28 - 89 years), and 27 male and 17 female patients diagnosed with SCC (mean age: 66.7 years; age range: 40 - 88 years) were evaluated in this study. In the EMP, NHL, and SCC groups, 28, 44, and 41 CT images and 21, 24, and 33 MR images were available for analysis, respectively.
The NHL patients were divided into diffuse large B cell (n = 14) and natural killer T cell (n = 32) subgroups. The SCC patients were also categorized into well differentiated (n = 19), moderately differentiated (n = 16), and poorly differentiated (n = 9) subgroups, based on their histopathological findings. The most common site of tumor growth was the nasal cavity, followed by the maxillary sinus and sphenoid sinus in the EMP and SCC groups and maxillary sinus and ethmoid sinus in NHL patients. The patients’ characteristics are summarized in Table 1.
Table 1.
The Patients’ Characteristicsa
| Characteristics | EMP | NHL | SCC |
|---|---|---|---|
| Age, y | 52.5 ± 13.9 | 59.4 ± 15.9 | 66.7 ± 13.2 |
| Sex | |||
| Male | 30 (81.1) | 28 (60.9) | 27 (61.4) |
| Female | 7 (18.9) | 18 (39.1) | 17 (38.6) |
| Modality (n) | |||
| CT | 28 | 44 | 41 |
| MRI | 21 | 24 | 33 |
| Histological subtype | |||
| Diffuse large B cell lymphoma | 14 (30.4) | ||
| Natural killer T cell lymphoma | 32 (69.6) | ||
| SCC | 44 (100) | ||
| Well differentiated | 19 (43.2) | ||
| Moderately differentiated | 16 (36.4) | ||
| Poorly differentiated | 9 (20.4) | ||
| Tumor origin site | |||
| Nasal cavity | 18 (48.7) | 36 (78.3) | 31 (70.5) |
| Maxillary sinus | 12 (32.4) | 5 (10.9) | 8 (18.2) |
| Ethmoid sinus | 3 (6.5) | 2 (4.5) | |
| Sphenoid sinus | 4 (10.8) | 2 (4.5) | |
| Frontal sinus | 1 (2.3) | ||
| Nasopharynx | 3 (8.1) | 2 (4.3) |
Abbreviations: EMP, extramedullary plasmacytoma; NHL, non-Hodgkin’s lymphoma; SCC, squamous cell carcinoma; SD, standard deviation.
aValues are expressed as No. (%) or mean ± SD.
4.2. Tumor Volume
The mean tumor volume was 2.67 × 10⁴ ± 3.22 × 104 mm3 (range: 0.05 × 10⁴ - 11.54 × 104 mm3) in the EMP group, 2.07 × 10⁴ ± 1.83 × 104 mm3 (range: 0.11 × 10⁴ - 8.12 × 104 mm3) in the NHL group, and 2.02 × 10⁴ ± 1.90 × 104 mm3 (range: 0.03 × 10⁴ - 7.47 × 104 mm3) in the SCC group. Although the tumor volume was larger in the EMP group as compared to NHL and SCC groups, the difference was not significant (P = 0.57) (Table 2).
Table 2.
The Imaging Findings of Sinonasal EMP, NHL, and SCCa
| Parameters | EMP | NHL | SCC | P-value |
|---|---|---|---|---|
| Tumor volume, × 104 mm3 | 2.67 ± 3.22 | 2.07 ± 1.83 | 2.02 ± 1.90 | 0.571 |
| Tumor homogeneity | ||||
| CT | 21/28 (75.0) | 37/44 (84.0) | 20/41 (48.8) | 0.002 |
| T1WI | 10/21 (47.6) | 20/24 (83.3) | 26/33 (78.8) | 0.015 |
| T2WI | 7/21 (33.3) | 16/24 (66.7) | 9/33 (27.3) | 0.008 |
| Gd-T1WI | 6/20 (30.0) | 16/24 (66.7) | 9/33 (27.3) | 0.006 |
| ADC, 10-3 mm2/s | 0.66 ± 0.16 | 0.60 ± 0.33 | 0.96 ± 0.24 | < 0.001 |
| Degree of enhancement | 0.617 | |||
| Avid | 12/20 (60.0) | 15/24 (62.5) | 24/33 (72.7) | |
| Minimal | 8/20 (40.0) | 9/24 (37.5) | 9/33 (27.3) | |
| Adjacent bone destruction | 13/28 (46.4) | 13/44 (29.6) | 35/41 (85.4) | < 0.001 |
| Invasion to Waldeyer’s ring | 7/37 (18.9) | 6/46 (13.0) | 1/44 (2.3) | 0.036 |
| Cervical lymph node metastasis | 10/37 (27.0) | 14/46 (30.4) | 10/44 (22.7) | 0.711 |
| Retropharyngeal lymph node metastasis | 5/46 (10.9) | 3/44 (6.8) | 0.118 |
Abbreviations: EMP, extramedullary plasmacytoma; NHL, non-Hodgkin’s lymphoma; SCC, squamous cell carcinoma; SD, standard deviation. ADC, apparent diffusion coefficient.
aValues are expressed as No. (%) or mean ± SD.
4.3. Tumor Homogeneity
On CT images, 75.0% (21/28), 84.0% (37/44), and 48.8% (20/41) of tumors in the EMP, NHL, and SCC groups showed homogeneity, respectively. On T1-weighted (T1W), T2-weighted (T2W), and post-contrast MR images, tumor homogeneity was observed in 47.6% (10/21), 33.3% (7/21), and 30.0% (6/20) of tumors in the EMP group; in 83.3% (20/24), 66.7% (16/24), and 66.7% (16/24) of tumors in the NHL group; and 78.8% (26/33), 27.3% (9/33), and 27.3% (9/33) of tumors in the SCC group, respectively. Tumor homogeneity was the highest in the NHL group, both on CT and MR images (Table 2). Following the Bonferroni correction, the NHL group showed a higher tumor homogeneity as compared to the SCC group on CT, T2W, and post-contrast MR images (P = 0.001, P = 0.003, and P = 0.005, respectively); also, EMP showed a higher heterogeneity as compared to NHL on T1W images (P = 0.011) (Table 3).
Table 3.
A Post Hoc Analysis of Sinonasal EMP, NHL, and SCCa
| Parameters | EMP vs. NHL | EMP vs. SCC | NHL vs. SCC |
|---|---|---|---|
| Tumor homogeneity | |||
| CT | 0.342 | 0.029 | 0.001 |
| T1WI | 0.011 | 0.018 | 0.668 |
| T2WI | 0.026 | 0.634 | 0.003 |
| Gd-T1WI | 0.021 | 0.831 | 0.005 |
| ADC, 10-3 mm2/s | 0.751 | 0.044 | < 0.001 |
| Adjacent bone destruction | 0.208 | 0.001 | < 0.001 |
| Invasion to Waldeyer’s ring | 0.550 | 0.021 | 0.111 |
Abbreviations: EMP, extramedullary plasmacytoma; NHL, non-Hodgkin’s lymphoma; SCC, squamous cell carcinoma; ADC, apparent diffusion coefficient.
aP-values are presented.
4.4. ADC
The ADC was 0.66 × 10⁻³ ± 0.16 × 10⁻³ mm2/s (range: 0.38 × 10⁻³ - 0.87 × 10⁻³ mm2/s) in the EMP group, 0.60 × 10⁻³ ± 0.33 × 10⁻³ mm2/s (range: 0.10 × 10⁻³ - 1.69 × 10⁻³ mm2/s) in the NHL group, and 0.96 × 10⁻³ ± 0.24 × 10⁻³ mm2/s (range: 0.62 × 10⁻³ - 1.78 × 10⁻³ mm2/s) in the SCC group. Based on the results, the ACC was markedly lower in the EMP and NHL groups as compared to the SCC group (P < 0.001) (Table 2). Moreover, the post hoc Scheffé test showed a significant difference between the EMP and SCC groups and between the NHL and SCC groups (P = 0.04 and P < 0.001, respectively). However, the ADCs were not significantly different between the EMP and NHL groups (P = 0.75) (Table 3).
4.5. Degree of Enhancement
In most cases, the tumors showed avid enhancement, without any significant difference between the EMP, NHL, and SCC groups (P = 0.62) (Table 2).
4.6. Adjacent Bone Destruction
The bone attached to the tumor was destructed in 46.4% of cases in the EMP group (13/28), 29.6% of cases in the NHL group (13/44), and 85.4% of cases in the SCC group (35/41). Bone tissue destruction was significantly more frequent in the SCC group as compared to the EMP and NHL groups (P < 0.001) (Table 2). Following the Bonferroni correction, differences between the EMP and SCC groups and between the NHL and SCC groups were significant (P = 0.001 and P < 0.001, respectively) (Table 3).
4.7. Tumor Invasion to Waldeyer’s Ring and Cervical or Retropharyngeal Lymph Nodes
Tumor invasion to Waldeyer’s ring was seen in 18.9% of cases in the EMP group (7/37), 13.0% of cases in the NHL group (6/46), and 2.3% (1/44) of cases in the SCC group; it was significantly higher in the EMP and NHL groups as compared to SCC (P = 0.03) (Table 2). However, after the Bonferroni correction, differences were not statistically significant (Table 3). There was also no significant difference between the three tumor types regarding cervical or retropharyngeal lymph node metastasis (P = 0.11) (Table 2).
5. Discussion
The early signs and symptoms of malignant sinonasal neoplasms are similar to those of inflammatory diseases, such as rhinosinusitis; therefore, they are considered non-specific. The clinical presentations of patients with malignancies generally depend on the mass effects and the tumor-involved site (8). Besides, sinonasal malignancies can be divided into several histological subtypes, because the tract including the nasal cavity and paranasal sinus has the greatest histological diversity in the body (9). For the mentioned reasons, the diagnosis of primary sinonasal malignancies is often challenging and can be only confirmed when the disease reaches an advanced stage (10).
EMPs are isolated malignant neoplasms, comprising less than 10% of all plasma cell tumors (5). However, more than 80% of these rare tumors manifest in the head and neck, with approximately 80% of them occurring within the sinonasal cavity (6, 7). Despite the characteristic histological and immunohistochemical features of sinonasal EMP, it is still challenging for both clinicians and radiologists to diagnose it, and the primary radiological differential diagnosis is often NHL and SCC, but not EMP.
The EMP of the nasal tract is a bulky homogenous mass or an infiltrative lesion with intermediate signal intensity on T1W MRI and moderate-to-high signal intensity on T2W MRI (8). Other features of the nasal tract EMP include moderate to marked contrast enhancement and lytic adjacent bone destruction (8). In a comparative analysis of sinonasal NHL and SCC, a larger tumor volume, higher tumor homogeneity, lower ADC, and less frequent adjacent bone destruction were observed in NHL as compared to SCC (11).
Generally, it is very difficult to find distinctions between EMP, NHL, and SCC without a histopathological examination. However, specific imaging features can be helpful in diagnosing sinonasal malignancies, especially because tumor biopsy may be difficult to access, and the biopsy results may be inconclusive. To the best of our knowledge, this is the first study to identify the CT and MR imaging features differentiating EMP from NHL and SCC, originating from the nasal cavity and paranasal sinuses.
In the present study, tumor homogeneity, ADC, adjacent bone destruction, and invasion to Waldeyer’s ring were significantly different between the EMP, NHL, and SCC groups. The highest tumor homogeneity was found in the NHL group on both CT and MR images. On CT, T2W, and post-contrast MR images, a higher tumor homogeneity was found in NHL compared to SCC, as similarly reported in comparisons of primary nasopharyngeal lymphoma with nasopharyngeal carcinoma (12).
EMP was more heterogenous than NHL, with moderate signal intensity on T1W images. EMP and NHL showed significantly lower ADCs as compared to SCC. Overall, ADCs in diffusion-weighted images may be strongly associated with tumor cellularity, suggesting a significantly higher tumor cellularity in EMP and NHL as compared to SCC (11). Based on the findings, tumor growth involving the adjacent bone was more frequent in SCC as compared to EMP or NHL. While cervical and retropharyngeal lymphadenopathy did not allow distinctions between the three malignancies, invasion to Waldeyer’s ring was significantly more common in EMP and NHL as compared to SCC. However, following the Bonferroni correction for multiple comparisons, EMP showed a higher heterogeneity on T1W images compared to NHL, besides lower ADCs and less adjacent bone destruction compared to SCC (Figure 5).
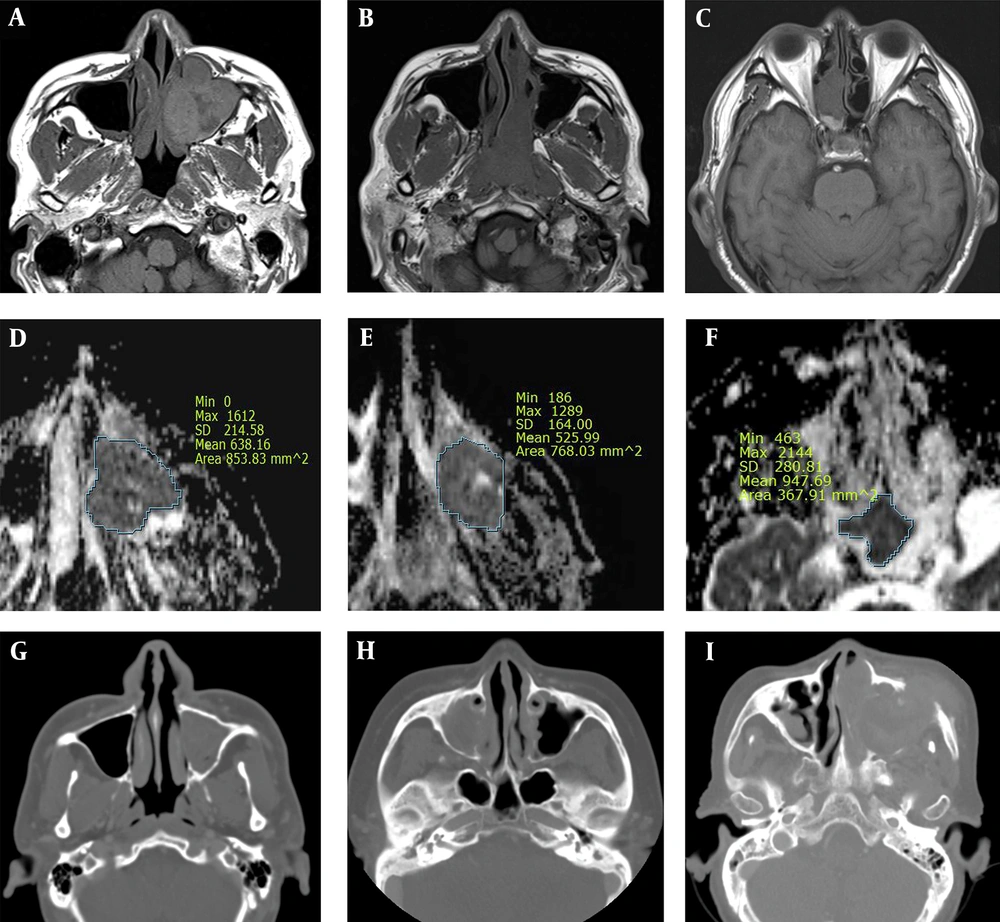
Figure 5.
A comparative analysis of sinonasal extramedullary plasmacytoma (EMP) (A, D, and G), non-Hodgkin’s lymphoma (NHL) (B, E, and H) and squamous cell carcinoma (SCC) (C, F, and I). EMP shows a higher heterogeneity on T1W images as compared to NHL, besides lower ADCs and less adjacent bone destruction as compared to SCC. A, B, and C, Axial T1W MR images; D, E, and F, Axial ADC maps; and G, H, and I, CT images.
In the present study, moderate signal intensity was seen on both T1W and T2W images in patients with EMP, NHL, and SCC with avid enhancement in post-contrast T1W images. There was no significant difference in terms of signal intensity on T1W and T2W images, and no significant enhancement difference was observed in contrast-enhanced CT and MR images. Although positron emission tomography (PET)/CT parameters were not analyzed in our study, previous studies have shown that the maximum standard unit value (SUVmax) on PET/CT does not differentiate NHL from SCC in the sinonasal cavity and nasopharynx (11, 12).
The limitations of this study include the relatively small number of patients and the inconsistent range of disease stages. These limitations can be partly attributed to the characteristics of EMP, including its rarity and late presentation, as well as difficult diagnosis. Further prospective studies are required on a larger sample size to support our findings.
In conclusion, it is generally difficult to differentiate sinonasal EMP from NHL and SCC only based on their respective clinical features. The present results showed that CT and MRI can improve the accurate diagnosis of these diseases. For a sinonasal mass with marked heterogeneity on T1W images, low ADC, and no adjacent bone destruction according to MRI or CT images, a diagnosis of EMP is favored over NHL or SCC.