


1. Background
2. Objectives
3. Patients and Methods
3.1. Inclusion and Exclusion Criteria
3.2. Grouping Criteria
3.3. Methods of Examination
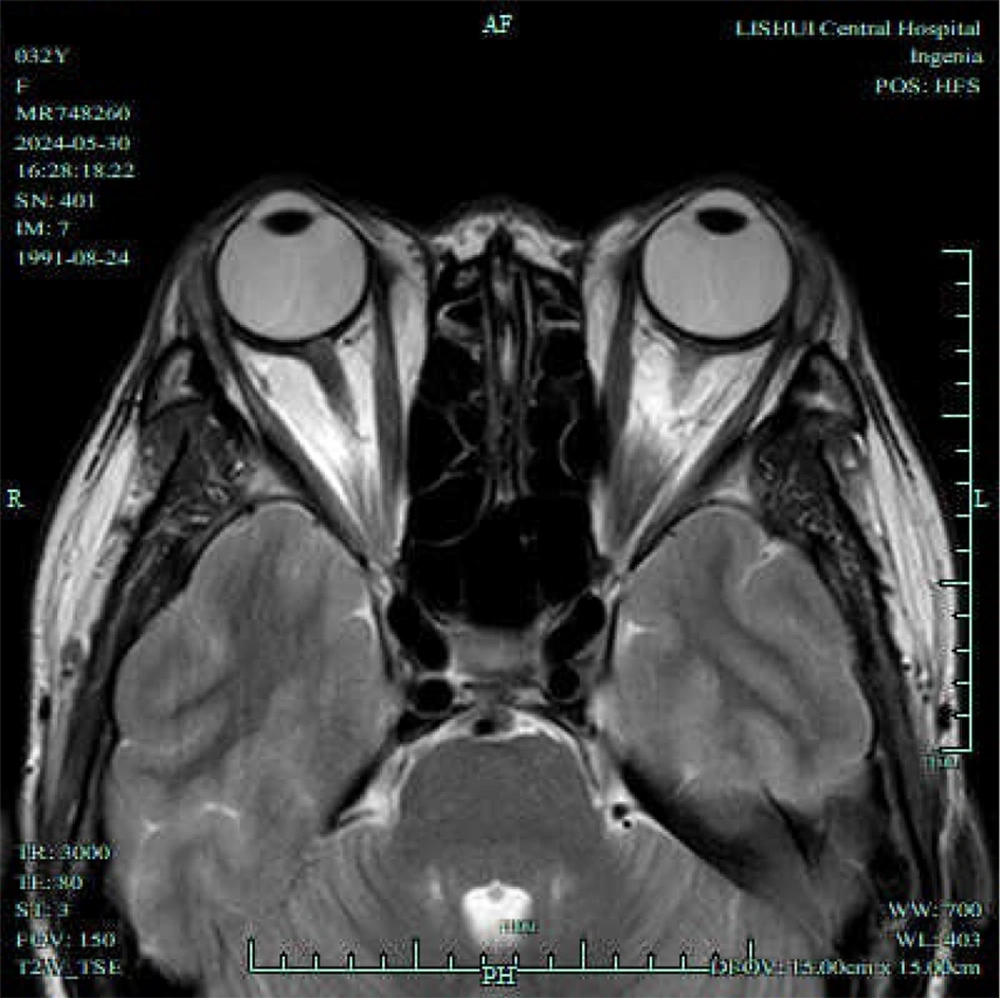
Cross-sectional measurement of extraocular muscles (EOMs)
3.4. Statistical Analysis
4. Results
4.1. Comparison of General Characteristics Between the Active and Inactive Groups, and Progression and Non-progression Groups
| Groups | No. | Gender (No. %) | Age (y) | Disease duration (mon) | TSH (mIU/L) | FT4 (pmol/L) | FT3 (pmol/L) | CAS (points) | |
|---|---|---|---|---|---|---|---|---|---|
| Man | Woman | ||||||||
| Active group | 30 | 12 (40.00) | 18 (60.00) | 36.42 ± 5.38 | 6.12 ± 1.04 | 12.95 ± 1.85 | 14.82 ± 2.30 | 12.46 ± 1.14 | 2.56 ± 0.40 |
| Inactive group | 48 | 19 (39.58) | 29 (60.42) | 35.98 ± 5.15 | 6.35 ± 1.16 | 10.64 ± 1.76 | 11.70 ± 2.25 | 10.20 ± 1.25 | 1.12 ± 0.22 |
| χ2/t | - | 0.001 | 0.361 | 0.886 | 5.530 | 5.908 | 3.627 | 20.512 | - |
| P-value | - | 0.971 | 0.719 | 0.379 | 0.001 | 0.001 | 0.001 | 0.001 | - |
Abbreviations: TSH, thyroid-stimulating hormone; FT4, free thyroxine; FT3, free triiodothyronine; CAS, clinical activity score.
a Values are expressed as No. (%) or mean ± SD.
| Groups | No. | Gender (No. %) | Age (y) | Disease duration (mon) | TSH (mIU/L) | FT4 (pmol/L) | FT3 (pmol/L) | CAS (points) | |
|---|---|---|---|---|---|---|---|---|---|
| Man | Woman | ||||||||
| Progression group | 20 | 8 (40.00) | 12 (60.00) | 35.80 ± 5.52 | 6.04 ± 1.02 | 13.35 ± 2.16 | 15.75 ± 1.96 | 13.38 ± 1.44 | 2.70 ± 0.25 |
| Non-progression group | 50 | 21 (42.00) | 29 (58.00) | 36.22 ± 5.60 | 6.10 ± 1.14 | 11.64 ± 2.28 | 12.32 ± 2.02 | 11.56 ± 1.40 | 1.56 ± 0.20 |
| χ2/t | - | 0.024 | 0.285 | 0.205 | 2.876 | 6.471 | 4.874 | 20.028 | - |
| P-value | - | 0.878 | 0.777 | 0.838 | 0.005 | 0.001 | 0.001 | 0.001 | - |
Abbreviations: TSH, thyroid-stimulating hormone; FT4, free thyroxine; FT3, free triiodothyronine; CAS, clinical activity score.
a Values are expressed as No. (%) or mean ± SD.
4.2. Comparison of Measurement Parameters Between the Active and Inactive Groups, and Progression and Non-progression Groups Using Dixon and T2 Localization
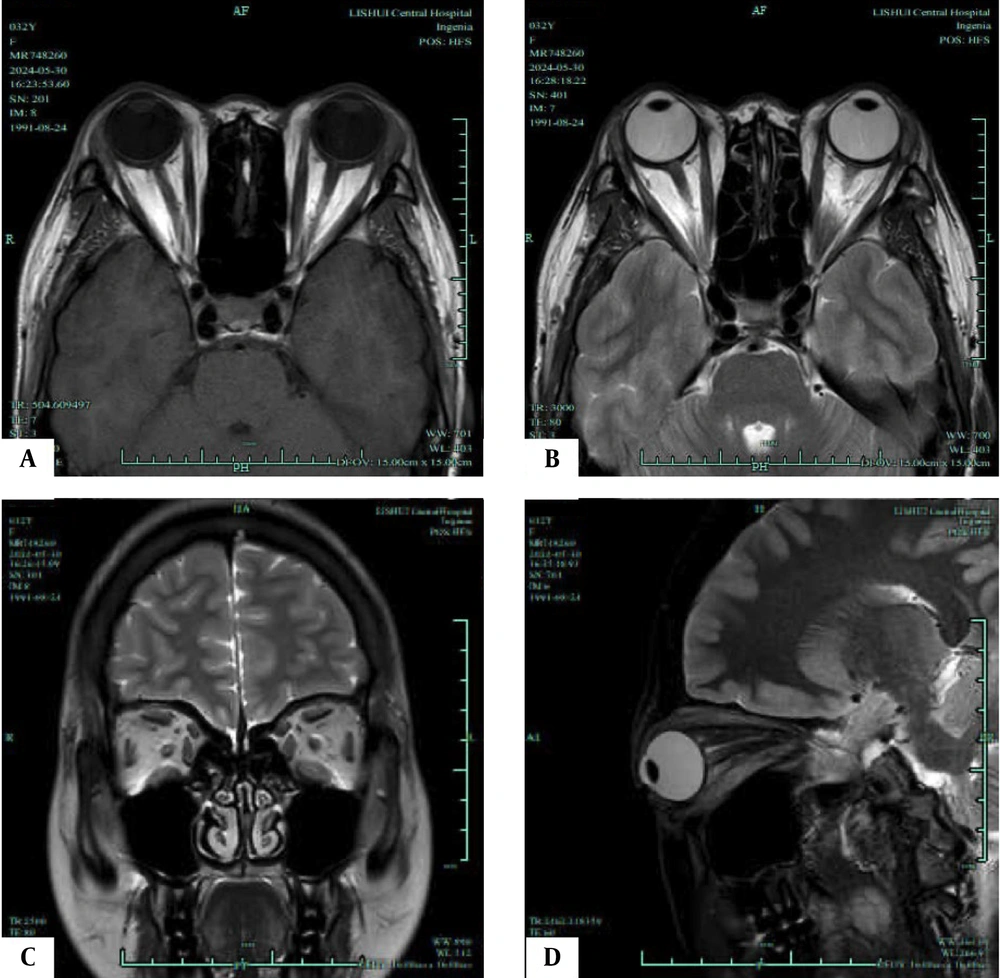
T1/T2-weighted magnetic resonance imaging (MRI) of an active phase patient. A, Axial T1-weighted MRI shows the most distinct visualization of the enlarged extraocular muscles (EOMs) during the active phase; B, Axial T2-weighted MRI highlights the same EOMs; C, Coronal T2-weighted MRI shows the most distinct visualization of the enlarged EOMs during the progression phase; D, Sagittal T2-weighted MRI highlights the same EOMs.
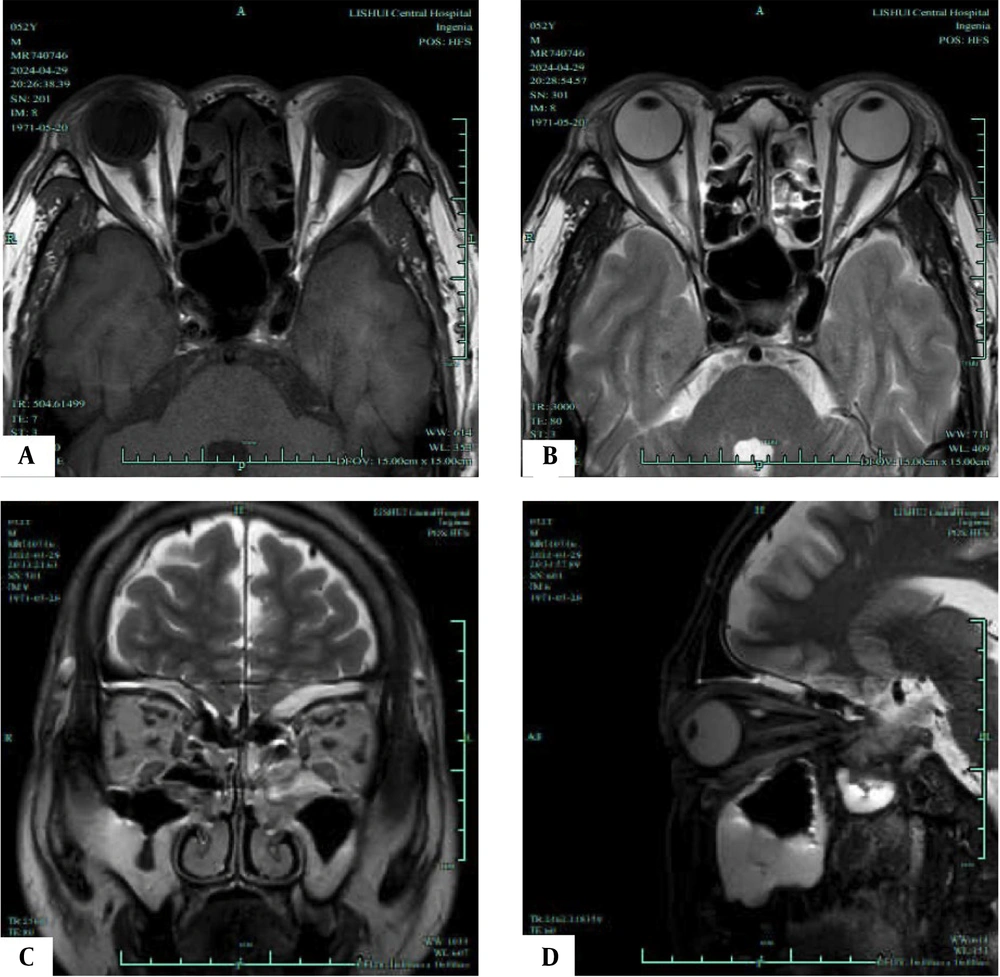
T1/T2-weighted magnetic resonance imaging (MRI) of an inactive phase patient. A, Axial T1-weighted MRI shows the most distinct visualization of the enlarged extraocular muscles (EOMs) during the inactive phase; B, Axial T2-weighted MRI highlights the same EOMs; C, Coronal T2-weighted MRI shows the most distinct visualization of the enlarged EOMs during the progression phase; D, Sagittal T2-weighted MRI highlights the same EOMs.
| Groups | No. | Average EOM water fraction | Average EOM water signal intensity | Average EOM fat signal intensity | Average lacrimal gland signal intensity | Average of unilateral four EOM fat fractions | Average EOM T2 value (ms) | Average EOM cross-sectional area (mm2) |
|---|---|---|---|---|---|---|---|---|
| Active group | 30 | 0.98 ± 0.25 | 398.96 ± 102.45 | 96.32 ± 12.15 | 79.52 ± 10.24 | 67.20 ± 8.82 | 79.45 ± 7.42 | 50.48 ± 7.22 |
| Inactive group | 48 | 0.80 ± 0.16 | 326.70 ± 80.46 | 78.90 ± 10.48 | 68.60 ± 10.12 | 50.45 ± 7.60 | 75.60 ± 6.80 | 39.60 ± 6.40 |
| t | - | 3.883 | 3.469 | 6.715 | 4.615 | 8.899 | 2.349 | 6.952 |
| P-value | - | 0.001 | 0.001 | 0.001 | 0.001 | 0.001 | 0.021 | 0.001 |
Abbreviation: EOM, extraocular muscle.
a Values are expressed as mean ± SD.
| Groups | No. | Average EOM water fraction | Average EOM water signal intensity | Average EOM fat signal intensity | Average lacrimal gland signal intensity | Average of unilateral four eom fat fractions | Average EOM T2 value (ms) | Average EOM cross-sectional area (mm2) |
|---|---|---|---|---|---|---|---|---|
| Progression group | 20 | 0.96 ± 0.18 | 409.55 ± 115.72 | 104.20 ± 13.88 | 89.62 ± 11.32 | 69.96 ± 9.15 | 81.75 ± 8.32 | 54.65 ± 7.88 |
| Non-progression group | 50 | 0.82 ± 0.15 | 330.86 ± 105.96 | 80.26 ± 9.96 | 79.38 ± 10.25 | 51.80 ± 7.90 | 76.90 ± 7.14 | 42.50 ± 6.98 |
| t | - | 3.711 | 2.734 | 8.858 | 4.123 | 9.290 | 2.738 | 7.116 |
| P-value | - | 0.001 | 0.008 | 0.001 | 0.001 | 0.001 | 0.008 | 0.001 |
Abbreviation: EOM, extraocular muscle.
a Values are expressed as mean ± SD.
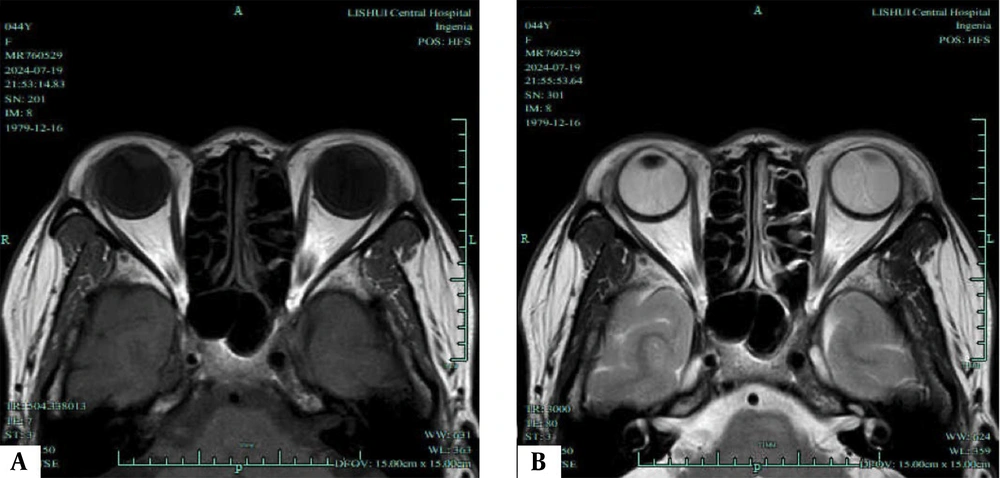
Axial T1/T2-weighted magnetic resonance imaging (MRI) of a progression phase. A, Axial T1-weighted MRI shows the most distinct visualization of the enlarged extraocular muscles (EOMs) during the progression phase; B, Axial T2-weighted MRI highlights the same EOMs
4.3. Comparison of Involvement Between the Active and Inactive Groups, and the Progression and Non-progression Groups by Dixon and T2 Localization
| Groups | No. | Involvement in orbital fat tissue | Involvement in EOMs | Involvement in lacrimal gland |
|---|---|---|---|---|
| Active group | 30 | 27 (90.00) | 26 (86.67) | 25 (83.33) |
| Inactive group | 48 | 20 (41.67) | 18 (37.50) | 16 (33.33) |
| χ2 | - | 18.009 | 18.150 | 22.284 |
| P-value | - | 0.001 | 0.001 | 0.001 |
Abbreviation: EOM, extraocular muscle.
a Values are expressed as No. (%).
| Groups | No. | Involvement in orbital fat tissue | Involvement in EOMs | Involvement in lacrimal gland |
|---|---|---|---|---|
| Progression group | 20 | 19 (95.00) | 18 (90.00) | 18 (90.00) |
| Non-progression Group | 50 | 26 (52.00) | 23 (46.00) | 20 (40.00) |
| χ2 | - | 11.505 | 11.398 | 14.391 |
| P-value | - | 0.001 | 0.001 | 0.001 |
Abbreviation: EOM, extraocular muscle.
a Values are expressed as No. (%).
4.4. Correlation Analysis Between Thyroid-Related Eye Disease Severity and Dixon and T2 Localization Measurement Indices
| Indices | CAS | |
|---|---|---|
| r | P-value | |
| Average EOM water fraction | 0.456 | 0.024 |
| Average EOM water signal intensity | 0.510 | 0.013 |
| Average EOM fat signal intensity | 0.502 | 0.015 |
| Average lacrimal gland signal intensity | 0.624 | 0.001 |
| Mean of unilateral orbital fat fraction for the four EOMs | 0.598 | 0.004 |
| Average EOM t2 value | 0.565 | 0.009 |
| Average EOM cross-sectional area | 0.612 | 0.001 |
Abbreviations: CAS, clinical activity score; EOM, extraocular muscle.
| Parameters | Cut-off | AUC (95%CI) | Sensitivity (%) | Specificity (%) | PPV (%) | NPV (%) |
|---|---|---|---|---|---|---|
| Average EOM water fraction | 0.92 | 0.82 (0.75 - 0.88) | 85.7 (76.5 - 93.2) | 82.4 (70.4 - 86.3) | 80.0 (64.0 - 82.2) | 87.5 (81.2 - 94.5) |
| Average EOM t2 value | 67.2 | 0.78 (0.71 - 0.85) | 78.6 (69.6 - 88.3) | 76.5 (63.4 - 80.2) | 73.3 (57.8 - 77.3) | 81.3 (74.6 - 90.3) |
| Average lacrimal gland signal intensity | 1.38 | 0.75 (0.67 - 0.82) | 89.3 (67.1 - 90.2) | 88.2 (71.3 - 92.1) | 86.2 (61.7 - 88.2) | 90.9 (73.4 - 92.3) |
Abbreviations: AUC, area under curve; PPV, positive predictive value; NPV, negative predictive value; EOM, extraocular muscle.


