


1. Background
2. Objectives
3. Patients and Methods
3.1. Study Design and Patient Population
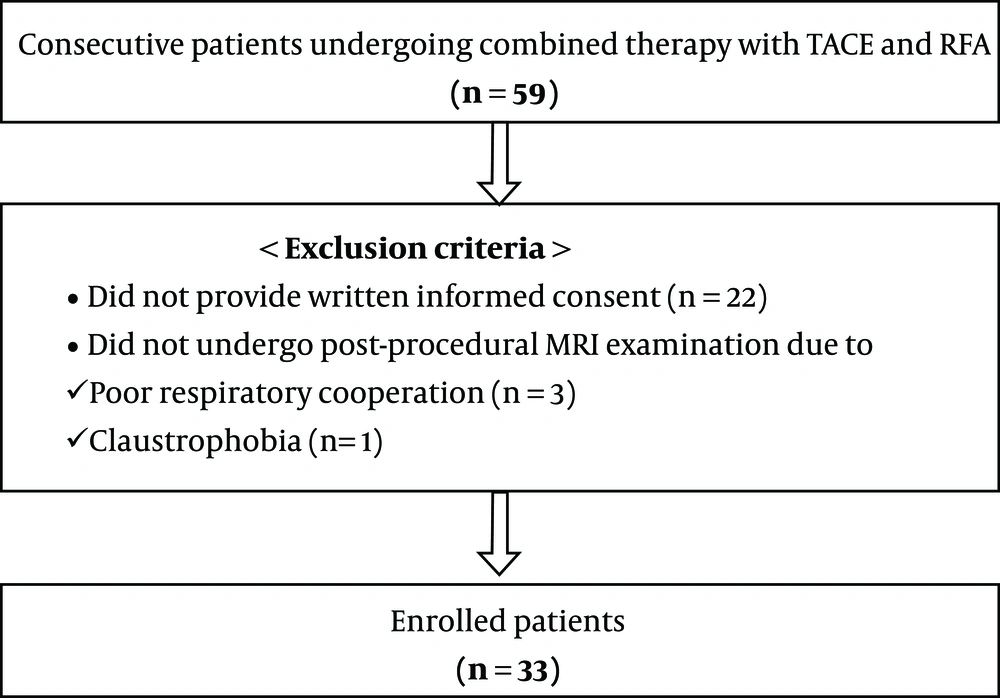
Flow diagram showing selection process for patients enrolled in this study. (RFA, radiofrequency ablation; TACE, transcatheter arterial chemoembolization)
| Characteristics | No. of cases |
|---|---|
| Patients (n = 33) | |
| Age, y | |
| Mean ± SD | 63.3 ± 9.5 |
| Range | 45 - 80 |
| Gender | |
| Male | 26 |
| Female | 7 |
| Etiology of cirrhosis | |
| Hepatitis B virus | 23 |
| Hepatitis C virus | 6 |
| Alcohol | 4 |
| Child-pugh class | |
| Class A | 33 |
| Number of HCC per patient | |
| Single | 21 |
| Two | 12 |
| HCCs (n = 45) | |
| Diameter, cm | |
| Mean ± SD | 2.88 ± 0.64 |
| Range | 2 - 5 |
| Confirmation method | |
| Histology | 7 |
| CT and MR imaging findings | 38 |
| Capsule | |
| Present/absent | 36/9 |
| Location | |
| Segment 2 | 4 |
| Segment 3 | 3 |
| Segment 4 | 4 |
| Segment 5 | 6 |
| Segment 6 | 9 |
| Segment 7 | 5 |
| Segment 8 | 14 |
| Signal intensity on MRI | |
| In-phase T1WI (low/iso/high) | 35/6/4 |
| Opposed-phase T1WI (low/iso/high) | 31/9/5 |
| T2WI (low/iso/high) | 2/5/38 |
Abbreviations: HCC, hepatocellular carcinoma; MRI, magnetic resonance imaging; SD, standard deviation; T1WI, T1 weighted image; T2WI, T2 weighted image
3.2. Transcatheter Arterial Chemoembolization
3.3. Radiofrequency Ablation
3.4. MDCT and MRI
| Imaging parameters | 3T (Magnetom TrioTim) |
|---|---|
| T1-weighted imaging (VIBE) | |
| TR/TE, ms (in-phase/opposed phase) | 3.8/2.2/1.3 |
| Section thickness, mm | 3 |
| Flip angle, deg | 9 |
| FOV | 360 × 360 |
| Matrix number | 320 × 240 |
| T2-weighted imaging (HASTE) | |
| TR/TE, ms | 2000/169 |
| Section thickness, mm | 5 |
| Interslice gap, mm | 0.5 |
| Flip angle, deg | 150 |
| FOV | 360 × 360 |
| Matrix number | 320 × 256 |
| Contrast-enhanced imaging (VIBE) | |
| TR/TE, ms | 3.4/1.23 |
| Section thickness, mm | 3 |
| Flip angle, deg | 13 |
| FOV | 360 × 300 |
| Matrix number | 320 × 195 |
Abbreviations: deg, degree (º); HASTE, half-fourier acquisition single-shot turbo-spin echo; FOV, field of view; TR, repetition time; TE, echo time; VIBE, volumetric interpolated breath-hold examination
3.5. Treatment Course and Follow-Up
3.6. Image Analysis
3.7. Statistical Analysis
4. Results
4.1. Comparison Between MDCT and MRI Regarding Presence of Target Sign
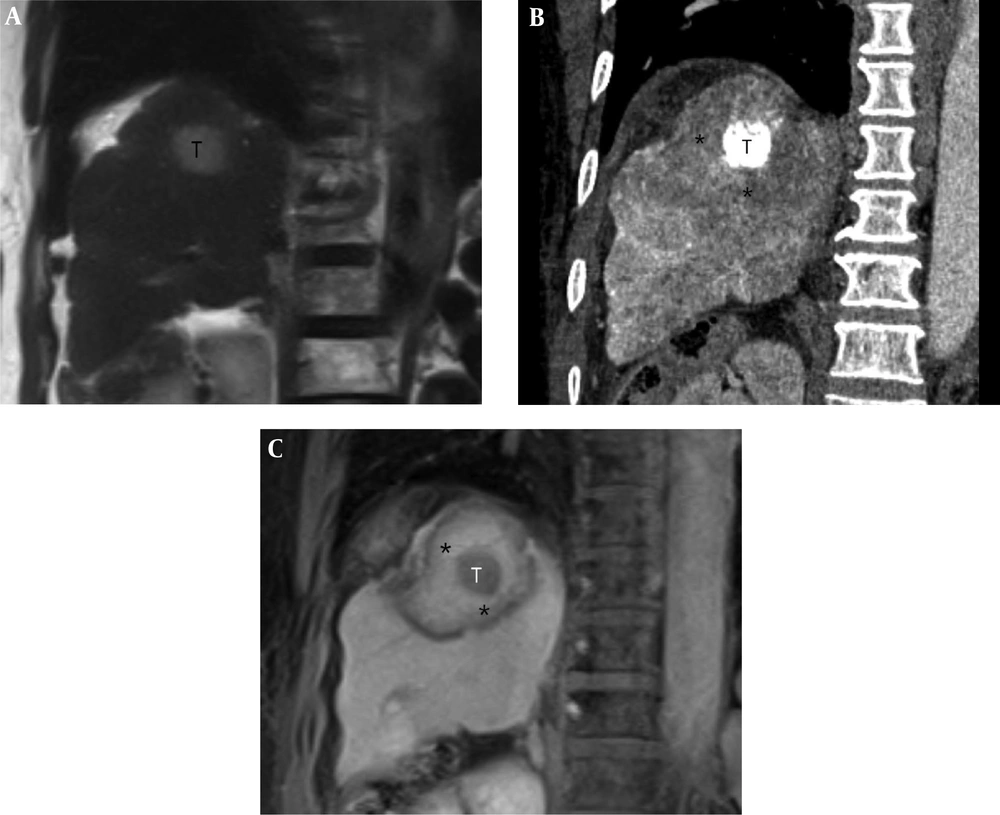
A 62-year-old woman with a 2.6-cm hepatocellular carcinoma (HCC) in the superior segment of the right hepatic lobe. A, Pre-procedural coronal T2-weighted MR image shows a 2.6-cm HCC (T) in the right hepatic dome. B, Post-procedural coronal reformatted CT image demonstrates an index tumor (T) with compact lipiodol uptake in the right hepatic dome that is visually separated from the ablative margin (AM) (*) within the ablation zone. The AM status of was classified as AM-plus. C, Post-procedural coronal contrast-enhanced T1-weighted MR image reveals the index tumor (T) within the ablation zone, which is evident as a low signal intensity (SI) lesion. The AM (*) is visible as an area with high SI and is visually separated from the index tumor. The AM status was classified as AM-plus.
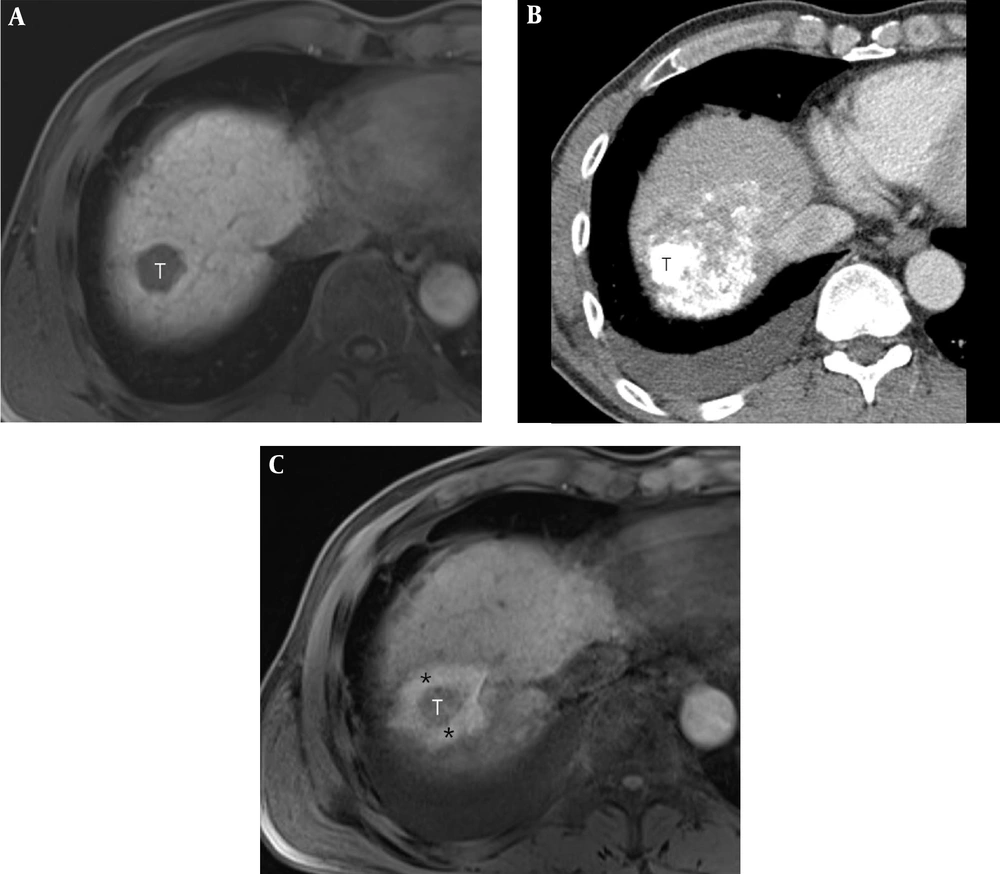
A 49-year-old man with a 2.4-cm hepatocellular carcinoma (HCC) in the right hepatic dome. A, Pre-procedural axial T1-weighted MR image shows a 2.4-cm HCC (T) in the right hepatic dome. B, Post-procedural axial CT image shows the index tumor (T) with compact lipiodol uptake in the right hepatic dome. It is difficult to visually discriminate the index tumor from the ablative margin (AM) due to amorphic and dense deposition of hyper-attenuating iodized oil around the index tumor. C, Post-procedural axial in-phase T1-weighted MR image reveals the index tumor (T) within the ablation zone, which is visible as a low signal intensity (SI)lesion. The AM (*) is visible as an area with high SI and is visually separated from the index tumor. The AM status was classified as AM-plus.
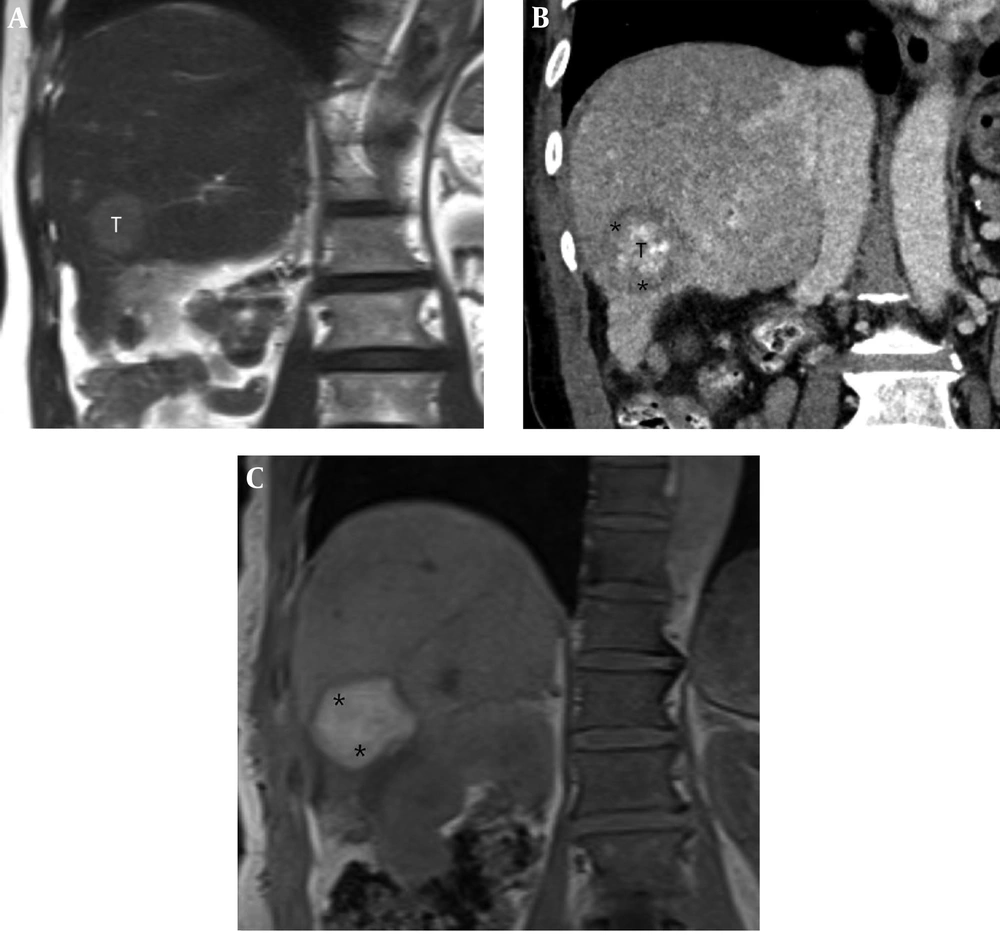
A 71-year-old man with a 2.7-cm hepatocellular carcinoma (HCC) in the inferior segment of the right hepatic lobe. A, Pre-procedural coronal T2-weighted MR image shows a 2.7-cm HCC (T) in the inferior segment of the right hepatic lobe. B, Post-procedural coronal reformatted CT image shows the index tumor (T) with defective lipiodol uptake in the right hepatic lobe, which is visually separated from the ablative margin (AM) (*) within the ablation zone. The AM status was classified as AM-plus. C, Post-procedural coronal in-phase T1-weighted MR image shows an ablation zone with high signal intensity (SI) (*). However, the index tumor is not perceptible within the ablation zone.
| Signal intensity of HCC in pre-procedural MRI | Target sign | |||||
|---|---|---|---|---|---|---|
| In-phase T1WI | Opposed-phase T1WI | T2WI | ||||
| + (n = 38) | − (n = 7) | + (n = 38) | - (n = 7) | + (n = 10) | - (n = 35) | |
| Low SI | 33 | 2 | 30 | 1 | 0 | 2 |
| Isointense | 3 | 3 | 5 | 4 | 1 | 4 |
| High SI | 2 | 2 | 3 | 2 | 9 | 29 |
Abbreviations: HCC, hepatocellular carcinoma; MRI, magnetic resonance imaging; SI, signal intensity; T1WI, T1 weighted image; T2WI, T2 weighted image
4.2. Comparison of the AM Status Between MDCT and MRI
| MRI | |||
|---|---|---|---|
| AM plus (n = 31) | AM zero (n = 9) | Indeterminatea (n = 5) | |
| MDCT | |||
| AM plus (n = 27) | 23 | 2 | 2 |
| AM zero (n = 9) | 2 | 5 | 2 |
| *Indeterminate (n = 9) | 6 | 2 | 1 |
Abbreviations: AM, ablative margin; MDCT, multiple detector computed tomography; MRI, magnetic resonance imaging
a Indeterminate refers to the cases with negative target sign.




