
1. Background
Ovarian cancer is among the deadliest gynecological malignancies and a leading cause of cancer-related mortality in women. Epithelial ovarian cancer is the most common histological subtype, whereas germ cell and stromal tumors are rare. Despite recent advances in diagnosis and therapy, the prognosis of ovarian cancer remains poor, mainly because most patients are diagnosed at an advanced stage (1). Ovarian cancer comprises several pathological and histological subtypes. Considerable efforts have been devoted to elucidating this disease, particularly the genetic alterations that contribute to its development and progression. The availability of large-scale genomic datasets, such as those provided by The Cancer Genome Atlas (TCGA) and the International Cancer Genome Consortium, has enabled a deeper investigation of ovarian cancer tumorigenesis. However, the molecular mechanisms underlying disease development remain poorly understood, highlighting the need for integrated bioinformatics analyses to identify and validate novel oncogenic biomarkers and signaling pathways (2).
Adipose tissue is an endocrine organ that produces and releases various bioactive peptides called adipocytokines or adipokines. These molecules mediate communication between adipose tissue and other organs and play important roles in inflammation and energy metabolism. Adipocyte dysfunction and reduced adipokine secretion contribute to the development of obesity-associated disorders (3). Obesity-related adipokines may regulate ovarian cancer progression by modulating crosstalk between adipose tissue and cancer cells and influencing key processes, including cell proliferation, apoptosis, angiogenesis, metastasis, immune responses, and metabolic reprogramming. Dysregulated adipokine signaling is associated with cancer progression and therapeutic resistance, highlighting these molecular networks as potential diagnostic biomarkers and therapeutic targets (4).
RNA-binding proteins (RBPs) are key post-transcriptional regulators that interact with RNA and control its stability, localization, splicing, degradation, and translation. Through these functions, RBPs regulate gene expression programs involved in diverse biological processes and diseases, particularly in cancer (5). Evidence indicates that dysregulated RBPs contribute to ovarian cancer progression by affecting proliferation, apoptosis, invasion, metastasis, epithelial-mesenchymal transition, and chemotherapy sensitivity. Therefore, RBP-mediated regulatory networks may provide valuable insights into the pathogenesis and clinical management of ovarian cancer (6).
2. Objectives
This study used a bioinformatics approach integrating transcriptomic data from TCGA and the Genotype-Tissue Expression (GTEx) project to investigate adipocytokine signaling-related genes and RBPs in ovarian cancer. We identified adipocytokine-related differentially expressed genes (AD-DEGs) and hub adipocytokine-related RBPs (hub AD-RBPs) and subsequently analyzed their regulatory networks. In addition, we assessed genomic alterations, immune infiltration, and drug sensitivity using the Gene Set Cancer Analysis (GSCA) platform to further investigate the potential biological roles and clinical relevance of these genes in ovarian cancer.
3. Methods
3.1. Data Collection and Differential Expression Analysis
The study was approved by the Ethics Committee of Hormozgan University of Medical Sciences (IR.HUMS.REC.1405.155). Ovarian cancer-associated DEGs were obtained from the GEPIA3 database (https://gepia3.bioinfoliu.com/) (7). The TCGA-OV cohort included 611 ovarian serous cystadenocarcinoma samples, whereas normal ovarian tissues were obtained from the GTEx Ovary dataset (n = 112) and TCGA-OV normal tissues (n = 12). Samples were selected according to the GEPIA3 criteria. Transcriptomic data and preprocessing provided by GEPIA3 were used for the analysis. DEGs were identified using the DESeq2 method, and genes with |log2 fold change| ≥ 3 and a Benjamini-Hochberg-adjusted P value < 0.05 were selected for subsequent analyses.
3.2. Identification of Adipocytokine Signaling Pathway-Related Candidate Genes
Adipocytokine signaling pathway-related genes were retrieved from the MSigDB database (https://www.gsea-msigdb.org/gsea/msigdb) based on Kyoto Encyclopedia of Genes and Genomes (KEGG) pathway annotations (8). The overlap between adipocytokine signaling pathway-related genes and ovarian cancer-associated DEGs was assessed, and the intersecting genes were defined as AD-DEGs for subsequent analyses.
3.3. Visualization of AD-DEG Expression Profiles
Expression data for the AD-DEGs were extracted from the “TCGA paired tumor-normal and GTEx normal expression analysis” module under “DIY” within the “Expression Analysis” section of the GEPIA3 database, using the TCGA-OV dataset (427 tumors and 88 normal samples). The extracted data were then visualized in R (version 4.6.1; https://www.R-project.org/) (9) using dplyr (version 1.2.1; https://dplyr.tidyverse.org) and ggplot2 (version 4.0.3; https://ggplot2.tidyverse.org) (10, 11) to generate the final infographic.
3.4. Construction of the AD-DEG-RBP Regulatory Network and Hub Node Analysis
To identify RBPs linked to the five AD-DEGs (AKT3, NPY, G6PC2, TNF, and IRS4), the starBase v3.0 database (https://rnasysu.com/encori/) was queried using the RBP-target and RBP-mRNA interaction modules, with the database’s default interaction and confidence criteria (12). A network of potential interactions between AD-DEGs and AD-RBPs was then constructed and visualized using Cytoscape software (version 3.4.10; https://cytoscape.org/index.html) (13). The network layout was optimized using the yFiles Layout Algorithms plugin (https://apps.cytoscape.org/apps/yfileslayoutalgorithms) with the Organic Layout algorithm to improve the graphical representation of complex interactions between AD-DEGs and AD-RBPs (14).
The protein-protein interaction (PPI) network of AD-RBPs linked to AD-DEGs was constructed using the STRING database (version 12.0; https://string-db.org/) (15), with a minimum required interaction score of 0.4. The resulting interaction network was imported into Cytoscape for visualization and network analysis. Network clustering was performed using the MCL (Markov Cluster Algorithm) plugin in Cytoscape with an inflation parameter of 2.5, and the resulting network was visualized using the Degree Sorted Circle Layout (https://apps.cytoscape.org/apps/clustermaker2) to identify densely connected functional modules within the PPI network (16). Subsequently, the cytoHubba plugin (version 0.1; https://apps.cytoscape.org/apps/cytohubba) was used to identify hub AD-RBPs based on the Degree centrality algorithm (17). The top 10 AD-RBPs with the highest Degree scores were selected as hub AD-RBPs for subsequent analyses.
3.5. GSCA Analysis of AD-DEGs and Hub AD-RBPs
GSCA (https://guolab.wchscu.cn/GSCA/#/) was used to characterize the genomic, immunological, and pharmacological features of the five AD-DEGs and 10 hub AD-RBPs identified in this study (18). For genomic analyses, copy number variation (CNV), single nucleotide variation (SNV), and CNV-mRNA expression associations were evaluated using the GSCA platform and its default processing procedures. Immune infiltration analysis was performed using the “Immune Infiltration & GSVA Score” module of the GSCA platform. Immune-cell infiltration levels for 24 immune-cell types were estimated automatically by the GSCA server using ImmuCellAI, an algorithm that estimates immune-cell abundance from predefined gene-expression signatures. GSVA scores and correlation analyses were also calculated by the GSCA server using its implemented procedures. P values were adjusted using the false discovery rate (FDR), with FDR < 0.05 considered statistically significant. For drug-sensitivity analysis, the CTRP dataset, including IC50 values for 481 small molecules across 1,001 cancer cell lines and corresponding mRNA expression data, was used. Pearson correlation analysis was performed to assess correlations between gene mRNA expression and drug IC50, and P values were adjusted using the FDR. Gene-drug pairs with an absolute correlation coefficient > 0.1 and FDR-adjusted P values < 0.05 were considered significant. The 15 investigated genes, including five AD-DEGs and 10 AD-DEG-associated hub AD-RBPs, were analyzed together to evaluate their potential associations with drug sensitivity.
The overall study workflow is presented in the Graphical Overview.
-->IMAGE<--
4. Results
4.1. Identification of Adipocytokine Signaling Pathway-Related Genes
To identify adipocytokine signaling pathway-related genes in ovarian cancer, DEGs were identified using GEPIA3 based on |log2FC| ≥ 3 and Benjamini-Hochberg-adjusted P values < 0.05, yielding 2,584 DEGs. Subsequently, 67 adipocytokine signaling pathway-related genes were retrieved from MSigDB based on the KEGG pathway, and their overlap with the DEGs was analyzed using jvenn. Five overlapping genes (AKT3, NPY, G6PC2, TNF, and IRS4) were identified as AD-DEGs (Figure 1). Their expression patterns and adjusted P values are summarized in Table 1.
Table 1.
Expression Pattern in GEPIA3 a
| Gene | log2 Fold Change | Adjusted P Value |
|---|---|---|
| TNF | 6.04 | 3.28E-179 |
| NPY | 3.47 | 5.25E-26 |
| AKT3 | -3.32 | 3.18E-98 |
| IRS4 | -4.31 | 9.87E-50 |
| G6PC2 | -3.57 | 9.46E-30 |
a Positive and negative log2 fold change values indicate upregulation and downregulation, respectively. The table presents the log2 fold change and Benjamini-Hochberg-adjusted P values for the identified differentially expressed genes (DEGs).
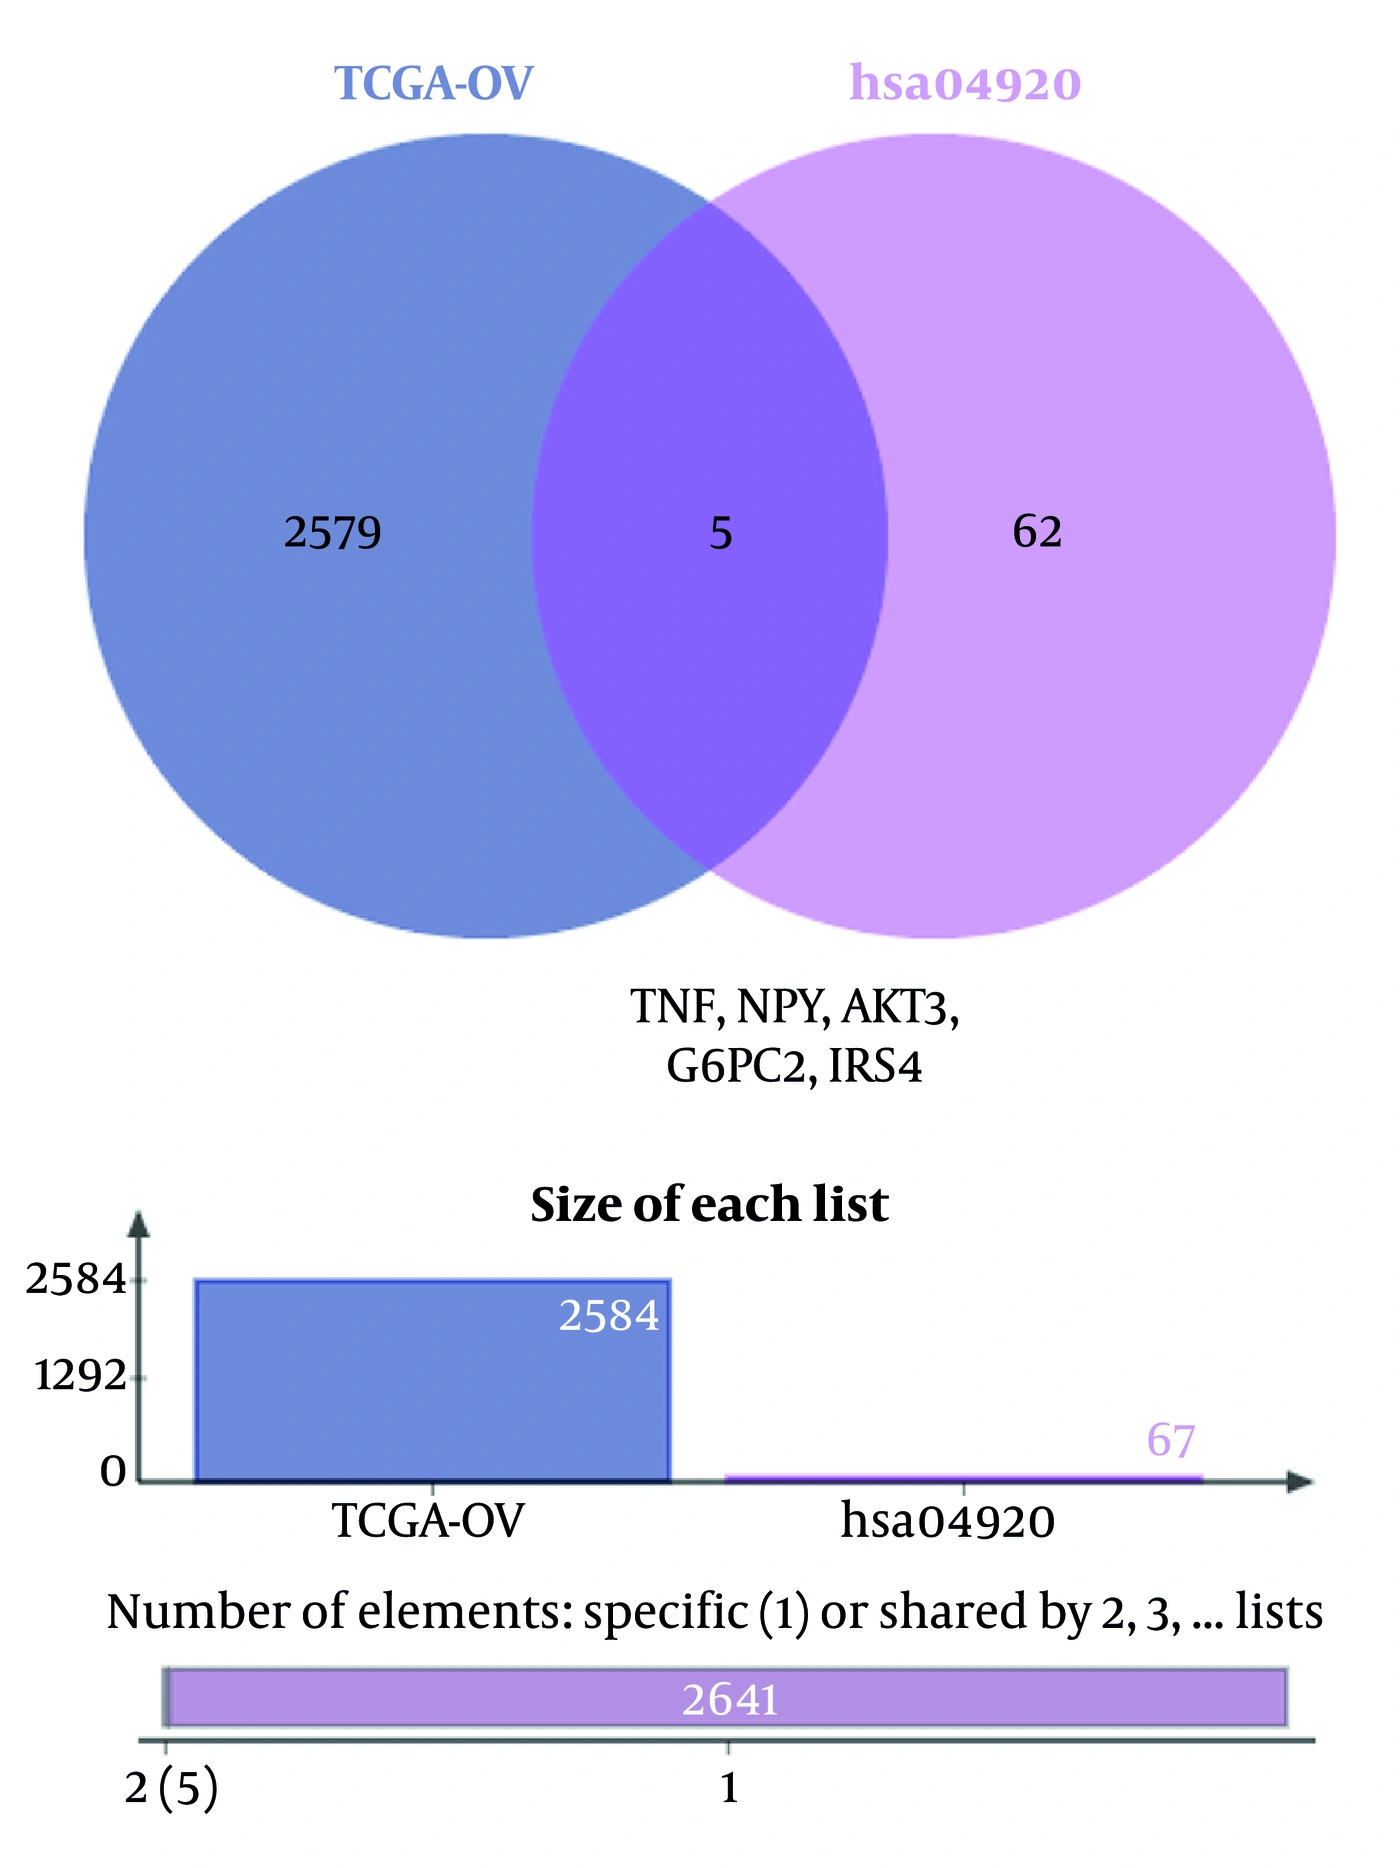
Figure 1.
The overlap between ovarian cancer DEGs and adipocytokine signaling pathway genes was determined using the jvenn online tool.
4.2. Visualization of AD-DEG Expression Profiles
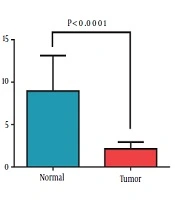
The expression levels of AKT3, NPY, G6PC2, TNF, and IRS4 differed significantly between ovarian cancer and normal ovarian tissues (adjusted P value < 0.05; Figure 2). These results indicate that the identified AD-DEGs are aberrantly expressed in ovarian cancer tissues and may contribute to the molecular mechanisms underlying ovarian cancer.
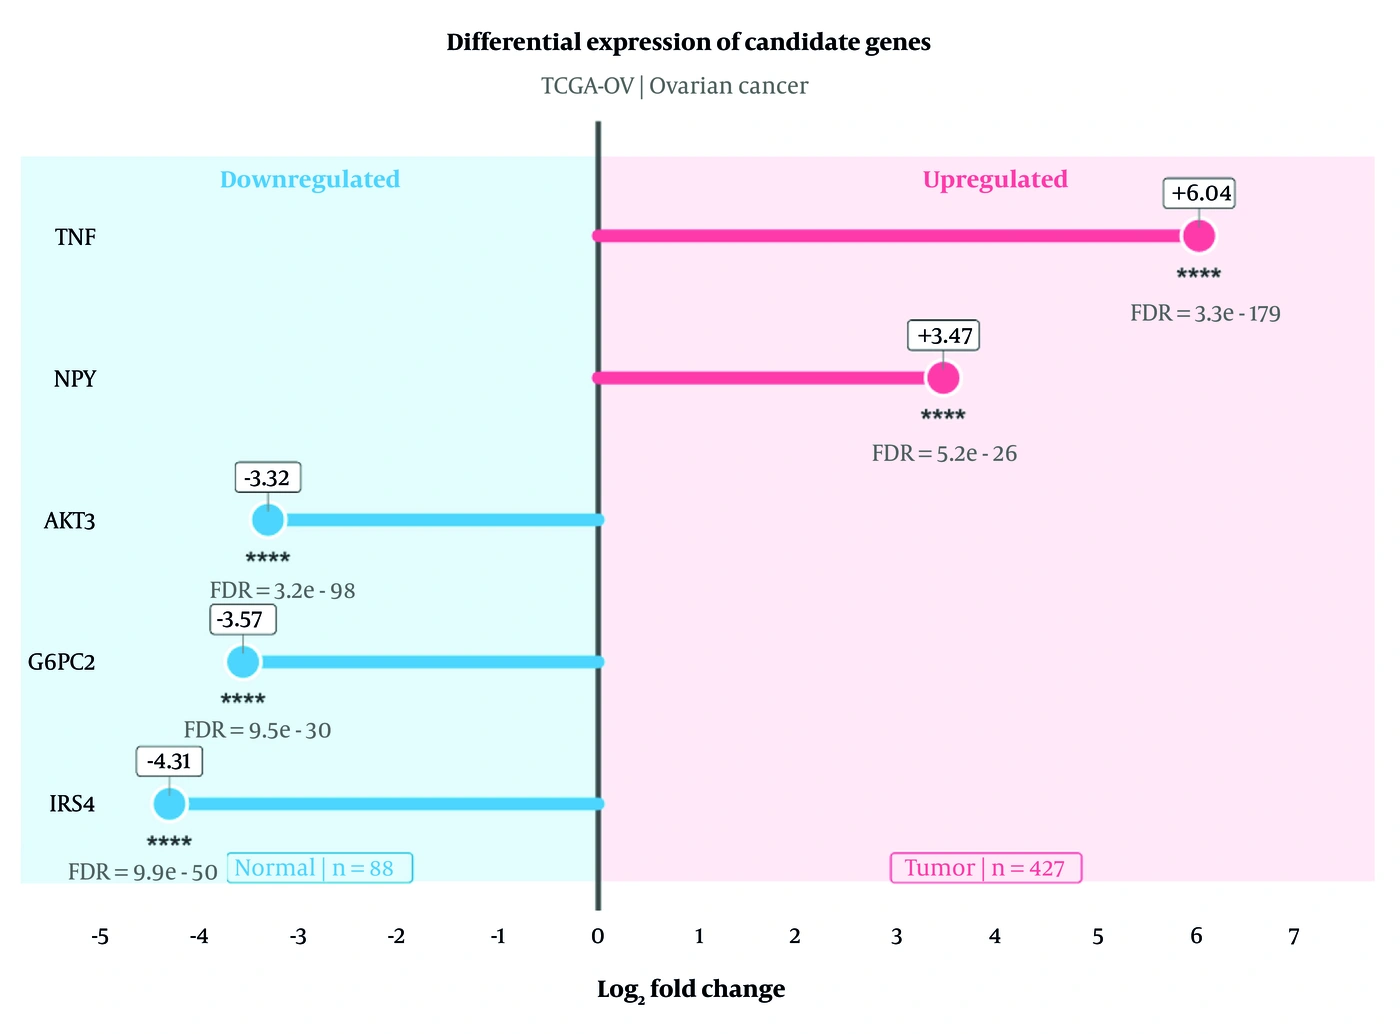
Figure 2.
Infographic showing the expression profiles of the identified AD-DEGs in ovarian serous cystadenocarcinoma and normal ovarian tissues based on data extracted from the GEPIA3 database using the TCGA-OV dataset. Differences in gene expression between ovarian serous cystadenocarcinoma and normal ovarian samples were considered statistically significant at a Benjamini-Hochberg-adjusted P value (FDR).
4.3. Construction of the AD-DEG-RBP Regulatory Network and Identification of Hub AD-RBPs
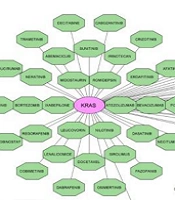
The AD-DEG-RBP regulatory network was constructed using starBase v3.0 and visualized in Cytoscape; it comprised 130 nodes and 204 edges (Figure 3A). Subsequently, the AD-RBP PPI network was constructed using STRING, containing 127 nodes and 1,799 edges, with significant PPI enrichment (P < 1 × 10-16). MCL analysis identified functional modules, and cytoHubba was used to identify hub AD-RBPs based on degree centrality (Figure 3B). The top 10 hub AD-RBPs were ELAVL1, HNRNPC, HNRNPA2B1, HNRNPA1, RBMX, TARDBP, HNRNPM, PTBP1, SRSF1, and FUS; these genes were selected for subsequent analyses (Figure 3C and Table 2).
Table 2.
Top 10 in STRING Network Interactions a
| Rank | Name | Score |
|---|---|---|
| 1 | ELAVL1 | 83 |
| 2 | HNRNPC | 81 |
| 3 | HNRNPA2B1 | 73 |
| 4 | HNRNPA1 | 72 |
| 5 | RBMX | 64 |
| 6 | TARDBP | 63 |
| 7 | HNRNPM | 62 |
| 8 | PTBP1 | 61 |
| 9 | SRSF1 | 60 |
| 10 | FUS | 57 |
a Degree score indicates the number of direct network interactions for each RBP. Higher scores indicate greater network connectivity.
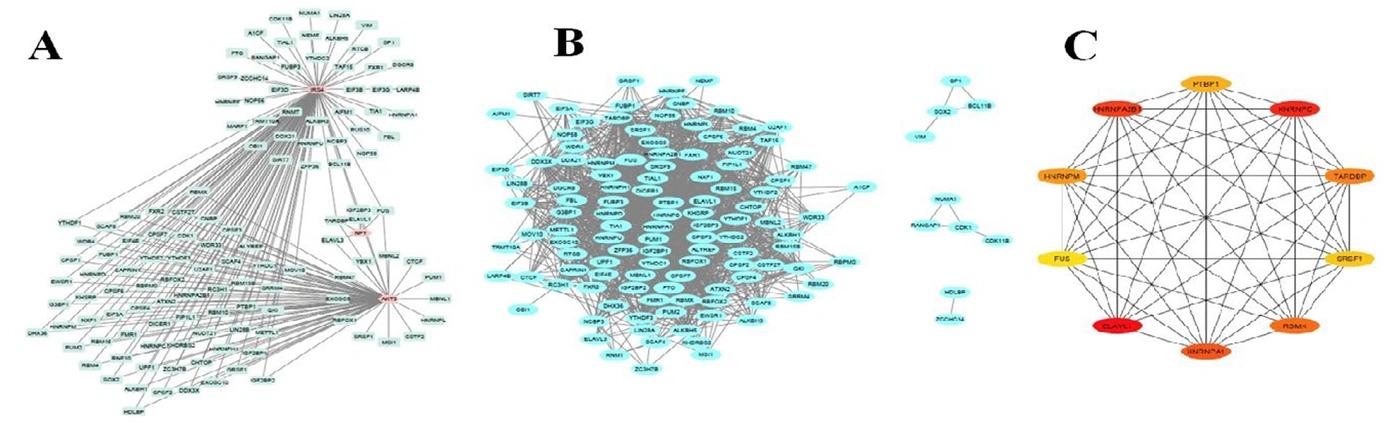
Figure 3.
Construction of the AD-DEG-RBP regulatory network and identification of hub AD-RBPs. (A) AD-DEG-RBP regulatory network constructed using the starBase v3.0 database and visualized in Cytoscape. (B) Protein-protein interaction (PPI) network of AD-RBPs generated using the STRING database and clustered into functional modules using the Markov Cluster Algorithm (MCL). (C) Top 10 hub AD-RBPs identified by the cytoHubba plugin based on the Degree centrality algorithm.
4.4. Genomic and Pharmacological Analysis of Hub AD-RBPs and AD-DEGs
4.4.1. Mutation Analysis
CNV analysis revealed the distribution of CNV alterations among the investigated AD-DEGs and hub AD-RBPs across the selected cancer types (Figure 4A). Among 412 analyzed samples, IRS4 showed the highest mutation frequency (8/412, 1.94%), followed by FUS, PTBP1, RBMX, and TARDBP (4/412, 0.97% each). ELAVL1, HNRNPA1, HNRNPM, G6PC2, and TNF showed lower mutation frequencies (0.24 - 0.49%), whereas no mutations were detected in AKT3, NPY, or HNRNPA2B1. In the oncoplot, IRS4 accounted for 24% of the 33 SNV events observed across the investigated gene set (Figure 4B).
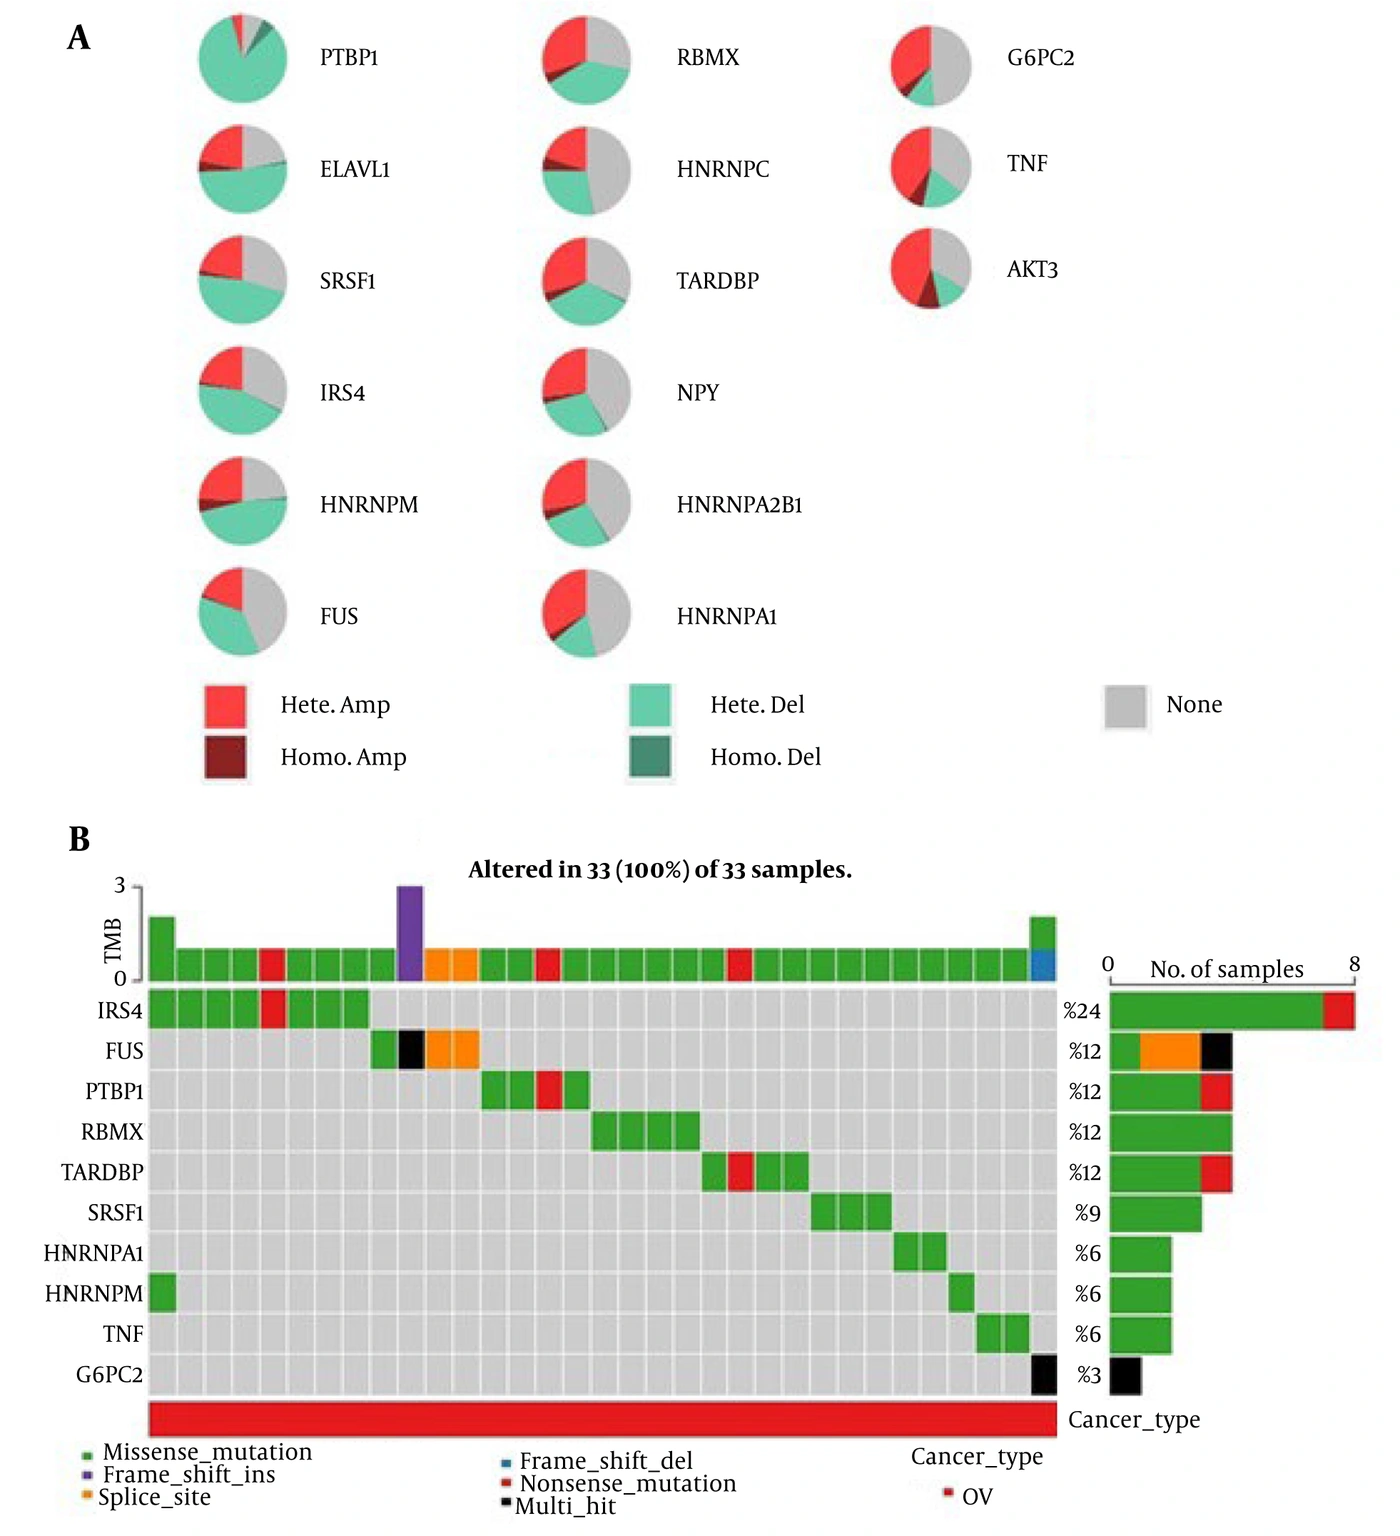
Figure 4.
Genomic alteration landscape of AD-RBPs and AD-DEGs in ovarian cancer. (A) Distribution of copy number variations (CNVs), including heterozygous and homozygous amplifications and deletions, across the analyzed AD-RBPs and AD-DEGs. (B) Oncoplot showing the distribution and frequency of somatic single nucleotide variants (SNVs) in the selected AD-RBPs and AD-DEGs.
4.4.2. CNV-Expression Association Analysis
CNV-expression analysis revealed significant associations for several hub AD-RBPs, with ELAVL1 showing the strongest association (spm = 0.739, FDR = 2.14 × 10-50), followed by HNRNPA2B1 (spm = 0.505, FDR = 6.61 × 10⁻²⁰), HNRNPC (spm = 0.477, FDR = 1.39 × 10⁻¹⁷), TARDBP (spm = 0.471, FDR = 3.91 × 10⁻¹⁷), and PTBP1 (spm = 0.439, FDR = 8.67 × 10⁻¹⁵). Significant associations were also observed for HNRNPM, FUS, SRSF1, and HNRNPA1 (FDR < 0.05). In contrast, AKT3, G6PC2, and RBMX showed no significant CNV-expression associations, and no significant associations were detected for the remaining AD-DEGs. Overall, CNV appeared to contribute more strongly to the regulation of expression for several hub AD-RBPs than for AD-DEGs, particularly ELAVL1, HNRNPA2B1, HNRNPC, TARDBP, and PTBP1 (Figure 5).
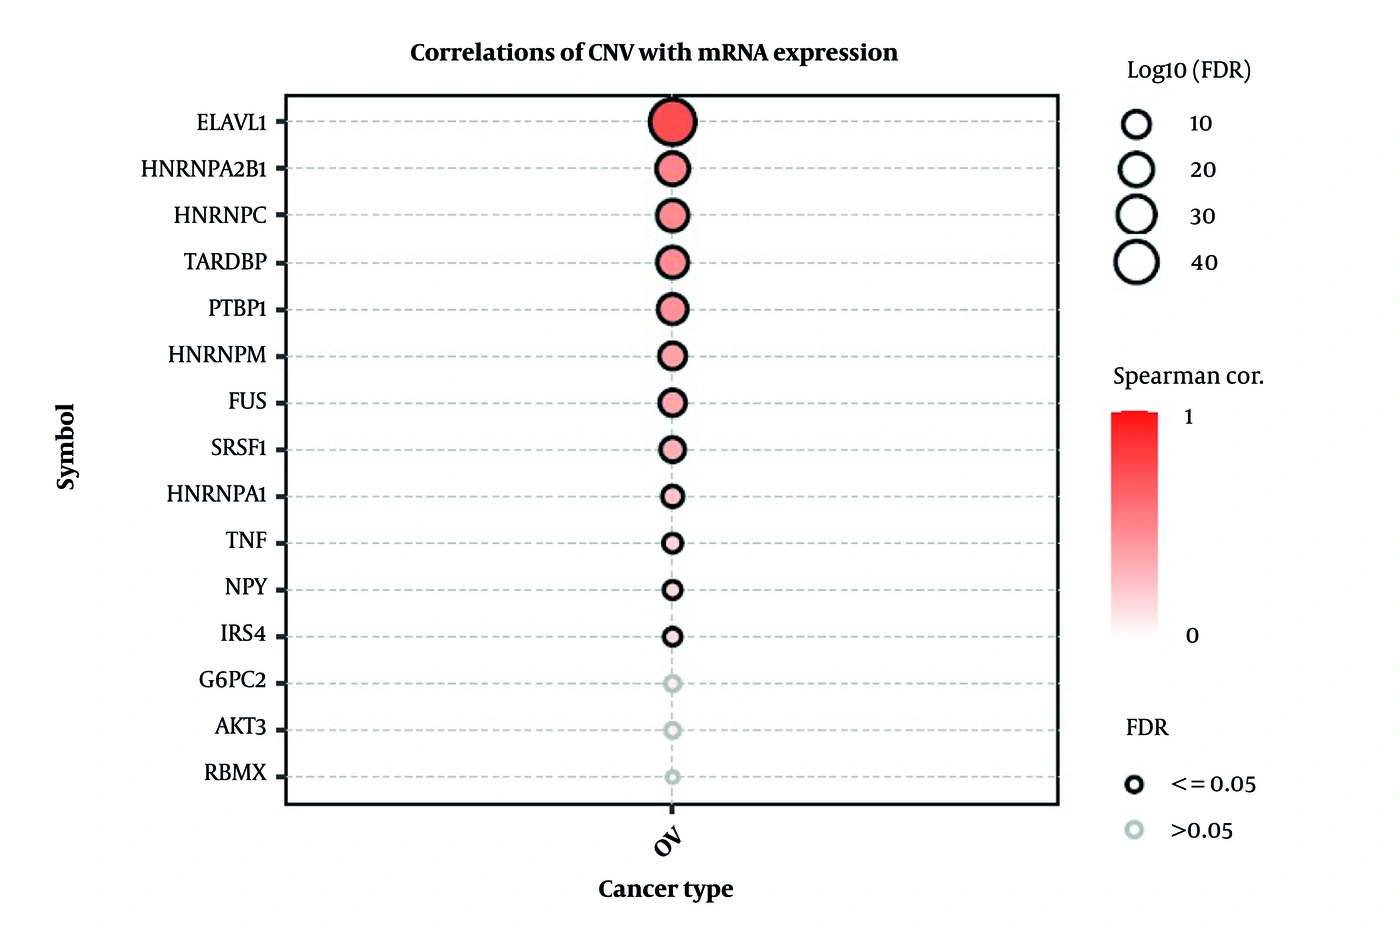
Figure 5.
Correlation between copy number variation (CNV) and mRNA expression of hub AD-RBPs and AD-DEGs in ovarian cancer. The bubble plot illustrates the Spearman correlation coefficients between CNV and mRNA expression levels. Bubble color represents the strength of the correlation, bubble size corresponds to -log10(FDR), and black circles indicate statistically significant correlations (FDR ≤ 0.05). ELAVL1 showed the strongest positive CNV-expression association, followed by HNRNPA2B1, HNRNPC, TARDBP, and PTBP1, whereas most AD-DEGs exhibited weak or nonsignificant associations.
4.4.3. Immune Infiltration Analysis
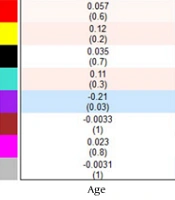
To investigate the relationship between AD-DEGs and the tumor immune microenvironment, immune infiltration analysis was conducted using the GSCA platform. Spearman correlation analysis showed that AD-DEG expression was significantly negatively correlated with B-cell infiltration (ρ = −0.222, P = 6.91 × 10⁻⁵, FDR = 0.00173). Although positive and negative correlations were observed with Th2 cells (ρ = 0.141, P = 0.0117) and Th17 cells (ρ = −0.148, P = 0.0081), respectively, these associations were not statistically significant after FDR correction. No significant correlations were detected between AD-DEG expression and other immune cell populations, including CD4+ T cells, CD8+ T cells, NK cells, macrophages, monocytes, neutrophils, regulatory T cells (Tregs), or other immune subsets. Similarly, the overall immune infiltration score was not significantly associated with AD-DEG expression (ρ = 0.012, P = 0.826). These findings indicate that AD-DEGs show limited associations with immune cell infiltration in ovarian cancer, with B-cell infiltration being the only immune parameter that remained significant after multiple-testing correction (Figure 6).
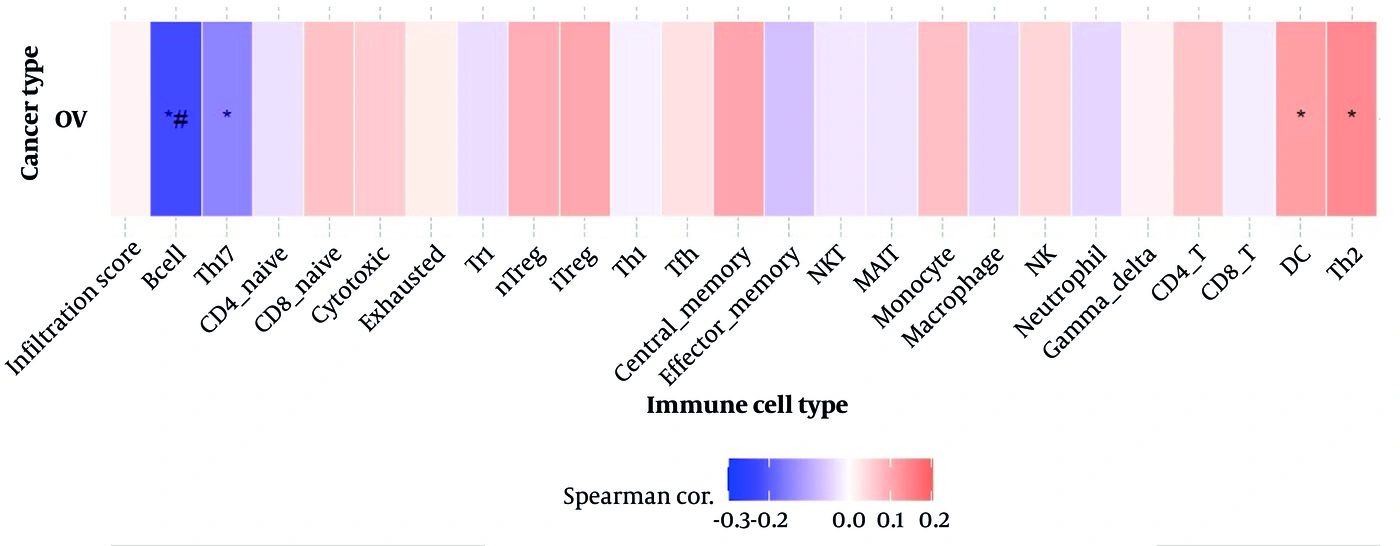
Figure 6.
Spearman correlation between AD-DEG/hub AD-RBP expression and immune cell infiltration in ovarian cancer. Color indicates correlation strength and direction. An asterisk (*) indicates a statistically significant association based on the P value, whereas *# indicates statistical significance based on the adjusted P value (FDR < 0.05). B-cell infiltration showed the only significant negative correlation with AD-DEG and hub AD-RBP expression after FDR correction.
4.4.4. Drug Sensitivity Analysis
Drug sensitivity analysis revealed significant associations between the expression of AD-DEGs and hub AD-RBPs and responses to multiple anticancer compounds (FDR < 0.05). Among the hub AD-RBPs, ELAVL1 showed the greatest number of significant drug associations (n = 325), followed by HNRNPC (n = 321), HNRNPA1 (n = 314), RBMX (n = 306), HNRNPM (n = 302), PTBP1 (n = 284), TARDBP (n = 264), HNRNPA2B1 (n = 234), and FUS (n = 103). Among the AD-DEGs, TNF (n = 212), NPY (n = 189), AKT3 (n = 101), G6PC2 (n = 52), and IRS4 (n = 18) showed significant drug-response associations, whereas SRSF1 did not. Several hub AD-RBPs showed strong negative correlations with responses to specific drugs. ELAVL1 was negatively correlated with necrosulfonamide sensitivity (cor = −0.535, FDR = 8.40 × 10-37), whereas HNRNPC showed a negative correlation with GSK461364 response (cor = −0.446, FDR = 2.27 × 10-36). HNRNPA1 (cor = −0.526, FDR = 1.28 × 10⁻⁴), HNRNPM (cor = −0.503, FDR = 2.68 × 10⁻⁴), RBMX (cor = −0.530, FDR = 1.12 × 10⁻⁴), TARDBP (cor = −0.484, FDR = 4.75 × 10⁻⁴), PTBP1 (cor = −0.401, FDR = 0.0048), and HNRNPA2B1 (cor = −0.343, FDR = 0.0185) were negatively correlated with GSK-J4 sensitivity. Among the AD-DEGs, IRS4 was negatively correlated with RO4929097 response (cor = −0.172, FDR = 0.0175), whereas TNF showed a negative correlation with isoliquiritigenin response (cor = −0.265, FDR = 0.0011) (Figure 7). Overall, drug sensitivity analysis indicated that both hub AD-RBPs and AD-DEGs were significantly associated with responses to multiple anticancer compounds, suggesting their potential relevance to therapeutic response in ovarian cancer.
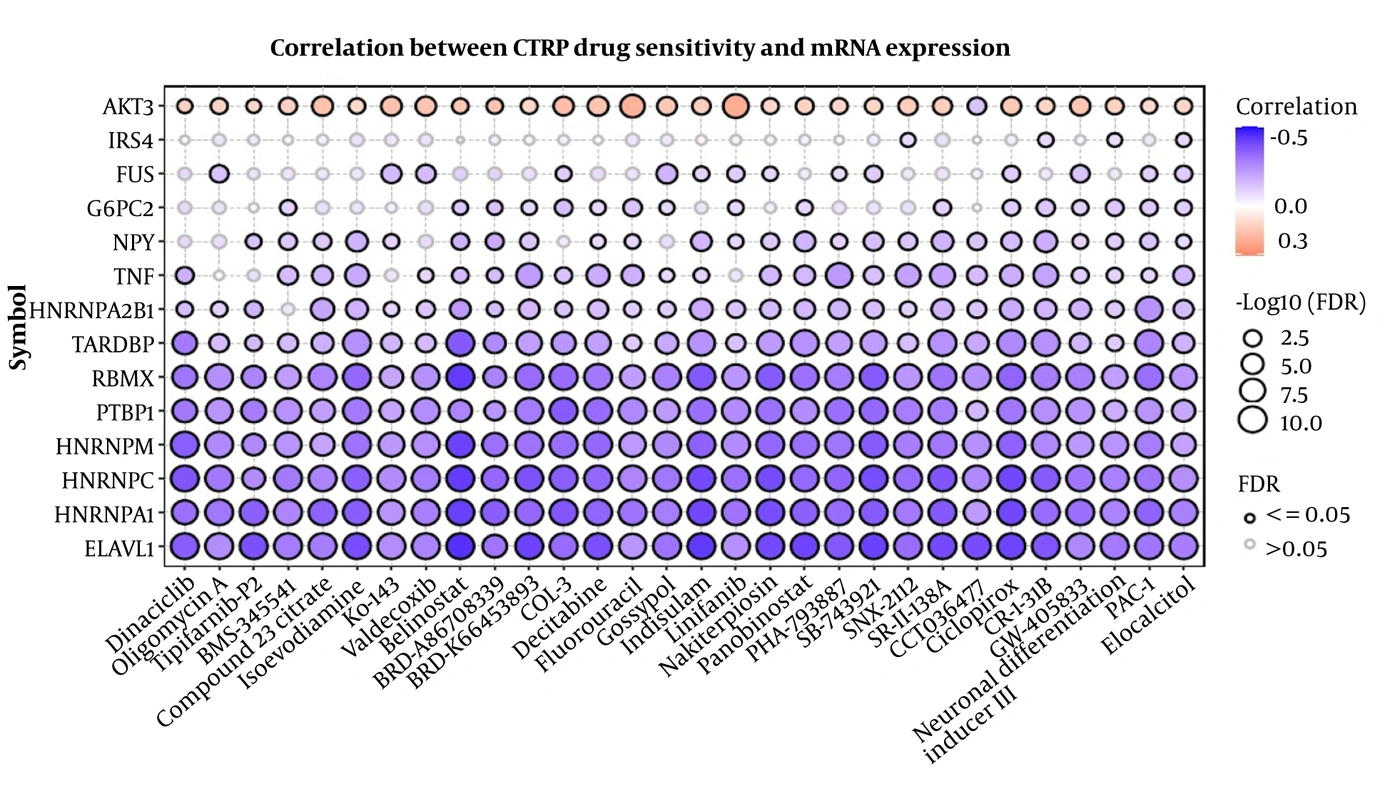
Figure 7.
Drug sensitivity analysis of hub AD-RBPs and AD-DEGs in ovarian cancer based on the CTRP dataset. Significant gene-drug associations were identified using FDR < 0.05. Correlation coefficients indicate the direction and strength of the association between gene expression and drug response, with negative values indicating inverse associations. The analysis identified multiple significant gene-drug associations among hub AD-RBPs and AD-DEGs.
5. Discussion
In this study, we integrated multiple bioinformatics approaches to investigate adipocytokine signaling pathway-related genes and their associated RBPs in ovarian cancer. We evaluated differential gene expression, pathway enrichment, regulatory networks, genomic alterations, and pharmacological characteristics. Five adipocytokine signaling pathway-related genes (AKT3, NPY, G6PC2, TNF, and IRS4) and 10 hub AD-RBPs (ELAVL1, HNRNPC, HNRNPA2B1, HNRNPA1, RBMX, TARDBP, HNRNPM, PTBP1, SRSF1, and FUS) were identified. These findings suggest a potential link between adipocytokine signaling and post-transcriptional regulation in ovarian cancer and highlight these molecules as potential biomarkers and therapeutic targets.
Adipocytokine signaling plays an important role in tumor metabolism, inflammation, and cancer progression. Dysregulation of this pathway can affect key oncogenic pathways, including PI3K/AKT and insulin signaling, as well as inflammatory responses (19). Among the identified AD-DEGs, AKT3 is a well-established component of the PI3K/AKT pathway, which plays a central role in ovarian cancer cell proliferation, survival, and chemotherapy resistance (20). Similarly, TNF is a major inflammatory cytokine that contributes to chronic inflammation and promotes tumor progression through activation of NF-κB signaling (21). IRS4, another identified candidate, has been reported to activate PI3K/AKT signaling and promote tumorigenesis in ovarian cancer, suggesting that its dysregulation may contribute to ovarian cancer progression (22). Among the identified AD-DEGs, G6PC2 may also be relevant to ovarian cancer. Recent evidence suggests that HKDC1 promotes tumor progression, lipid metabolism, and immune escape by stabilizing G6PC/G6PC2. However, this evidence does not establish a direct role for G6PC2 in ovarian cancer, and its specific role requires further experimental and clinical validation (23). Previous studies have demonstrated the expression of NPY receptors in ovarian cancer, indicating a potential role for NPY signaling in tumor cell proliferation and angiogenesis. In line with these observations, the differential expression of NPY identified in our study suggests a potential association between NPY signaling and ovarian cancer progression (24); however, the present computational findings do not establish a causal role for NPY dysregulation.
A major strength of the present study is the integration of AD-RBP regulatory networks. RBPs have emerged as key post-transcriptional regulators that govern multiple aspects of RNA metabolism, including mRNA stability, alternative splicing, RNA localization, and translation. Several hub AD-RBPs identified in our study, including ELAVL1, HNRNPC, HNRNPA1, PTBP1, and TARDBP, have previously been implicated in regulating cancer-related transcripts involved in cell proliferation, apoptosis, metastasis, and therapeutic resistance. Among the identified hub AD-RBPs, ELAVL1 emerged as the most highly connected node in our regulatory network. As the best-characterized member of the ELAV family of RNA-binding proteins, ELAVL1 has been reported in several malignancies, including ovarian cancer. In addition, ELAVL1 is known to stabilize mRNAs encoding inflammatory cytokines, growth factors, and oncogenic proteins, thereby promoting tumor cell proliferation, survival, and disease progression. Consistent with these observations, the central position of ELAVL1 in our network suggests that RBP-mediated post-transcriptional regulation may represent an important molecular mechanism linking adipocytokine signaling to ovarian cancer progression (25, 26).
CNV-expression analysis revealed significant positive associations for several hub AD-RBPs, particularly ELAVL1, HNRNPA2B1, HNRNPC, TARDBP, and PTBP1. Among AD-DEGs, only TNF and IRS4 showed significant associations, whereas AKT3, NPY, and G6PC2 showed no significant associations. These findings suggest that CNV may contribute to the dysregulation of selected AD-RBPs and AD-DEGs in ovarian cancer. However, these associations do not establish causality and may reflect additional regulatory mechanisms.
Immune infiltration analysis showed limited associations between AD-DEGs and hub AD-RBPs and the tumor immune microenvironment, with only B-cell infiltration remaining significant after correction. This finding represents an association identified in the present computational analysis and does not establish a functional interaction between adipocytokine-related genes and B cells. Further studies using single-cell RNA sequencing and spatial transcriptomics are needed to clarify these interactions.
An important finding of this study was the extensive association between hub AD-RBPs and drug sensitivity. ELAVL1, HNRNPC, HNRNPA1, RBMX, HNRNPM, PTBP1, and TARDBP demonstrated significant correlations with responses to numerous anticancer compounds, indicating their potential relevance to therapeutic response. Previous experimental studies have demonstrated that targeting ELAVL1 or PTBP1 can increase the sensitivity of cancer cells to chemotherapy in several malignancies, supporting the biological relevance of the hub AD-RBPs identified in our bioinformatics analysis (27, 28). Furthermore, several AD-DEGs showed significant drug-response associations, suggesting their potential relevance to treatment outcomes. These findings support further investigation of adipocytokine signaling and RBPs as potential therapeutic targets.
5.1. Study Limitations
This study has several limitations. First, the analyses were based on publicly available transcriptomic datasets without an independent cohort for external validation. Second, the regulatory interactions identified by bioinformatics and network analyses require experimental validation. Although several identified molecules, including AKT3, IRS4, NPY, and ELAVL1, have been implicated in cancer, the role of G6PC2 in ovarian cancer remains unclear. Finally, the proposed links among adipocytokine signaling, hub AD-RBPs, and ovarian cancer progression are computationally inferred and should be validated through further in vitro and in vivo studies.
5.2. Conclusions
This study integrated transcriptomic, pathway, regulatory network, genomic, immune, and pharmacological analyses to characterize AD-DEGs and AD-RBPs in ovarian cancer. We identified several key genes and hub AD-RBPs that may contribute to ovarian cancer progression and represent potential biomarkers and therapeutic targets. These findings suggest that the interplay between adipocytokine signaling and post-transcriptional regulation may contribute to ovarian cancer pathogenesis. Further experimental and clinical studies are needed to validate these findings and clarify their biological and therapeutic significance.