
1. Background
Nutritional assessment is defined as the process of "obtaining, verifying, and interpreting the data needed to identify nutrition-related problems, their causes, and significance” (1). It involves identifying any inappropriate dietary pattern that may impair health, including both over- and under-nutrition. A comprehensive nutritional assessment is crucial in pediatric clinics because a timely intervention can prevent diet-related developmental problems (2). Identifying children in need of further nutritional assessments or interventions is therefore essential (3).
Toddlers, in particular, are vulnerable to dietary risk as they begin to establish their independence in food choices and, for some, demonstrate fussy eating behaviors (4, 5). Additionally, unhealthy dietary habits may persist over time (6) and influence short-term and long-term well-being (5, 7). Consequently, early identification of nutritional risk is very important among toddlers and children.
Data from several countries highlight a worrying nutritional trend worldwide, indicating an increasing number of toddlers regularly consume more energy-dense and nutrient-poor foodstuffs than fruits and vegetables (8, 9). Toddlers’ dietary patterns are not consistent with international dietary guidelines, which may place them at risk of nutritional deficiencies and ensuing morbidities later in life.
Limited data are available on the dietary habits of children and other population groups in Jordan. A recent study reported that beverages with added sugar contributed substantially to the daily energy intake of college students in Jordan (10). Caffeine, one of the major additives to sugar-sweetened beverages (SSB), raises additional issues as it not only increases SSB consumption (11) but also exerts a diuretic effect and may lead to urinary incontinence and nocturnal enuresis in children (12). According to a collaborative project between the Jordanian Ministry of Health and the World Health Organization (WHO) in 2010, the prevalence of stunting among preschool children and toddlers was heading toward an alarming proportion of 25% (13). The 2017 - 2018 Jordan population and family health program was implemented by the Department of Statistics and showed that one-third of Jordanian children were anemic. Given the lack of comprehensive dietary assessments and screening of toddlers’ dietary intake and its compliance with current nutritional standards in Jordan, a valid nutritional assessment tool is required in the country.
2. Objectives
The present study, a nationwide, multicentre, observational validation project, aimed primarily at assessing the validity of the NutricheQ tool in reflecting nutritional risk in 12- to 36-month-old toddlers in Jordan. This would allow the identification of known evidence-based risk factors for dietary deficiencies or excess among pre-schoolers as a major health concern of parents and pediatricians.
3. Methods
3.1. Study Design and Participants
3.1.1. Study Design
This was a national, multicenter, observational, cross-sectional validation study. The data of 238 healthy toddlers were collected by investigators in 13 selected centers across Jordan (Amman, Irbid, Zarqa, and Madaba cities).
3.1.2. Participants
Healthy toddlers aged between 12 and 36 months were identified and consecutively included in the study when they attended their routine clinical visits at the centers noted. Enrolment was continued until 238 toddlers were included. Eligible toddlers’ parents/legal guardians provided written informed consent prior to entering the study. Eligibility criteria for toddlers were being healthy and not taking any medication or specific treatment. Toddlers under pharmacological treatments, those receiving any medication (including antibiotics) in the past two weeks prior to the study initiation, those taking iron supplements, toddlers with premature birth (before 37 completed weeks of gestation), and those whose parents/legal guardians were unable to complete the toddler’s daily food intake diary form (FIDF) were excluded.
3.2. Data Collection
Data were collected from two different sources. After the parents or legal guardians signed a written informed consent form approved by the institutional review boards (IRB) of the ACDIMA and King Abdullah University Hospital (KAUH), they were asked to complete the FIDF regarding the routine diet of the toddler over three days (two weekdays and one weekend day) and return the form to the center. The NutricheQ questionnaire was also completed by a physician during a single outpatient visit as part of the case report form (CRF).
3.3. Primary and Secondary Outcomes
The primary objective of the study was to assess the local validity of the NutricheQ tool in reflecting nutritional risk among 12- to 36-month-old toddlers in Jordan. The main outcome of the study was to match nutritional intake to the nutritional risk score in order to evaluate the validity of the NutricheQ tool. Secondary objectives included the characterization of the demographics, socioeconomic profile, anthropometric profile, medical history, and the adequacy of nutrient intake among toddlers in Jordan and comparing them to the standard dietary intake recommended. We also investigated the correlation between NutricheQ scores (risk groups) and toddlers’ demographic and socioeconomic characteristics.
3.4. Statistical Methods
A sample size of 200 was considered to provide sufficient precision to estimate the primary outcome. Descriptive statistics were used according to the type of the variable. Baseline characteristics and outcomes were described by mean and standard deviation for continuous variables and by frequency and percentage for categorical variables. The association between nutrient intake and three nutritional risk groups was examined using a one-way analysis of variance (ANOVA). Pearson or Spearman correlation coefficient, depending on the result of the Shapiro-Wilk normality test, was used to examine the associations between the total risk score and other numeric variables, and the chi-square test or the Fisher’s exact test was used to test hypotheses involving qualitative variables. Sensitivity analysis was performed to correlate nutrient intake with demographic and socioeconomic characteristics. All analyses were performed using statistical analysis software (SAS) version 9.4, and a two-tailed P value of < 0.05 was considered statistically significant.
4. Results
4.1. Description of Subjects
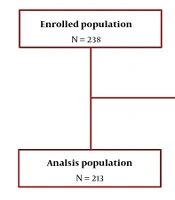
A total of 238 toddlers were enrolled by 13 investigators in 13 centers over a period of 12.6 months between 25 June 2021 and 14 July 2022. Of these, 19 toddlers did not meet the eligibility criteria, and there were six cases of protocol deviation; therefore, 213 toddlers were included for analysis (Figure 1).
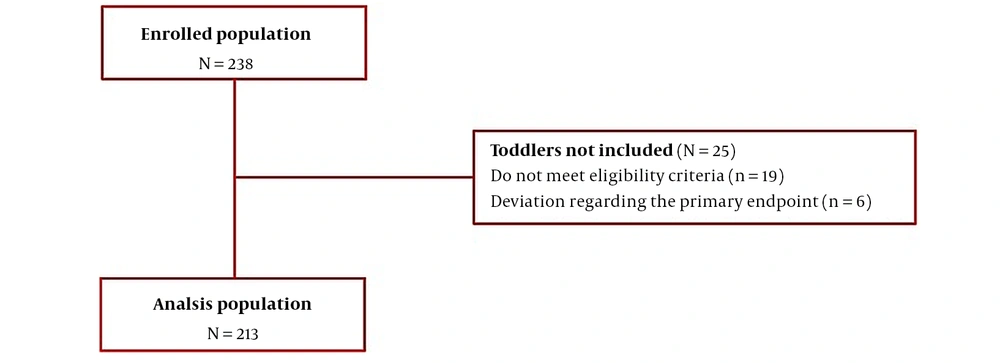
Figure 1.
Toddlers’ disposition
4.2. NutricheQ Scores
The total risk score was 7.2 ± 2.6 (95% confidential interval (CI): 6.9 - 7.6). Out of 213 toddlers, most were at moderate nutritional risk [145 (68.1%), 95% CI: 61.5 - 74.0], with a total risk score ranging between 5 and 9. Also, 31 toddlers [(14.6%), 95% CI: 10.4 - 20.0] were at low nutritional risk with a score ranging between 0 and 4, and 37 [(17.4%), 95% CI: 12.8 - 23.1] were at an increased nutritional risk with a total risk score of 10 or higher. The NutricheQ questionnaire showed a relatively low internal reliability with a Cronbach’s alfa score of 0.308.
4.3. Validity of the NutricheQ Questionnaire
Table 1 correlates NutricheQ risk scores and nutrient intake according to the DEF. Only the nutrients of particular interest, i.e., vitamin A, vitamin D, dietary fibers, iron, proteins, and iodine, were described in this manuscript. The average nutritional intake was also compared to the daily intake recommended; i.e., 300 μg retinol activity equivalents (RAE) for vitamin A, 5 - 10 μg for vitamin D, 16 - 19 g for dietary fibers, 7 mg for iron, 13 g for protein, and 90 μg for iodine (16). The average nutritional intake of toddlers did not meet the recommended daily intake of the aforementioned nutrients across all categories.
Table 1.
Comparison Between NutricheQ Scores and Average Intake of Nutrients a
| Low Risk n = 31 | 95% CI | Moderate Risk n = 145 | 95% CI | Increased Risk n = 37 | 95% CI | All N = 213 | 95% CI | |
|---|---|---|---|---|---|---|---|---|
| Vit A (μg RAE) | 251.2 ± 146.5 | 197.4 - 304.9 | 224.3 ± 190.8 | 193.0 - 255.6 | 204.5 ± 123.1 | 163.4 - 245.5 | 224.8 ± 174.7 | 201.2 - 248.4 |
| Vit D (μg) | 6.3 ± 11.0 | 2.3 - 10.4 | 6.5 ± 10.2 | 4.9 - 8.2 | 5.0 ± 4.1 | 3.6 - 6.3 | 6.2 ± 9.5 | 4.9 - 7.5 |
| Iron (mg) | 10.5 ± 4.4 | 8.8 - 12.1 | 9.3 ± 3.2 | 8.8 - 9.9 | 9.5 ± 3.8 | 8.2 - 10.8 | 9.5 ± 3.5 | 9.0 - 10.0 |
| Protein (g) | 42.4 ± 10.9 | 38.4 - 46.4 | 38.2 ± 12.6 | 36.1 - 40.2 | 38.8 ± 11.9 | 34.8 - 42.7 | 38.9 ± 12.3 | 37.2 - 40.5 |
| Dietary fibre b (g) | 9.4 ± 4 .0 | 7.9 - 10.9 | 7.6 ± 3.5 | 7.0 - 8.1 | 7.2 ± 3.2 | 6.1 - 8.3 | 7.8 ± 3.6 | 7.3 - 8.2 |
| Calories (kcal) | 1134.3 ± 295.9 | 1025.7 - 1242.8 | 1075.6 ± 558.2 | 984.0 - 1167.3 | 1098.6 ± 309.2 | 995.6 - 1201.7 | 1088.2 ± 490.6 | 1021.9 - 1154.4 |
| Iodine b (μg) | 80.4 ± 45.5 | 63.7 - 97.1 | 63.3 ± 33.0 | 57.9 - 68.7 | 65.1 ± 31.4 | 54.7 - 75.6 | 66.1 ± 35.1 | 61.4 - 70.9 |
Abbreviations: CI, confidential interval; RAE, retinol activity equivalents; SD, standard deviation; Vit, vitamin.
a Values are expressed as mean ± SD unless otherwise indicated.
b P < 0.05.
4.4. Nutrient Intake Defaults
All toddlers showed a default in vitamin A (P = 0.548) and vitamin D (P = 0.684) intake, which was similar across all categories. In particular, toddlers with low nutritional risk were taking 9.4 ± 4.0 g of vitamin A per day, which was significantly higher than that of toddlers with either moderate (7.6 ± 3.5 g) or increased- (7.2 ± 3.2 g) risk (P = 0.021). None of the Jordanian toddlers met the average of the required daily intake of iodine (i.e., 90 μg). Toddlers in the low nutritional risk category had the highest daily intake of iodine (80.0 ± 45.5 μg, median of 68.4 μg) compared to peers in moderate (63.3 ± 33.0 μg, median of 59.2 μg) and increased (65.1 ± 31.4 μg, median of 61.1 μg) nutritional risk categories (P = 0.047).
4.5. Nutrient Intake Excess
Toddlers in all categories exceeded daily iron and protein intake, taking at least 9 mg of iron (P = 0.270) and 38 g of protein (P = 0.224) per day despite the required calorie intake of around 1000 kcal per day.
4.6. Analysis of Secondary Endpoints
4.6.1. Demographic and Other Baseline Characteristics
Most toddlers in this study were male (n = 119, 55.9%) and below 24 months old (n = 121, 56.8%). The average age of the toddlers was 22.9 ± 7.1 months; on average, they had one sibling, and most of them were taken care of by their parents (n = 205, 97.2%). At least one of the parents or legal guardians was employed, and houses comprised four rooms on average (3.9 ± 1.2). The majority of the parents held a postgraduate degree (61.9% of fathers and 54.0% of mothers). The household’s income ranged from 257 to 963 Jordanian Dinars (JOD) ($362 - 1320) in 49% of the cases and from 937 to 1823 JOD ($1320 - 2571) in 33% of the households.
Table 2 displays toddlers’ anthropometric data both at birth and at the time of enrolment. The categories of body mass index (BMI) were defined according to WHO guidelines (17). According to BMI Z-scores at the time of entering the study, 17 (8.3%) toddlers were underweight; 119 (58.1%) had a healthy weight; 34 (16.6%) were overweight, and 35 (17.1%) were obese.
Table 2.
Anthropometric Data of Toddlers Studied at Birth and the Time of Enrolment in the Study a
| Analyzed Population N = 212 | ||
|---|---|---|
| At Birth | At Study Visit | |
| Height (cm) | 50.2 ± 2.9 | 84.1 ± 8.0 |
| Weight (kg) | 3.1 ± 0.5 | 12.1 ± 2.2 |
| BMI (kg/m2) | 12.4 ± 1.7 | 17.2 ± 3.1 |
| BMI Z-score | -1.0 ± 1.5 | 0.7 ± 1.7 |
| Head circumference (cm) | 34.5 ± 1.9 | - |
| Mid-arm circumference (cm) | - | 14.5 ± 1.9 |
Abbreviations: BMI, body mass index; SD, standard deviation.
a Data are displayed as mean ± SD.
4.6.2. Toddlers’ Nutritional Habits and Intake Based on DEF Analysis
NutricheQ-predicted risk categories significantly correlated with meat intake and weekly servings of fruits and cooked vegetables (Figure 2).
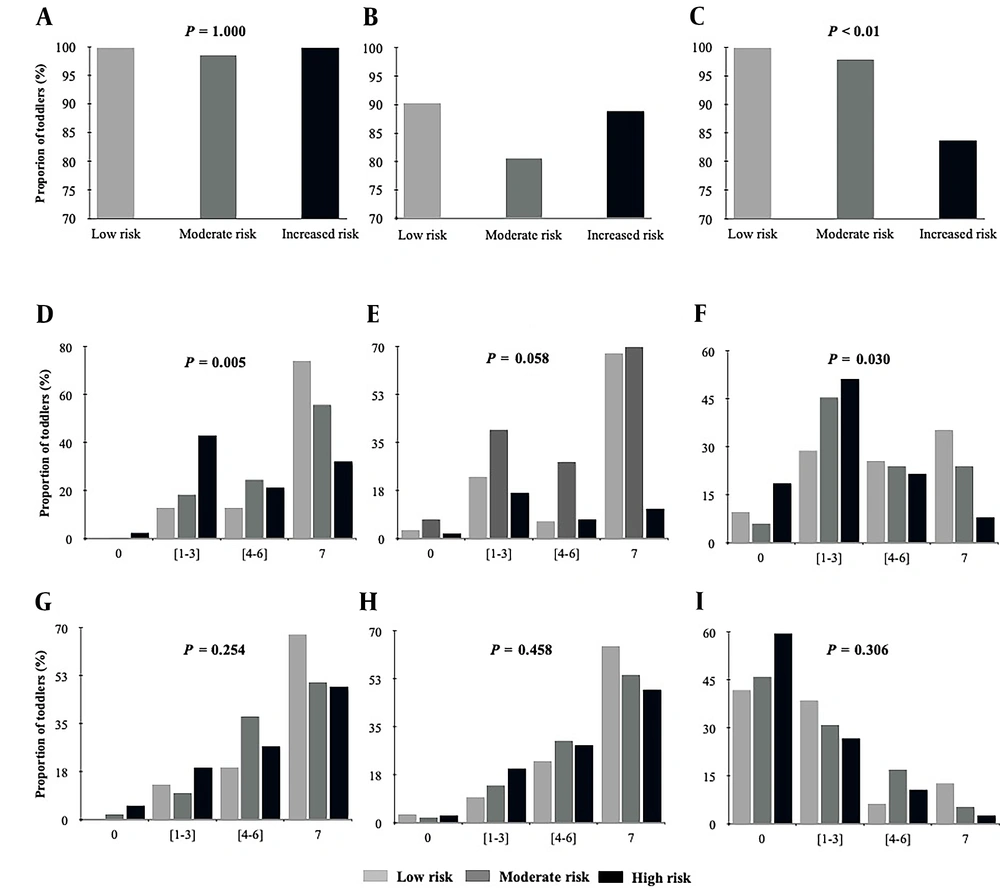
Figure 2.
Toddlers’ nutritional habits and nutritional intake across NutricheQ categories. A, water intake per day; B, milk intake per day; C, meat intake per week; D, fruit intake; E, raw vegetable intake per week; F, cooked vegetable intake per week; G, dairy product intake per week; H, grain intake per week; I, cereal intake per week.
4.7. Snacks
Compared to their peers in the low- and moderate-risk groups, toddlers at increased nutritional risk ate the least amounts of fruits (38.9 % versus 83.9% and 72.5%, respectively) and vegetables (38.9% versus 74.2% and 50%, respectively) while the highest amounts of snacks (66.7 % versus 61.3% and 52.1%, respectively) and biscuits (80.6% versus 64.5% and 73.9%, respectively).
4.7.1. Correlation Between NutricheQ Scores and Demographic and Socioeconomic Characteristics
The nutritional risk score distribution according to demographic and socioeconomic characteristics has been shown in Table 3, indicating no significant association with age (P = 0.366), BMI (P = 0.288), and gender (S) (W) (P = 0.537) (P = 0.713).
Table 3.
Nutritional Risk Group Association with the Place of Residence, Household Monthly Income, and Parents’ Educational Level
| Variables | N | Risk Score No. (%) | ||
|---|---|---|---|---|
| Low Risk | Moderate Risk | Increased Risk | ||
| Place of residence a | ||||
| Rural | 48 | 3 (6.3) | 32 (66.7) | 13 (27.1) |
| Urban | 161 | 28 (17.4) | 110 (68.3) | 23 (14.3) |
| Household monthly income range a | ||||
| < JOD 936 ($1320.2) | 107 | 9 (8.4) | 82 (76.6) | 16 (15.0) |
| ≥ JOD 936 ($1320.2) | 103 | 22 (21.4) | 63 (61.2) | 18 (17.5) |
| Mother’s educational level b | ||||
| Postgraduate | 114 | 25 (21.9) | 71 (62.3) | 18 (15.8) |
| Undergraduate level and below | 97 | 6 (6.2) | 73 (75.3) | 18 (18.6) |
| Father’s educational level a | ||||
| Postgraduate | 130 | 26 (20.0) | 84 (64.6) | 20 (15.4) |
| Undergraduate level and below | 80 | 5 (6.3) | 60 (75.0) | 15 (18.8) |
Abbreviation: JOD, Jordanian Dinars.
a P < 0.05.
b P < 0.01.
Univariate analysis using Spearman correlation showed a negative statistically insignificant correlation between the nutritional risk score and BMI at visit (ρ = -0.04971) and BMI Z-score (ρ = -0.04575) (ANOVA F = 0.9248). However, the nutritional risk score was only correlated with the place of residence, household monthly income, and parents’ educational level. The proportion of toddlers at increased nutritional risk was twice as high in rural than in urban dwellers (P = 0.036) (Student/Wilcoxon; (S) (W), P = 0.003).
A monthly household income below JOD 936 ($1320.2) was significantly more prevalent among toddlers in the moderate nutritional risk group and lower among those in the increased risk group when compared to households with monthly income greater than JOD 936 ($1320.2) (P = 0.018) (ANOVA; F = 2.4644, P = 0.0341).
Additionally, the higher the parents ’educational level, the lower the proportion of toddlers at increased nutritional risk. In this regard, 18 (15.8%) versus 18 (18.6%) toddlers whose mothers held postgraduate and undergraduate degrees, respectively, were at increased nutritional risk (P = 0.006) (ANOVA; F = 2.2187, P = 0.0682). Similar results were observed according to the father’s educational level (P = 0.024) (ANOVA F = 1.9170, P = 0.1089).
4.7.2. Nutrient Intake According to Demographic and Socioeconomic Characteristics
Nutrient intake was compared according to age categories, BMI categories, gender, place of residence, type of milk, household monthly income, and parents’ educational level (Table 4). Nutrient intake was associated with age only. Toddlers beyond the age of two years consumed similar amounts of vitamin A (P = 0.276), decreased vitamin D intake (P = 0.011), an increased intake of iron (P = 0.028), protein (P < 0.001) and fiber (P < 0.001) compared to toddlers below the age of two years.
Table 4.
Nutrient Intake According to Demographic and Socioeconomic Characteristics a
| Variables | N | Vitamin A (μg) RAE | Vitamin D (μg) | Iron (mg) | Protein (g) | Dietary Fibre (g) |
|---|---|---|---|---|---|---|
| Gender | ||||||
| Male | 119 | 214.3 ± 140.2 | 6.8 ± 11.4 | 9.9 ± 3.5 | 39.4 ± 12.1 | 7.8 ± 3.7 |
| Female | 94 | 238.0 ± 210.4 | 5.6 ± 6.3 | 9.1 ± 3.5 | 38.3 ± 12.6 | 7.7 ± 3.5 |
| Age (months) | ||||||
| < 24 | 121 | 216.4 ± 166.9 | 7.2 ± 10.5 | 9.1 ± 3.54 | 35.7 ± 11.0 | 6.9 ± 3.2 |
| ≥ 24 | 92 | 235.8 ± 184.7 | 5.0 ± 7.9 b | 10.1 ± 3.4 b | 43.1 ± 12.7 c | 8.9 ± 3.8 c |
| BMI categories | ||||||
| Underweight | 17 | 237.3 ± 164.4 | 4.2 ± 3.4 | 9.5 ± 3.1 | 34.6 ± 11.1 | 7.3 ± 3.4 |
| Normal weight | 119 | 206.7 ± 161.9 | 5.7 ± 9.0 | 9.1 ± 3.3 | 38.4 ± 12.9 | 8.0 ± 3.6 |
| Overweight | 34 | 241.5 ± 227.8 | 7.9 ± 12.7 | 9.6 ± 3.7 | 38.2 ± 9.6 | 7.1 ± 3.4 |
| Obese | 35 | 256.2 ± 162.3 | 7.7 ± 10.3 | 10.8 ± 4.2 | 44.1 ± 12.7 b | 8.1 ± 3.9 |
| Place of residence | ||||||
| Rural | 48 | 201.9 ± 129.1 | 5.8 ± 10.3 | 9.7 ± 2.9 | 41.4 ± 12.8 | 8.2 ± 3.4 |
| Urban | 161 | 231.7 ± 186.4 | 6.4 ± 9.4 | 9.5 ± 3.7 | 38.3 ± 12.1 | 7.6 ± 3.6 |
| Formula milk feeding | ||||||
| Yes | 138 | 227.5 ± 186.3 | 6.8 ± 11.2 | 9.5 ± 3.6 | 38.7 ± 11.9 | 8.0 ± 3.7 |
| No | 75 | 219.8 ± 152.1 | 5.2 ± 5.0 | 9.6 ± 3.3 | 39.2 ±13.1 | 7.3 ± 3.4 |
| Household monthly income | ||||||
| < JOD 936 ($1320.2) | 107 | 233.7 ± 201.7 | 5.3 ± 7.8 | 9.3 ± 3.3 | 39.6 ± 12.5 | 8.0 ± 3.3 |
| ≥ JOD 936 ($1320.2) | 103 | 217.3 ± 144.4 | 7.3 ± 11.0 | 9.7 ± 3.8 | 38.1 ± 12.3 | 7.5 ± 3.9 |
| Mother’s educational level | ||||||
| Postgraduate level | 114 | 219.0 ± 143.0 | 7.2 ± 10.9 | 9.6 ± 3.7 | 38.0 ± 12.0 | 7.9 ± 3.6 |
| Undergraduate and below | 97 | 231.1 ± 207.8 | 5.2 ± 7.5 | 9.4 ± 3.3 | 39.9 ± 12.7 | 7.5 ± 3.6 |
| Father’s educational level | ||||||
| Postgraduate level | 130 | 211.4 ± 136.9 | 7.5 ± 11.7 | 9.5 ± 3.8 | 37.9 ± 12.3 | 7.7 ± 3.7 |
| Undergraduate and below | 80 | 249.6 ± 223.7 | 4.1 ± 2.9 b | 9.5 ± 3.1 | 40.3 ± 12.1 | 7.8 ± 3.4 |
Abbreviations: RAE, retinol activity equivalents; BMI, body mass index; SD, standard deviation; JOD, Jordanian Dinars.
a Data are displayed as mean ± SD.
b P < 0.05.
c P < 0.001.
5. Discussion
The present study was a national, multicentre, observational validation study that primarily aimed at assessing the validity of the NutricheQ tool in reflecting nutritional risk in 12-to 36-month-old toddlers in Jordan. Based on the NutricheQ score, out of 213 eligible toddlers, around 70% were at moderate nutritional risk, while around 15% and 17% of them were at low and high nutritional risk, respectively.
Our study showed a Cronbach’s alpha of 0.308 for the NutricheQ scale, which was consistent with the report of Rice and colleagues, who justified their low Cronbach’s alpha by the small number of cases and the multi-dimensionality of the NutricheQ questionnaire (i.e., less than 20 questions) (15).
Vitamins A and D, iron, proteins, dietary fibers, and iodine are among the main nutrients essential for a toddler’s healthy growth (18). In this study, none of the Jordanian toddlers assessed met the recommended daily intake for these nutrients, irrespective of their nutritional risk score. Even toddlers at low nutritional risk showed a default intake of vitamins A and D, fibers, and iodine and an excess in protein and iron daily intake; nonetheless, they met the required daily calorie intake of around 1000 kcal. Similarly, in Lebanon, around 12.6 % and 35% of 12-23.9-month-old and 24-48-month-old toddlers showed default vitamin A intake, respectively, while more than 80% of them had vitamin D intake lower than the estimated average requirement (19). Low vitamin D intake was also reported among infants and young children living in France (20) and the UK (21).
All Jordanian toddlers analyzed, irrespective of their risk categories, had a daily iron intake (9 mg at least) above the average daily requirement (P = 0.270) (Table 1). Also, 20% of the toddlers had a daily iron intake below 7 mg (data not shown), which may explain the similar prevalence of anemia in Jordanian toddlers reported in the literature. Similarly, a mean of 9.5 mg of daily iron (Table 4) intake was seen among toddlers aged between 12 and 24 months and 8.1 mg among toddlers aged between 24 and 48 months in Lebanon (19) but not in France and China, where toddlers above the age of two years displayed a median daily iron intake well below 6.0 mg (20, 22). While the low iron intake reported in China may be explained by the low iron bioavailability in rice and wheat products (i.e., the most common food consumed by Chinese toddlers) (22), the high iron intake may be related to the type of milk consumed (23). However, in this study, milk type was associated with the intake level of none of the aforementioned nutrients.
Dietary fibers prevent excessive energy intake and protect against overweight and obesity (24). The highest dietary fiber intake among toddlers at low nutritional risk was related to the consumption of fruits and vegetables, the main sources of dietary fiber. Indeed, NutricheQ-predicted risk categories significantly correlated with the intake of dietary fiber, as well as the number of weekly servings of fruits and cooked vegetables. In accordance with the literature (15, 25), toddlers in the low-risk nutritional group consumed the highest amounts of fruits, cooked vegetables, grain, and dairy products per week,
Also, NutricheQ-predicted risk categories significantly correlated with meat intake per week, so the least meat intake was observed among toddlers in the high-risk nutritional group. Unlike the Lebanese version of the NutricheQ validation study (26), we did not find any significant correlation between age, BMI, BMI-Z score, and the NutricheQ score. However, living in rural areas, having a high household monthly income, and lower parental education were all significantly associated with a high nutritional risk score among toddlers.
Furthermore, the intake of nutrients was found to be a function of age. Toddlers beyond the age of two years ingested lower amounts of vitamin D (P = 0.011) and higher amounts of iron (P = 0.028), proteins (P < 0.001), and fiber (P < 0.001) when compared with toddlers aged less than two years. This may be explained by the fact that toddlers beyond the age of two years eat more solid foods, including vegetables, grain, and meat, which are rich sources of these nutrients.
The limitations of this study include (1) the cross-sectional design of the study that may limit its ability to reflect the actual nutrient intake throughout the year; (2) the relatively small number of toddlers included (213), who may not represent all toddlers across Jordan in terms of family structure and socioeconomic features; and (3) not verifying the actual nutritional status of the toddlers through objective laboratory assessment.
5.1. Conclusions
The NutricheQ questionnaire is a valid tool to predict nutritional risk among toddlers in Jordan. Our findings underscored the need for providing education and boosting awareness, especially in rural areas, to maintain a balanced diet among toddlers and ensure healthy growth and the minimized risk of obesity and metabolic disorders in adulthood. A larger cohort should be considered to evaluate nutritional intake in a prospective setting in the context of biochemical and clinical assessments and growth monitoring.