
1. Background
Obesity is defined as a body mass index (BMI) above the 95th percentile (1, 2). It is a chronic disease, and its prevalence is increasing among adults, adolescents, and children due to lifestyle changes, and has now emerged as an epidemic. In the United States, 25% of children are overweight and 11% are obese (3). The highest prevalence rate of childhood obesity has been observed in developed countries. However, it is also increasing in developing countries such as Iran (4, 5). A study estimated the prevalence of childhood obesity in Iran at 4.79% (5). Children who regularly receive more energy than they need are obese. Many different factors cause an imbalance between energy intake and consumption, including genetic factors, incorrect eating habits, reduced physical activity and exercise, and some medications and diseases (6). Obesity in children leads to serious physical and mental complications, including hypertension, hyperuricemia, diabetes, high cholesterol, heart disease, infertility, fatty liver, sleepiness, asthma, musculoskeletal diseases, joint problems, reduced self-confidence, depression, and guilt (7-11).
Hypertension in children is diagnosed when blood pressure is higher than 95% of children of the same age, height, and sex (12, 13). Since children are always growing and developing, it is not possible to define a fixed limit of blood pressure. Hypertension in children has no specific symptoms. Today, due to lifestyle changes that have led to obesity and inactivity in children, blood pressure prevalence is increasing worldwide (14). The cause of high blood pressure in children can be related to heart, kidney, genetic, and hormonal disorders. Also, children with congenital heart and kidney diseases, premature and underweight, are susceptible to hypertension (15, 16). Children's hypertension may be attributed to sleep apnea, stroke, heart attack, heart failure, and kidney disease (15). Hypertension in children is divided into two categories. Primary hypertension occurs spontaneously and is not caused by a specific disease. Its risk factors include overweight and obesity, family history of hypertension, type 2 diabetes, high cholesterol, and triglycerides. Secondary hypertension develops a specific disease such as chronic kidney disease, heart problems, adrenal gland abnormalities, lupus, or hyperthyroidism (17).
Hyperuricemia is an increase in the uric acid levels of the blood, which occurs as a result of the kidney's inability for its excretion. It is known as uric acid levels above 6 mg/dL in women and above 7 mg/dL in men (18). Natural uric acid levels have antioxidant and protective properties of endothelial cells, while hyperuricemia has anti-oxidant and pro-oxidant properties. These paradoxical roles depend on the microenvironment in different portions of the human body (19, 20). Causes of hyperuricemia include obesity, kidney disease, heredity, alcohol consumption, high-protein foods, gastrointestinal bleeding, diseases such as leukemia, lymphoma, psoriasis, hypertension, and heart failure, drugs such as aspirin, diuretics, tetracycline, corticosteroids, and some antihypertensive drugs (21, 22). Hyperuricemia also leads to complications, including blood pressure, gout, urinary uric acid stones, arthritis, hypersomnia, and platelet changes (23). Some epidemiological studies have reported a relationship between serum uric acid levels and cardiovascular diseases such as hypertension, metabolic syndrome, pre-eclampsia, and diseases of the coronary artery and cerebral artery (24-26).
Considering the complex interaction of serum uric acid, blood pressure, and cardiovascular disease risk factors, it is still under investigation whether uric acid is an independent factor or just an indicator of high blood pressure (27). It has been suggested that various factors such as age (28), height (29), obesity (30), insulin resistance (IR) (31), and renal dysfunction (32), all of which are related to uric acid levels, may play a role in the development of hypertension. Recent studies in humans have also shown that hyperuricemia predicts increased hyperinsulinemia and obesity (33).
2. Objectives
Since previous studies investigated the relationship between one-stage hypertension and uric acid, as well as obesity, uric acid, and hyperinsulinemia, the purpose of our study was to investigate whether hyperuricemia and insulin levels predict hypertension in obese children. We hypothesized that these parameters may help clinicians to predict hypertension.
3. Methods
The current study was an analytical cross-sectional study carried out on the records of obese children aged 5 - 15 years who had been referred to 17 Shahrivar Hospital, Iran, from 2016 to 2017. We performed this study from June 2018 to June 2019. The inclusion criteria were no history of kidney diseases, heart diseases, diabetes, metabolic disorders, neurological disorders, etc. Children who used antihypertensive drugs, uric acid reducers, and obesity treatment were excluded.
Children's blood pressure, height, and weight were measured twice at 5-minute intervals in the traditional way. Before that, the child rested for 30 minutes and did not eat any special food, and one person did the measurements for everyone at a certain time. The measurement of fasting blood sugar (FBS), high-density lipoprotein (HDL), low-density lipoprotein (LDL), triglyceride (TG), hemoglobin A1c (HbA1c), urine albumin, creatinine (urine Alb. Cr), insulin (Ins) level, and uric acid were done in a fasting state at the hospital laboratory. Body mass index (BMI) was also calculated by relevant formulas based on common tables used to measure children's height and weight. The homeostatic model assessment (HOMA) index to assay insulin resistance was also calculated based on the formula: Insulin× FBS/ 405.
3.1. Ethical Considerations
This study was approved by the Ethical Committee of Guilan University of Medical Sciences (code: IR.GUMS.REC.1397.067).
3.2. Statistical Analysis
Data were analyzed using IBM SPSS software version 22. Mean and standard deviation were used to describe quantitative data, and percentage was used for qualitative data. Pearson's correlation coefficient was used to check the correlation between blood pressure and uric acid, and because the data were non-parametric, Spearman's correlation test was used. An independent t-test was used to compare the mean systolic (SBP) and diastolic blood pressure (DBP) in two groups with and without hyperuricemia. Pearson's correlation coefficient was used to investigate the correlation between uric acid and blood pressure, as well as their relationship with lipid profile, blood sugar, insulin, and BMI. In the case of non-normality of uric acid levels, Mann-Whitney's non-parametric test and Spearman's correlation coefficient were used. Finally, to determine the relationship between hypertension hyperuricemia and blood insulin levels, a logistic regression model was used after adjusting the background intervention variables in multiple analyses. The significance level of the tests was considered P < 0.05.
4. Results
In this study, 161 records of overweight (34.2%) and obese (65.8%) children were examined in terms of uric acid level and its relationship with blood pressure and other blood parameters. The mean ± SD of the age of the studied children was 10.8 ± 2.5. The youngest subject was 5 years old, and the oldest was 15 years old. The majority of children (59%) were over 10 years old. The mean ± SD of the uric acid level of children was 4.5 ± 1.1. The lowest level of uric acid was 1.8, and the highest level was 8.9. The demographic characteristics and laboratory parameters of the research units are presented in Table 1.
Table 1.
Frequency of Demographic Variables and Mean ± SD of Laboratory Parameters of the Studied Units a
| Variables | Values |
|---|---|
| BMI | |
| Overweight | 55 (34.2) |
| Obesity | 106 (65.8) |
| BMI | 95.6 ± 4 |
| Sex | |
| Male | 86 (53.4) |
| Female | 75 (46.6) |
| Age (9) | |
| 5 - 10 | 66 (41) |
| 11 - 15 | 95 (59) |
| Hypertension | |
| Yes | 12 (7.5) |
| No | 149 (92.5) |
| Hyperuricemia | |
| Yes | 28 (17.4) |
| No | 133 (82.6) |
| Weight | 56.1 ± 18.2 |
| Height | 145.4 ± 15.2 |
| SBP | 101 ± 10 |
| DBP | 65 ± 7 |
| FBS | 90 ± 7 |
| HbA1c | 5.1 ± 0.9 |
| Insl | 17.3 ± 8 |
| TG | 122 ± 66 |
| Chol | 159 ± 27 |
| LDL | 92 ± 21 |
| HDL | 43 ± 8 |
| Urine Alb. Cr | 8.1 ± 3.8 |
| HOMA | 3.86 ± 2.8 |
Abbreviations: BMI, body mass index; SBP, systolic blood pressure; DBP, diastolic blood pressure; FBS, fasting blood sugar; HbA1c, hemoglobin A1c; Ins, insulin; TG, triglyceride; Chol, cholesterol; LDL, low-density lipoprotein; HDL, high-density lipoprotein; Urine Alb. Cr, urine albumin, creatinine; HOMA, homeostatic model assessment.
a Values are expressed as Mean ± SD or No. (%).
Kolmogorov-Smirnov test was used to evaluate the correlation of uric acid level, lipid profile, blood sugar, and SBP and DBP in the studied children. The results showed that the variables did not have a normal distribution (P < 0.05). Therefore, the non-parametric Mann-Whitney test and Spearman correlation coefficient were used to compare and assay the correlations.
Table 2 shows the linear correlation of uric acid with SBP, DBP, lipid profile, FBS, Ins, HbA1c, anthropometric indices, HOMA index, and urine albumin and creatinine. The data demonstrated that uric acid significantly correlated with SBP and DBP, age, height, weight, insulin, HbA1c, and HOMA index. It also had an inverse and significant correlation with children's BMI. However, the linear correlation of uric acid with other blood parameters was not significant. On the other hand, SBP significantly correlated with DBP, height, weight, insulin, TG, HOMA index, and children's age. DBP also had a significant positive correlation with height, weight, Ins, TG, HOMA index, and the children's age.
Table 2.
Determining the Linear Correlation of Uric Acid Level with Other Parameters in the Studied Children
| Variables | Uric Acid | SBP | DBP |
|---|---|---|---|
| SBP | |||
| Correlation coefficient | 0.258 | 1.000 | 0.744 |
| Sig. (2-tailed) | 0.001 | 0 | 0.000 |
| DBP | |||
| Correlation coefficient | 0.239 | 0.744 | 1.000 |
| Sig. (2-tailed) | 0.002 | > 0.001 | 0 |
| Age | |||
| Correlation coefficient | 0.428 | 0.421 | 0.438 |
| Sig. (2-tailed) | > 0.001 | > 0.001 | > 0.001 |
| Height | |||
| Correlation coefficient | 0.345 | 0.437 | 0.467 |
| Sig. (2-tailed) | > 0.001 | > 0.001 | > 0.001 |
| Weight | |||
| Correlation coefficient | 0.237 | 0.423 | 0.484 |
| Sig. (2-tailed) | > 0.001 | > 0.001 | > 0.001 |
| BMI | |||
| Correlation coefficient | - 0.188 | - 0.138 | - 0.037 |
| Sig. (2-tailed) | 0.017 | 0.081 | 0.643 |
| FBS | |||
| Correlation coefficient | 0.132 | - 0.004 | 0.041 |
| Sig. (2-tailed) | 0.095 | 0.964 | 0.601 |
| HbA1c | |||
| Correlation coefficient | 0.246 | 0.096 | 0.151 |
| Sig. (2-tailed) | 0.002 | 0.236 | 0.061 |
| Insl | |||
| Correlation coefficient | 0.172 | 0.211 | 0.193 |
| Sig. (2-tailed) | 0.033 | 0.009 | 0.017 |
| TG | |||
| Correlation coefficient | 0.091 | 0.216 | 0.160 |
| Sig. (2-tailed) | 0.253 | 0.006 | 0.042 |
| Chol | |||
| Correlation coefficient | 0.041 | 0.182 | 0.107 |
| Sig. (2-tailed) | 0.604 | 0.021 | 0.176 |
| LDL | |||
| Correlation coefficient | - 0.032 | 0.128 | 0.097 |
| Sig. (2-tailed) | 0.685 | 0.106 | 0.223 |
| HDL | |||
| Correlation coefficient | - 0.061 | - 0.034 | - 0.108 |
| Sig. (2-tailed) | 0.441 | 0.671 | 0.173 |
| Urine Alb. Cr | |||
| Correlation coefficient | - 0.025 | - 0.068 | 0.055 |
| Sig. (2-tailed) | 0.781 | 0.448 | 0.542 |
| HOMA | |||
| Correlation coefficient | 0.222 | 0.200 | 0.201 |
| Sig. (2-tailed) | 0.006 | 0.013 | 0.013 |
Abbreviations: BMI, body mass index; SBP, systolic blood pressure; DBP, diastolic blood pressure; FBS, fasting blood sugar; HbA1c, hemoglobin A1c; Ins, insulin; TG, triglyceride; Chol, cholesterol; LDL, low-density lipoprotein; HDL, high-density lipoprotein; urine Alb. Cr, urine albumin, creatinine; HOMA, homeostatic model assessment.
According to the information presented in Table 3, 25% of the studied children who experienced hypertension had hyperuricemia, although this was not significant based on Fisher's test (P = 0.44). Also, SBP and DBP were statistically significant in two groups with and without hyperuricemia. The mean SBP and DBP in obese children with hyperuricemia were significantly higher than in obese children without hyperuricemia (P = 0.014, P = 0.023, respectively). In this table, laboratory parameters are also compared in two groups of children with and without hypertension. The results show that only the children's insulin levels in the two groups with and without hypertension had a statistically significant difference (P = 0.013). Therefore, the average level of insulin in children with obesity and hypertension was higher than in obese children without hypertension.
Table 3.
Comparative Investigation of Blood Pressure and Other Variables in Two Groups with and Without Hyperuricemia in the Studied Children
| Variables | Hyperuricemia | P-Value | |
|---|---|---|---|
| Yes | No | ||
| Hypertension, No. (%) | 0.44 | ||
| Yes | 3 (25) | 9 (75) | |
| No | 25 (16.8) | 124 (83.2) | |
| Hyperuricemia, Mean ± SD | |||
| SBP | 105.9 ± 9.6 | 100.5 ± 9.7 | 0.014 a |
| DBP | 67.3 ± 7 | 64.1 ± 7.1 | 0.023 a |
| FBS | 89.2 ± 7.2 | 90 ± 6.7 | 0.717 |
| HbA1c | 5.6 ± 1.4 | 5.1 ± 0.7 | 0.164 |
| Ins | 18.5 ± 7.8 | 17 ± 8 | 0.292 |
| TG | 120.1 ± 61.3 | 122 ± 67.6 | 0.913 |
| Chol | 154.7 ± 28.6 | 160 ± 26.2 | 0.231 |
| LDL | 89.4 ± 18.6 | 92 ± 21.5 | 0.528 |
| HDL | 41.8 ± 8.3 | 43.2 ± 8.1 | 0.216 |
| Urine Alb. Cr | 9.1 ± 4.9 | 7.9 ± 3.5 | 0.351 |
| HOMA | 4.1 ± 1.7 | 3.9 ± 2.1 | 0.231 |
| Hypertension, Mean ± SD | |||
| SBP | - | - | - |
| DBP | - | - | - |
| FBS | 87.6 ± 6.8 | 90.1 ± 6.8 | 0.321 |
| HbA1c | 5.1 ± 0.6 | 5.2 ± 0.9 | 0.791 |
| Ins | 25 ± 11.2 | 16.7 ± 7.4 | 0.013 a |
| TG | 140.9 ± 66.2 | 120.1 ± 66.3 | 0.138 |
| Chol | 157.9 ± 37.5 | 159.2 ± 25.7 | 0.88 |
| LDL | 89.4 ± 27.4 | 91.7 ± 20.5 | 0.748 |
| HDL | 40.2 ± 5.2 | 43.2 ± 8.3 | 0.301 |
| Urine Alb.Cr | 9.5 ± 5 | 8 ± 3.7 | 0.336 |
| HOMA | 5.1 ± 2.5 | 3.8 ± 2 | 0.064 |
Abbreviations: SBP, systolic blood pressure; DBP, diastolic blood pressure; FBS, fasting blood sugar; HbA1c, hemoglobin A1c; Ins, insulin; TG, triglyceride; Chol, cholesterol; LDL, low-density lipoprotein; HDL, high-density lipoprotein; urine Alb. Cr, urine albumin, creatinine; HOMA, homeostatic model assessment.
a Significant P values.
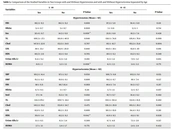
Table 4 compares the laboratory parameters in two groups with and without hypertension, separated by sex. The data in this table show that only the levels of insulin in males with hypertension were higher than in males without hypertension (P = 0.019). In females, as in males, the amount of insulin in the hypertension group was higher than in the non-hypertension group, but this difference was not significant. On the other hand, SBP and DBP were statistically significantly different in two groups of obese females with and without hyperuricemia (P = 0.024, P = 0.027, respectively). These values were higher in obese males with hyperuricemia than in those without hyperuricemia, but it was not statistically significant. In the male group, only cholesterol and LDL were statistically significant (P = 0.029, P = 0.034, respectively). It is noteworthy that the levels of cholesterol and LDL in the obese male group without hyperuricemia were higher than in the group with hyperuricemia.
Table 4.
Comparison of the Studied Variables in Two Groups with and Without Hypertension and with and Without Hyperuricemia Separated by Sex
| Variables | Male | P-Value | Female | P-Value | ||
|---|---|---|---|---|---|---|
| Yes | No | Yes | No | |||
| Hypertension, Mean ± SD | ||||||
| FBS | 89 ± 5.7 | 91 ± 7.1 | 0.628 | 86.2 ± 8 | 89 ± 6.4 | 0.44 |
| HbA1c | 5.2 ± 0.8 | 5 ± 0.7 | 0.362 | 4.9 ± 0.4 | 5.4 ± 1 | 0.136 |
| Ins | 27 ± 9.8 | 16.3 ± 7.4 | 0.019 a | 23.4 ± 12.9 | 17.2 ± 7.4 | 0.237 |
| TG | 155 ± 80.9 | 119.3 ± 62 | 0.127 | 126.8 ± 51.4 | 121.1 ± 71.4 | 0.564 |
| Chol | 176 ± 34.4 | 158 ± 27.3 | 0.164 | 139.8 ± 33.7 | 160.5 ± 23.8 | 0.080 |
| LDL | 100.5 ± 26.7 | 91.5 ± 20.5 | 0.236 | 78.3 ± 25.2 | 91.9 ± 20.6 | 0.109 |
| HDL | 41.7 ± 6.1 | 42.1 ± 8.1 | 0.966 | 38.7 ± 4.2 | 44.3 ± 8.5 | 0.085 |
| Urine Alb.Cr | 6.9 ± 2.4 | 8 ± 3.7 | 0.481 | 12.1 ± 5.7 | 7.9 ± 3.8 | 0.071 |
| HOMA | 5.4 ± 2 | 3.8 ± 2.3 | 0.070 | 5 ± 2.9 | 3.8 ± 1.7 | 0.370 |
| Hyperuricemia, Mean ± SD | ||||||
| SBP | 107.5 ± 12.7 | 101.7 ± 9.2 | 0.131 | 104.7 ± 6.7 | 99 ± 10.2 | 0.024 a |
| DBP | 68.3 ± 8.3 | 65.1 ± 7 | 0.161 | 66.6 ± 6 | 62.7 ± 7.1 | 0.027 a |
| FBS | 87.3 ± 8 | 91.5 ± 6.7 | 0.121 | 90.7 ± 6.4 | 88.3 ± 6.5 | 0.166 |
| HbA1c | 5.3 ± 1.4 | 5 ± 0.6 | 0.671 | 5.7 ± 1.5 | 5.2 ± 0.8 | 0.262 |
| Insl | 19.4 ± 9.1 | 16.6 ± 7.8 | 0.402 | 17.8 ± 7 | 17.7 ± 8.4 | 0.611 |
| TG | 118.9 ± 79.6 | 122.3 ± 61.3 | 0.270 | 121.1 ± 46 | 121.7 ± 75.2 | 0.526 |
| Chol | 144.4 ± 33.7 | 161.7 ± 26.4 | 0.029 a | 162.4 ± 22.3 | 157.8 ± 25.9 | 0.526 |
| LDL | 80.6 ± 19.5 | 94 ± 20.7 | 0.034 a | 95.9 ± 15.4 | 89.5 ± 22.3 | 0.260 |
| HDL | 40.3 ± 8 | 42.4 ± 8 | 0.208 | 42.9 ± 8.5 | 44.1 ± 8.3 | 0.464 |
| Urine Alb.Cr | 9.7 ± 4.8 | 7.7 ± 3.3 | 0.187 | 8.7 ± 5.1 | 8.1 ± 3.8 | 0.972 |
| HOMA | 3.8 ± 1.7 | 3.9 ± 2.4 | 0.835 | 4.3 ± 1.7 | 3.8 ± 1.9 | 0.218 |
Abbreviations: SBP, systolic blood pressure; DBP, diastolic blood pressure; FBS, fasting blood sugar; HbA1c, hemoglobin A1c; Ins, insulin; TG, triglyceride; Chol, cholesterol; LDL, low-density lipoprotein; HDL, high-density lipoprotein; Urine Alb. Cr, urine albumin, creatinine; HOMA, homeostatic model assessment.
a Significant P-values.
The information in Table 5 shows that there is a significant difference in the amount of insulin and HOMA index in the age group of 5 - 10 years between the two groups with and without hypertension (P = 0.006, P = 0.006; respectively). Insulin levels and HOMA index are lower in children without hypertension compared to children with hypertension. Also, only HDL in obese children aged 5 - 10 had a significant difference between the two groups with and without hyperuricemia (P = 0.042), so the amount of HDL in children without hyperuricemia was higher than in children with hyperuricemia.
Table 5.
Comparison of the Studied Variables in Two Groups with and Without Hypertension and with and Without Hyperuricemia Separated by Age
| Variables | 5 - 10 | P-Value | 11 - 15 | P-Value | ||
|---|---|---|---|---|---|---|
| Yes | No | Yes | No | |||
| Hypertension, Mean ± SD | ||||||
| FBS | 88.3 ± 9.3 | 88.3 ± 6.2 | 0.808 | 87.3 ± 5.9 | 91.4 ± 6.9 | 0.121 |
| HbA1c | 5.1 ± 0.7 | 5 ± 0.7 | 0.900 | 5 ± 0.6 | 5.3 ± 1 | 0.714 |
| Ins | 30.4 ± 8.7 | 14.5 ± 6.9 | 0.006 a | 21.9 ± 11.8 | 18.2 ± 7.4 | 0.438 |
| TG | 106.5 ± 27.1 | 110.8 ± 46.9 | 0.646 | 158.1 ± 74.6 | 126.8 ± 76.8 | 0.086 |
| Chol | 147.8 ± 22.6 | 153.5 ± 24.6 | 0.707 | 163 ± 43.7 | 163.2 ± 25.8 | 0.904 |
| LDL | 89 ± 25.1 | 88.8 ± 20.9 | 0.840 | 89.6 ± 30.1 | 93.8 ± 20 | 0.881 |
| HDL | 40.3 ± 2.6 | 43.1 ± 8.4 | 0.705 | 40.1 ± 6.3 | 43.2 ± 8.3 | 0.349 |
| Urine Alb.Cr | 11.4 ± 6.2 | 8.3 ± 3.4 | 0.169 | 8.3 ± 1.4 | 7.8 ± 3.2 | 0.815 |
| HOMA | 6.6 ± 2 | 3.2 ± 1.5 | 0.006 a | 4.2 ± 2.3 | 3.4 ± 2.2 | 0.771 |
| Hyperuricemia, Mean ± SD | ||||||
| SBP | 101.3 ± 14.4 | 97.1 ± 9.2 | 0.650 | 106.7 ± 8.8 | 103.5 ± 9.1 | 0.155 |
| DBP | 61.3 ± 6.3 | 61.9 ± 6.1 | 0.806 | 68.3 ± 6.7 | 66 ± 7.4 | 0.137 |
| FBS | 88 ± 6.9 | 88.7 ±6.4 | 0.969 | 89.4 ± 7.4 | 91.5 ± 6.7 | 0.317 |
| HbA1c | 4.7 ± 0.5 | 5 ± 0.7 | 0.311 | 5.7 ± 1.5 | 5.1 ± 0.7 | 0.107 |
| Insl | 17 ± 14 | 15.5 ± 7.6 | 0.692 | 18.7 ± 6.7 | 18.4 ± 8.2 | 0.482 |
| TG | 124.3 ±76.1 | 109.7 ± 44.1 | 0.928 | 119.5 ± 60.4 | 132.8 ± 81.6 | 0.482 |
| Chol | 145.5 ± 19.2 | 153.6 ± 24.7 | 0.475 | 156.3 ± 29.9 | 165.5 ± 26.3 | 0.160 |
| LDL | 82.8 ± 5.2 | 89.2 ± 21.5 | 0.806 | 90.5 ± 19.9 | 94.4 ± 21.3 | 0.381 |
| HDL | 36.8 ± 1.4 | 43.3 ± 8.2 | 0.042 a | 42.6 ± 8.5 | 43.1 ± 8.1 | 0.630 |
| Urine Alb.Cr | 11.1 ± 6.5 | 8.3 ± 3.4 | 0.308 | 8.7 ± 4.6 | 7.5 ± 2.6 | 0.517 |
| HOMA | 3.7 ± 3.1 | 3.4 ± 1.7 | 0.775 | 4.2 ± 1.5 | 3.4 ± 2.4 | 0.453 |
Abbreviations: SBP, systolic blood pressure; DBP, diastolic blood pressure; FBS, fasting blood sugar; HbA1c, hemoglobin A1c; Ins, insulin; TG, triglyceride; Chol, cholesterol; LDL, low-density lipoprotein; HDL, high-density lipoprotein; Urine Alb. Cr, urine albumin, creatinine; HOMA, homeostatic model assessment.
a Significant P-values.
In multivariate analysis, a multivariate linear regression model was used to investigate the relationship between uric acid and blood pressure in obese children by adjusting the effects of other investigated variables. As can be seen in Table 6, based on the results of this model, although the effect of SBP and DBP was significantly related to hyperuricemia in univariate analysis, it was not considered a strong predictor in multivariate analysis based on the linear regression model (P > 0.05). Finally, the strongest predictors related to uric acid were age (P < 0.001, B = 0.183), HbA1c (P = 0.014, B = 0.255), and cholesterol (P = 0.03, B = -0.007). It was found that based on the overall Scatterplot, these three factors predict 22.6% of uric acid changes (R = 0.226). Of these, based on the partial regression plots below, the share of age was 16.8%, the share of cholesterol was 1.5%, and the share of HbA1c was 4.5%.
Table 6.
Multivariate Analysis to Investigate the Relationship Between Uric Acid and Blood Pressure in Obese Children by Adjusting the Effects of Other Investigated Variables
| Model | Unstandardized Coefficients | Sig. a | 95.0% Confidence Interval for B | ||
|---|---|---|---|---|---|
| B | Std. Error | Lower Bound | Upper Bound | ||
| 1 | |||||
| Constant | 2.565 | 0.426 | 0.000 | 1.721 | 3.409 |
| Age | 0.193 | 0.039 | 0.000 | 0.117 | 0.270 |
| 2 | |||||
| Constant | 1.625 | 0.590 | 0.007 | 0.458 | 2.793 |
| Age | 0.168 | 0.040 | 0.000 | 0.089 | 0.246 |
| HbA1c | 0.235 | 0.104 | 0.025 | 0.030 | 0.441 |
| 3 | |||||
| Constant | 2.550 | 0.717 | 0.001 | 1.130 | 3.969 |
| Age | 0.183 | 0.040 | 0.001 | 0.104 | 0.261 |
| HbA1c | 0.255 | 0.103 | 0.014 | 0.052 | 0.458 |
| Chol | - 0.007 | 0.003 | 0.030 | - 0.014 | - 0.001 |
a Significant P-values.
5. Discussion
The results of the present study showed that the mean SBP and DBP in obese children with hyperuricemia were higher than in obese children without hyperuricemia, especially in females. The average insulin in children with obesity and hypertension was higher than in obese children without hypertension, especially in males and the age group of 5 - 10 years. The levels of cholesterol and LDL in the obese male group without hyperuricemia were higher than in the group with hyperuricemia. Also, the levels of HDL in 5 - 10-year-old children without hyperuricemia were higher than in children with hyperuricemia. Although the effect of SBP and DBP was related to hyperuricemia in univariate analysis, it was not considered a strong predictor in multivariate analysis. The strongest predictors related to uric acid were age, HbA1c, and cholesterol, respectively.
One of the main causes of hyperuricemia in children is obesity, which is associated with disorders such as hypertension, dyslipidemia, insulin resistance, and chronic kidney diseases (34-36). It is suggested that hyperuricemia can be considered a predictor of cardiometabolic diseases in early childhood (11, 37, 38). Consistent with our study, in a number of studies, the association of hyperuricemia with hypertension has been stated in adults and children (25, 39-41). It has been demonstrated that each 1 mg/dL increase in uric acid level increases the risk of pre-hypertension or hypertension by at least 50% over normotensive children (22). Hyperuricemia can reduce nitric oxide levels in the endothelium, increase oxidative stress, and activate the renin-angiotensin system, and in this way, it is considered a causal factor for hypertension (42). A study showed that a long-term implementation of healthy lifestyle changes and a decrease in serum uric acid levels among a group of children at risk of cardiovascular disease lead to changes in blood pressure (43). In the study of Ozalp Kizilay et al. in 2019, no relationship was found between hyperuricemia and hypertension. They attributed this to the observation that the duration of exposure to uric acid and the inflammation and oxidative stress caused by it had been probably short (37). In addition, the present study showed that blood pressure was higher in obese females with hyperuricemia compared to males. In its explanation, we can mention the issue of puberty and hormones because girls' puberty happens earlier and at a younger age. The studies by Sebekova et al. and Lin et al. in 2020 were in line with our findings that showed hyperuricemia and hypertension were greater in females than in males (44, 45).
A section of our study showed a significant and inverse relationship between uric acid and children's BMI. Contrary to our study, several studies have shown that hyperuricemia is not related to BMI, but the distribution pattern of visceral body fat plays a more important role (37, 46-48). For example, the study by Ozalp Kizilay et al. showed that an increase in the wrist resulted in an increase in uric acid in children. Hip ratio and wrist circumference were also influential, but BMI was not (37). Another study by Sebekova et al.2020 showed that hyperuricemia in obese and Overweight adolescents had a direct and significant relationship with BMI (44, 49). This difference may be attributed to the age of the studied children. Furthermore, in school children with hypertension, significantly higher records of age, height, weight, and BMI were observed (50).
The findings of the present study confirmed a significant negative correlation between uric acid and HDL, and HDL levels were low in 5 - 10-year-old children with hyperuricemia. Also, cholesterol and LDL levels were higher in the obese males without hyperuricemia. In this regard, several studies have shown that high uric acid is associated with a decrease in HDL and an increase in serum cholesterol and triglycerides (37, 41, 49, 51, 52). The cause of dyslipidemia in hyperuricemia can be related to inflammation and vascular damage that induces the risk of atherosclerosis. Valle et al. also showed a correlation between uric acid levels and inflammatory biomarkers and endothelial dysfunction in obese children close to puberty. Also, this negative correlation between HDL and uric acid was confirmed (53).
The present results indicated a significant relationship between uric acid and insulin and the HOMA index. In line with these pathological findings, several studies confirmed that hyperuricemia is a predictor of IR and hyperinsulinemia and, subsequently, increases the HOMA index (37, 51, 54, 55). It has been demonstrated that with each 1 mg/dL increase in uric acid, the risk of IR increases by 91%. The possible mechanism for that is decreased renal secretion and increased production by the hexose monophosphate shunt (56). Also, hyperuricemia-mediated endothelial dysfunction can decrease insulin uptake through low blood flow in peripheral tissues (57). On the other hand, with the increase in insulin resistance, the blood glucose level increases and causes hemoglobin to become glycosylated, and thus, the blood HbA1c level increases, which indicates poor blood sugar control in the studied children.
Considering that changes in uric acid levels occur gradually during development, it is natural that the amount of uric acid depends on age, as seen in our study. In line with this finding of ours, Kumar and colleagues 2021 showed that hyperuricemia was more common in older children (58).
Another important finding of the present study was that the level of insulin and HOMA index increased significantly in obese children with hypertension, especially in males and the age group of 5 - 10 years. Some studies confirmed an increase in HOMA index, IR, and hyperinsulinemia in obese and hypertension children and adolescents (59, 60). More than three decades ago, it was demonstrated that hyperinsulinemia and IR play an important role in increasing BP associated with obesity, called “syndrome X”. Hyperinsulinemia can increase BP through increases in sympathetic nervous system activity and renal sodium retention. Also, hyperinsulinemia-induced hyperglycemia and dyslipidemia caused vascular and kidney injury (61). In the completion of our results, Galipeau et al. observed that hypertension was higher in male rats with hyperinsulinemia compared to female ones. They justified this by the fact that female rats are less susceptible to the vasoconstrictor TxA2 (62). Furthermore, Takizawa et al. revealed that in human hypertension-associated hyperinsulinemia is higher in males than females (63). Such sex differences may be related to female sex hormones that protect against the adverse cardiovascular effects of hyperinsulinemia. Also, it may be related to differences in adipose distribution or lipid metabolism, or both mechanisms.
Among the limitations of the present study are the small statistical population and the lack of comparison of the obtained data with a control group. Since the current study was a cross-sectional study, conducting controlled studies with a larger statistical population is recommended.
5.1. Conclusions
In summary, there is a relationship between uric acid levels and parameters such as obesity, blood pressure, and insulin. The prevalence of hyperuricemia in overweight and obese children is high, which shows that hyperuricemia can be a predictor of hyperinsulinemia and obesity. Therefore, this study can raise the issue that the status of uric acid should be taken into consideration by physicians and the healthcare system.