


1. Background
Co-authorship network analysis in health-related studies is a powerful method for evaluating and understanding the research structure in specific topics and the evolution of research networks over time (1). Scientific collaboration is a complex social phenomenon (2). Since the 1980s, the study on the emergence and evolution of collaboration has started, and with the increase of studies in the following decades, the use of co-authorship networks to study interdisciplinary collaboration networks has become common (3). Co-authorship, as a measure, shows the level of communication between researchers (4). Co-authorship networks are used to determine and identify the structure of scientific collaborations and researchers’ individual positions (5). In addition, co-authorship network analysis is used to discover the roots of collaboration in different scientific fields and to identify key nodes (6, 7). Examining the behavioral patterns of authors over time, investigating potential associations and scientific leadership among disciplines, and identifying the behavior and strength of collaboration among scientists are some of the most important applications of co-authorship network analysis (8, 9). The degree centrality is obtained by counting the number of relations of each node and in fact refers to the number of connections entering or leaving a node. Betweenness centrality is the number of times a node connects a pair of other nodes and is revealing the importance of the node in terms of its position on the map and the exchange and transmission of information in the network. Closeness centrality is based on distance and focuses on structural characteristics related to the accessibility, health, and security of agents. Closeness centrality is the shortest distance between each node and other nodes in each network (10-13). The specific eigenvector centrality of a node is equal to the sum of the specific eigenvector centrality of all the nodes connected to it and is used to determine the node with the most nodes connected to it (11).
Density represents the degree of connectivity of network nodes, and is obtained by dividing the number of existing edges by the number of possible edges. The density value is a number between 0 and 1, according to which the closer the number is to 1, the higher the density of the network (14, 15). The concept of link strength in social networks introduced by Granovetter in 1973 indicates the strength of relationships between people in the network. The network structure depends on the strength of the links (14). Various studies in fields of medical images such as radiology (16-18), ultrasound (19), diagnostic imaging (20), neuroimaging (21), and magnetic resonance imaging (22), with an emphasis on the quantitative review of scientific outputs, but none of the studies mentioned the structure of co-authorship networks. Duffett et al. identified a core group of authors who controlled and dominated the flow of knowledge in the pediatric intensive care co-authorship network (23). Higaki et al., investigated the co-authorship network of articles published in cardiovascular research utilizing machine learning with a social network analysis approach (24). The study of Osareh et al., in the field of cancer in Iran showed that the density of co-authorship network of the researchers was low (25). Reported by Baji and Osareh, the clustering coefficient of the co-authorship network of neuroscience field in Iran was 4.87 and the average distance between nodes was to 2.93. The density of the network showed that 42% of the possible links have occurred in the network (26). A study by Zandian et al. showed that there is a strong and effective collaboration network between Iranian researchers in the medical field (27).
The review of previous studies shows that researchers have paid special attention to co-authorship network analysis to identify co-authorship patterns, examine centrality measures, investigate network structure, and social influence of researchers in different scientific fields. Considering the importance of this field in the health of the individual and society, it is necessary to identify and strengthen the co-authorship networks of researchers in order to develop this field. The lack of comprehensive research regarding the analysis of the co-authorship network in the field of medical images and its impact on the public health, identifying influential researchers in this field is very important in strategic planning for the quantitative and qualitative development of the field, increasing scientific achievements and improving the society health.
2. Objectives
The aim of this study was to identify the structure of co-authorship networks in the field of medical images, and the realization of this goal at the international level is considered the originality and value of the research. We tried to answer this question: What was the pattern of participation and the structure of the co-authorship network of researchers in the field of medical images with the approach of social network analysis in the time periods of 1991 - 2000, 2001 - 2010, and 2011 – 2020?
3. Methods
This was a descriptive cross-sectional study. The social network analysis approach examines the types of associations between authors that form a social network and has the ability to reveal the pattern of interaction between important individual (28).
Due to the multi-field nature of medical images, there was a concern that by choosing Medline, we would neglect researchers from other interdisciplinary fields. Therefore, the Web of Science was chosen due to its broad subject coverage to identify connections between researchers in related fields. The web of science is the most reliable citation database in the world, managed by the Clarivate Analytics Institute and covers various fields of science. In order to retrieve scientific outputs in the field of medical images, this search was conducted in February 2021, during which, with the help of related experts, 6 main thematic groups of human medical images were selected and implemented with the operator (OR) in the subject field (TS) in the advanced search section of the WoS database.
TS = (“medical imag*” OR “clinical imag*” OR “biomedical imag*” OR “diagnostic imag*” OR “molecular imag*” OR “hybrid medical imag*”) NOT TS = (“in vitro” OR “pre clinic*” OR “Preclinic*” OR animal).
The number of articles retrieved before 1991 was 393, which were omitted due to the small sample size for scientometric studies, therefore, 1991 was considered as the turning point of the reviewed studies. Also, 2020 was considered as the end point of the reviewed studies. The search time period was divided into 3 ten-year parts and records related to each time period were saved in a separate file. After pre-processing and removing duplicates, the research sample included 37,190 article records.
In the process of building a collaboration network, special attention should be paid to the ambiguity of the names of the authors. One of the problems related to authors’ names is the presence of a researcher with several names or several researchers with the same name (29, 30). In WoS, 2 fields of (AU) and (AF) are defined for searching the names of authors. AU contains the last name and first letter of the author’s name, and AF contains the last name and first name of the author. AF was used in this study to reduce the ambiguity of the authors’ names. In the next step, the list of authors was extracted with Bibexcel software, and identical names with a frequency of more than 3 repetitions that had the same email address and organizational affiliation were manually compared in order to remove ambiguity, which resulted in the homogenization of the author’s names. Most of the names extracted from the AF field in the period 1991 - 2000 lacked the full first name of the authors, although this case was observed with less severity in other time periods.
Validity and reliability of the data due to the static nature of the data, the use of the reliable citation database of the web of science to extract the data, the disambiguation of the authors’ names, the use of reliable software such as Bibexcel, Vosviewer, Gephi, are confirmed. The adjacency matrix was created with Bibexcel. The matrix created in 3 time periods was equal to 862 × 862, 977 × 977, and 3169 × 3169 units, respectively. In matrices, diagonal cells are considered 0. Gephi has been used to calculate the micro and macro parameters of the network. The threshold of the number of articles for each author in the first and second periods was 2 and more, and in the third period was 4 and more articles.
According to the value of the research variable in each time period, in the present study, the minimum link strength threshold of 5 in the time period of 1991 - 2000 and 2001 - 2010, and the minimum link strength of 10 for the period of 2011 - 2020 was selected. Co-authorship networks were performed using Vosviewer.
4. Results
In the investigated time periods, the highest amount of increase belonged to the collaboration pattern of 10 or more authors and the average increase of this pattern was 9.57% from the period 1991 - 2000 to the period 2011 - 2020.
According to Figure 1, the collaboration patterns of 1 author, 2 authors, and 3 authors have had a decreasing trend from the period of 1991 - 2000 to the period of 2011 - 2020. The average changes of the pattern of 1 author, 2 authors and 3 authors were -8.53, -10.05, and -4.88, respectively. The trend of tendency towards the pattern of collaboration of 4 authors in the period of 2001 - 2010 has been increasing and then decreasing. Tendency to collaboration patterns of 5 to 10 authors and more have an increasing trend in passing from the first time period to the third time period, with the range of changes between the values of 0.24 and 3.78%.
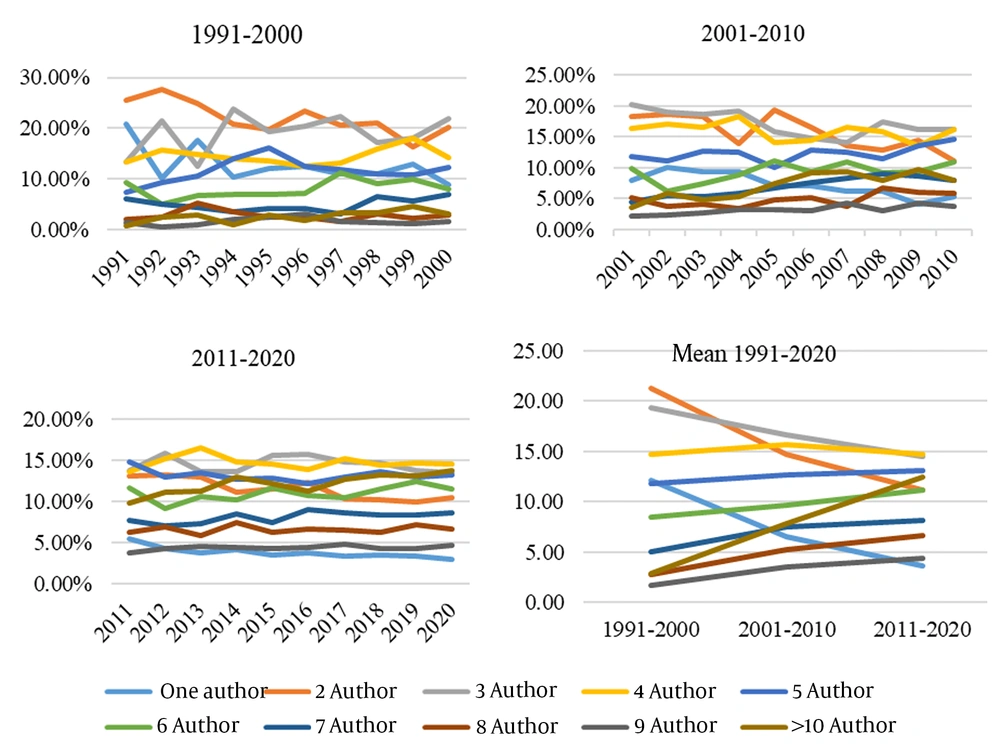
Figure 1.
The average and percentage growth of authors’ collaboration patterns in 3 time periods: 1991 - 2000, 2001 - 2010 and 2011 – 2020
The co-authorship network in the period of 1991 - 2000, consisted of 34 clusters, and the highest number of collaboration links in this network with the values of 18, 16, and 14 belonged to “Dipaola, R.”, “Frouin, F.”, and “Nishikawa, R. M.”. The highest total link strength of collaboration with values of 76, 72 and 68 belonged to “Panayiotakis, G. S.”, “Cavouras, D.”, and “Dipaola, R.”, respectively. In this time period, the most collaborations occurred between “Cavouras, D., Panayiotakis, G. S.”, “Kandarakis, I., Nomicos, C. D.”, “Panayiotakis, G. S., Kandarakis, I.” and “Nomicos, C. D., Cavouras, D.” with 16 collaboration links between each pair.
As seen in Figure 2, the largest cluster shown in red had 24 members, in which “Nishikawa, R. M.” was the strongest cluster member with 14 links and a total link strength of 15, and in the next rank, “Doi, K.” and “Metz, C. E.” had 9 links and had a total link strength of 12 and 9, respectively. The second cluster, shown in dark green, had 19 members, where “Dipaola, R.” was the strongest cluster member with 18 links and a total link strength of 68. The second place in this cluster belonged to “Foruin, F.” with 16 links and a total link strength of 52, and the third place belonged to “Kahn, E.” with 9 links and a total link strength of 31. Each of the third (dark blue color), fourth (yellow color) and fifth (purple color) clusters had 12 members. In the third cluster, “Ratib, O.” was at the topmost position with 7 links and a total link strength of 15. In the fourth cluster “Nakano, H.” with 9 links and a total link strength of 12, and in the fifth cluster “Aberle, D. R.” with 11 links and a total link strength of 17 were the strongest members of the clusters.
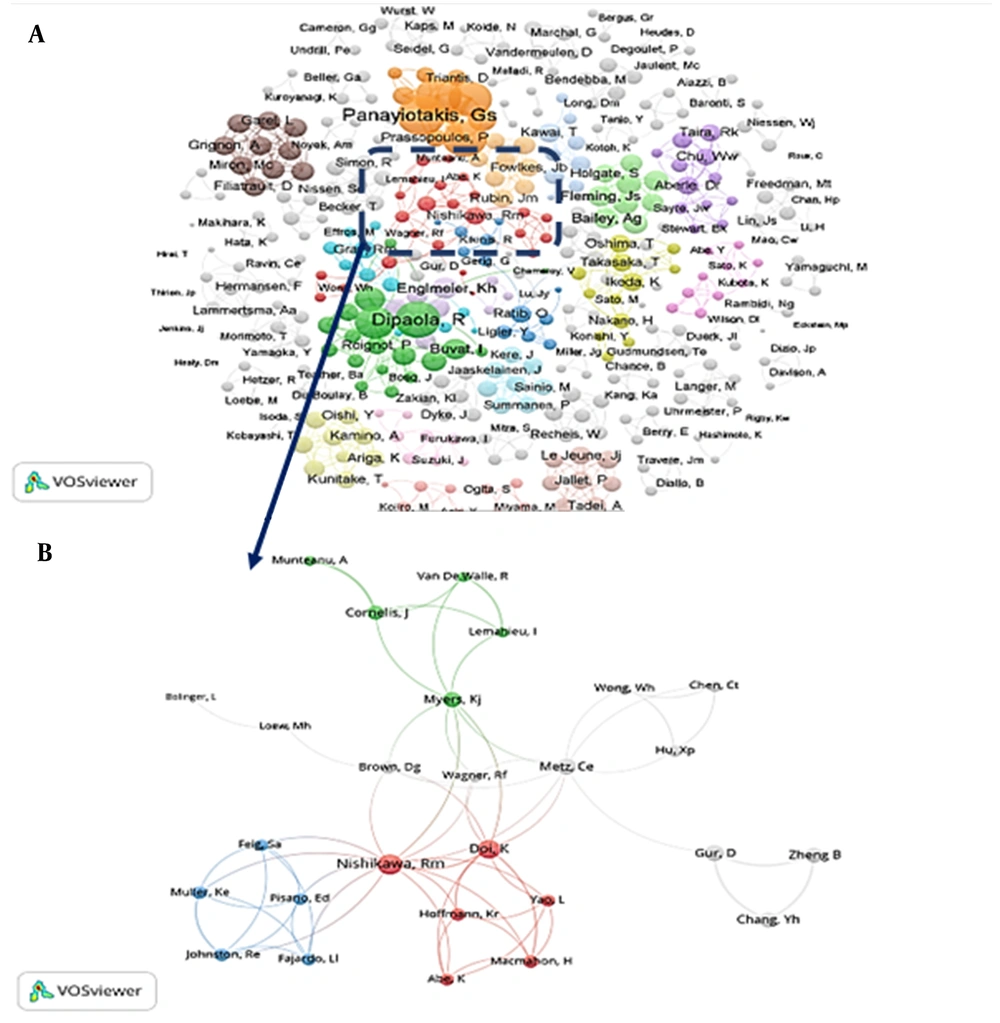
Figure 2.
Co-authorship network of articles in the field of medical images in the period of 1991 - 2000. A, Network overview; B, View of the largest collaboration group in the co-authorship network with 27 members
The co-authorship network in the period of 2001 - 2010, consists of seventy clusters, and the highest number of collaboration links in this network belongs to “Hoexter, Marcelo Queiroz” and colleagues shown in red, with 25 members. In this time period, the most collaboration was formed between “Alkadhi, Hatem, Leschka, Sebastian” with 17 links. In terms of total link strength, “Alkadhi, Hatem” and “Leschka, Sebastian” were the strongest members of this network, each with 11 collaboration links and a total link strength of 100.
As seen in Figure 3, the largest cluster shown in green had 23 members, in which “Gelovani, Juri” was the strongest cluster member with 22 links and a total link strength of 28. Each of the third (dark blue color), fourth (yellow color) clusters had 17 members, and each of the members had 16 links and the total link strength of each cluster was 16. In the third cluster, “Aptekar, Jacob W.” and colleagues, and in the fourth cluster “Lomenick, Brett” and colleagues, had the highest values of collaboration links with 16 collaboration links. The eighth cluster was the strongest co-authorship cluster where “Alkadhi, Hatem”, “Leschka, Sebastian” and “Marincek, Borut” were the most prominent members of the cluster with a total link strength of 100, 100, and 88, respectively.
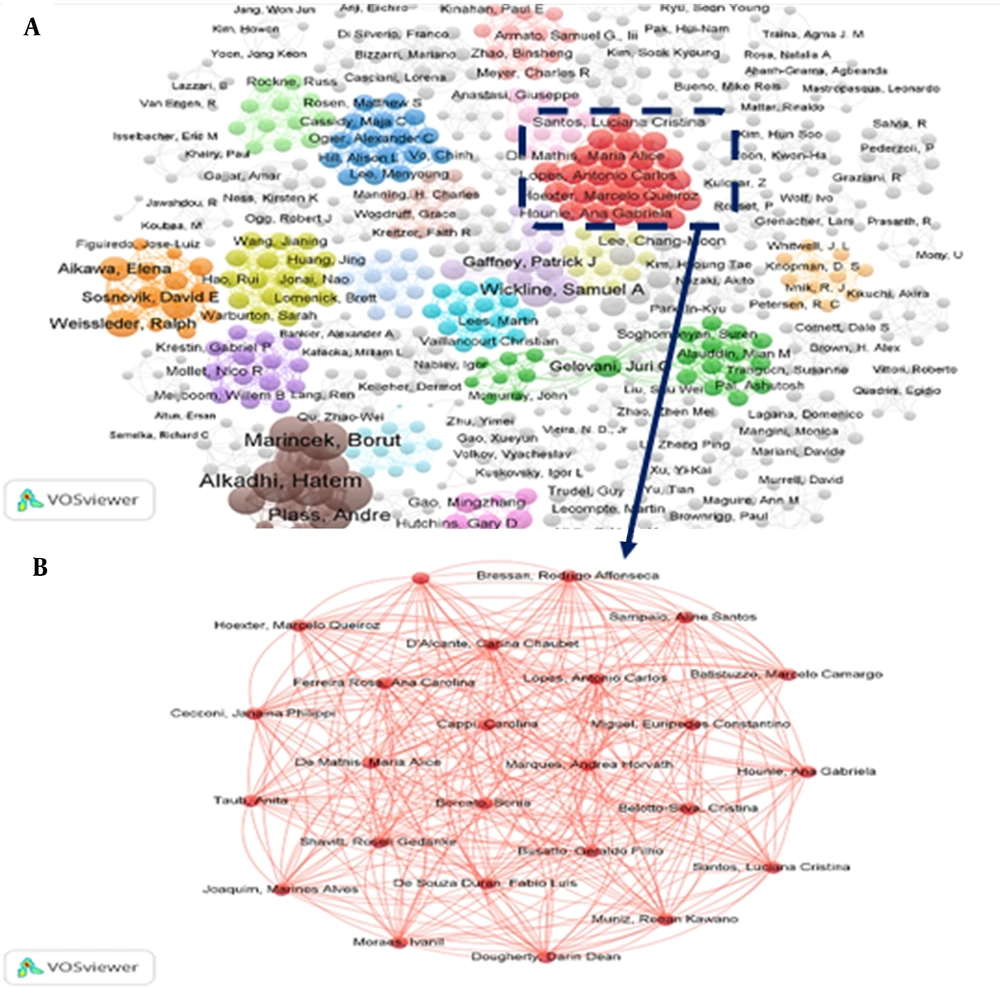
Figure 3.
Co-authorship network of articles in the field of medical images in the period of 2001 - 2010. A, Network overview; B, View of the largest collaboration group in the co-authorship network with 25 members
Figure 4 shows the co-authorship network in the period 2011 - 2020, consisted of 60 clusters, in which the most links belonged to “Van Ginneken, Bram”, “Herrmann, Ken” and “Ourselin, Sebastien” with 58, 55 and 50 links, respectively. The most collaboration occurred between the pair of authors: “Silva, Aristofanes Correa, Gattass, Marcelo”, “Orlova, Anna, Tolmachev, Vladimir” and “Silva, Aristofanes Correa, De Paiva, Anselmo Cardoso” with 29, 22 and 21 links, respectively.
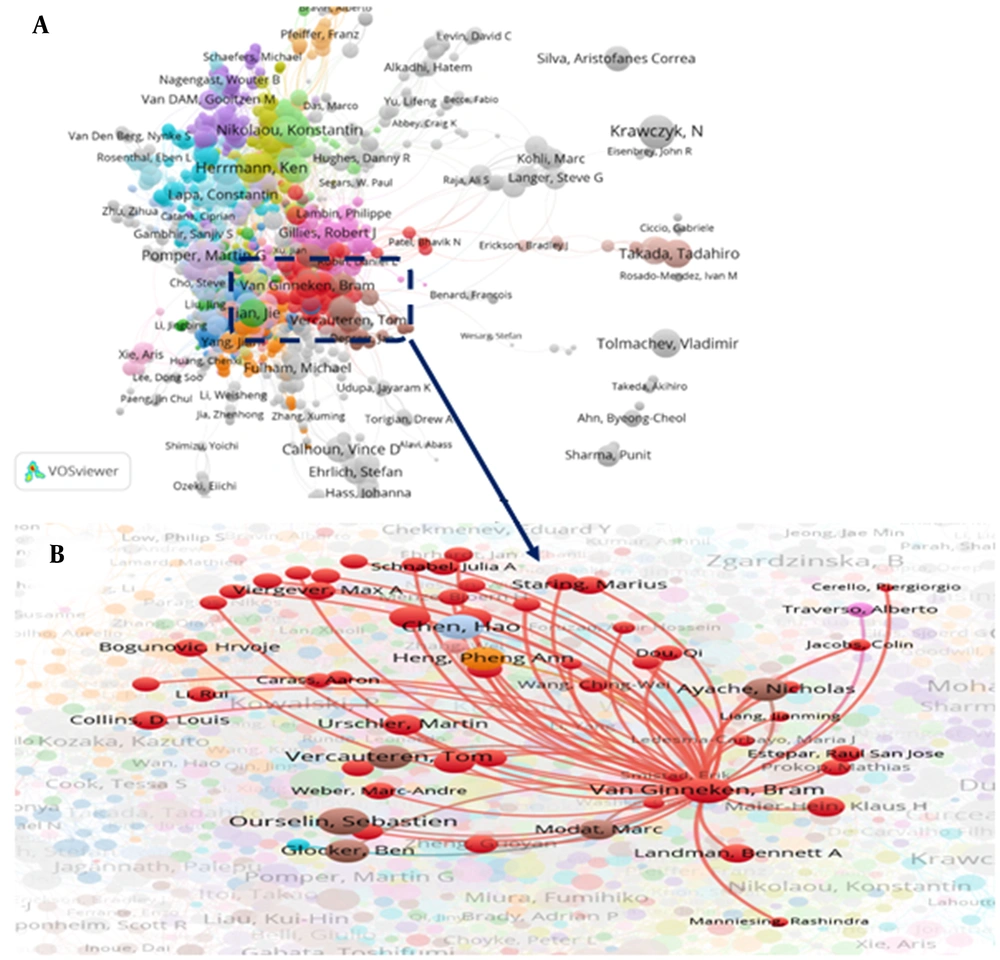
Figure 4.
Co-authorship network of articles in the field of medical images in the period of 2011 - 2020. A, Network overview; B, Collaboration view of “Van Ginnken, Bram” with the most links
The largest cluster shown in red consisted of 114 members in which “Van Ginneken, Bram” with 58 collaboration links and a total link strength of 85, “Arbel, Tal” with 47 collaboration links and a total link strength of 57, and “Urschler, Martin” with 46 collaboration links and 52 total link strength were the strongest members, respectively. The second cluster shown in dark green consisted of 92 members, in which “Tian, Jie” was the strongest member with 49 collaboration links and a total link strength of 106. “Zhang, Bin” with 22 links and a total link strength of 26 and “Liu, Jing” with 21 links and a link strength of 31 were in the next ranks. The third cluster shown in dark blue included 90 members, in which “Wang, Jing” with 36 links and a total link strength of 40, and “Chen, Xiaoyuan” with 30 links and a total link strength of 48 were ranked first and second in the cluster.
As shown in Table 1, the density of the co-authorship network in the period of 2001 - 2010 was 0.007, which was higher than the other 2 periods. Also, the average clustering coefficient in the period of 2001 - 2010 was 0.994, higher than the other 2 periods. The diameter of the network was 14 in the period of 1991 - 2000, 3 in the period of 2001 - 2010, and 18 in the period of 2011 - 2020. The average path length was 3.94 in the period of 1991 - 2000, 1.077 in the period of 2001 - 2010, and 5.385 in the period of 2011 - 2020. The modularity of the network in the period of 2011 - 2020 was 0.839 and it was lower than the other 2 periods.
Table 1.Macro Parameters of the Co-authorship Network in the Field of Medical Images in 3 Time Periods: 1991 - 2000, 2001 - 2010, and 2011 - 2020
| Parameters | Time Periods | ||
|---|---|---|---|
| 1991 - 2000 | 2001 - 2010 | 2011 - 2020 | |
| Nodes (authors) | 862 | 977 | 3169 |
| Edges (collaborations) | 1555 | 3436 | 14213 |
| Network density | 0.004 | 0.007 | 0.002 |
| Average clustering coefficient | 0.83 | 0.994 | 0.591 |
| Network diameter | 14 | 3 | 18 |
| Average path length | 3.94 | 1.077 | 5.385 |
| Average degree distribution | 1.804 | 3.517 | 4.483 |
| Modularity | 0.973 | 0.974 | 0.839 |
In the period of 1991 - 2000, the highest degree centrality in the co-authorship network belonged to “Dipaola, R.” with a value of 21. “Frouin, F.” with a degree centrality of 18, and “Panayiotakis, G. S.” with a degree centrality of 15 were in the second and third place, respectively. In the period of 2001 - 2010, a 25 members group of authors with a degree centrality of 24 had the highest value of degree centrality. In the period 2011 - 2020, “Van Ginneken, Bram” and “Herrmann, Ken” had the highest degree centrality with a score of 71. Also, “Ourselin, Sebastien” and “Tian, Jie” were in the second and third places with the degree centrality of 64 and 60, respectively.
The highest closeness centrality in the time periods of 1991 - 2000, 2001 - 2010, and 2011 - 2020 was equal to 1 in 46, 90, and 10 percent of the authors, respectively. In the period of 1991 - 2000, the highest betweenness centrality belonged to “Nishikawa, R. M.”, “Huang, H. K.” and “Abe, K.”, with values of 1278, 876, and 848, respectively. The highest betweenness centrality of authors in the period of 2001 - 2010 belonged to “Gelovani, Juri” with a value of 112, followed by “Wang, Min” and “Vanbrocklin, Henry” with values of 30 and 27, respectively. The highest betweenness centrality in the time period of 2011 - 2020, also belonged to “Tian, Jie”, “Kalpathy, Crame, Jayashree” and “Wang, Jing” with values of 136915, 132995.8 and 121075, respectively. The highest value of eigenvector centrality in the period of 1991 - 2000 belonged to “Dipaola, R.”, “Frouin, F.” and “Miron, M. C.” with values of 1, 0.9584 and 0.8261, respectively. The eigenvector centrality of 25 authors in the period of 2001 - 2010 was equal to 1. The most eigenvector centrality of authors in the period of 2011 - 2020 belonged to “Van Ginneken, Bram”, “Arbel, Tal” and “Sharp, Gregory”.
5. Discussion
The comparison of the authors’ collaboration pattern in 3 investigated time periods showed that the pattern has changed from 2 authors in the first decade to 3 authors in the middle decade and 4 authors in the last decade. Also, the collaboration patterns of 1 to 3 authors have decreased from the first to the third decades, while the collaboration patterns of 5 to 10 authors and more has increased. It seems that the other factors, including the increase in the professional, educational and research activities of authors and researchers, the need for numerous and extensive experiments, the time-consuming nature of studies, the multidisciplinary nature of the field, the desire to use experiences, the sharing of knowledge in research groups, and the lack of time can be considered effective in the tendency to multi-authorship among authors and researchers of medical images field. Various studies have reported results consistent with the present study, including Koseoglu increasing the 3, 4 and 5 author’s pattern (6), Heydari and Safavi tendency toward the four-author pattern in the field of medicine (31), Ansari et al. tendency towards the five-author pattern in the field of medicine (32), and Chow et al. reducing the two-to-four-author pattern and increasing the five-author pattern (18). The results of the study by Asadi et al. regarding the tendency towards the two-author and three-author pattern in the field of microelectronics science and technology (33), and Nishavathi and Jeyshankar on the presence of large fluctuations in the tendency towards 1 author and multiple authors in the field of chromosomal abnormality (9) are contrary to the present study.
The macro parameters of the co-authorship network indicated that the network density and clustering coefficient in the time period of 2001 - 2010 was higher than the two time periods. Also, the diameter and average path length of the network in the period of 2001 - 2010 was less than the other 2 periods. The network diameter has increased 6 times in the period of 2011 - 2020 compared to the previous decade. It seems that the increase in the diameter and average path length is due to the expansion of relationships between authors at the global level. An increase in average path length indicates the dispersion of relationships in the network (34).
The results of the study showed a significant increase in the degree centrality of authors in the third decade compared to the previous 2 decades, so that the degree centrality increased from 21 in the period of 1991 - 2000 to 71 in the period of 2020 - 2011. Considering that social networks expand as a result of adding new nodes and links, and based on the principle of preference, according to which new nodes are usually connected to older nodes with high degree centrality (35), it can be stated that authors with high degree centrality have played a significant role in expanding and evolution of the co-authorship network in the field of medical images.
Closeness centrality was 1 in 90 percent of authors in the time period of 2001 - 2010. In a co-authorship network, authors with high closeness centrality can communicate with other people in the network faster and receive better information. The betweenness centrality of authors in 2011 - 2020 had a significant increase compared to the previous 2 decades. The betweenness centrality in 75.4% of the authors was 0 indicating that they had no influence on the network. Previously, Ramazani et al. reported 0 betweenness centrality in 83.57% for authors of digital library studies (36).
The centrality parameters showed that in the period of 1991 - 2000, the most effective author in the co-authorship network in the field of medical images was “Dipaola, R.”, who obtained the highest degree centrality and eigenvector centrality values. “Nishikawa, R. M.” was the most influential author with the highest value of betweenness centrality. In the period of 2001 - 2010, “Gelovani, Juri G.” was the most influential author in the network with the highest value of betweenness centrality. A clear feature of the co-authorship network in this period was the presence of a large number of authors with equal parameters. It seems that the formation of cohesive research groups in this time period has caused this issue. In the time period of 2011 - 2020, “Tian, Jie” has been among the top 10 authors in terms of degree centrality and betweenness centrality.
5.1. Conclusions
According to the results of this study, the desire of researchers and authors in the field of medical images to form research groups and conducting the collaborative studies has increased over the past 3 decades. The existence of people with high centrality has strengthened the links between authors in the network. Dispersion in the co-authorship network researchers in the field of medical images is evident. It seems that the geographical dispersion of researchers is the main factor in increasing the diameter of the network and its dispersion, and the flow of knowledge in it does not have an optimal speed.
5.2. Suggestions
According to the results, it is suggested that other researches investigate the co-authorship network in specific areas of medical imaging, such as CT scan, radiology, etc. Also, the factors influencing the cooperation of researchers should be investigated.
