


1. Background
With the rapid changes and intense competition in various industries, corporate executives must continually monitor environmental factors and control the key influential factors in success by the analysis of the perimeter environment (1). Turbulence in the business environment leads to unpredictable changes, which give rise to new opportunities for gaining value, while imposing the burden of gaining competitive advantage on companies and leading to their disappearance in some cases (2). Today, the business environment is characterized by numerous challenges, including hypercompetition, uncertainty, high turbulence and dynamics, globalization of markets, and increased product and service innovations (3). If companies seek success in such environments, they must become more flexible in order to be able to manage the complex external environments in such difficult and sensitive economic situation (4). Furthermore, it is essential to recognize the influential factors in business environment turbulence, particularly the dynamics of the business environment.
Environmental dynamism should be restricted to the change that is hard to predict and heightens uncertainty for key organizational members (5). Companies must continuously review their routines and processes in order to survive and develop in turbulent and dynamic environments (6). In this regard, Davis et al. highlighted the importance of components such as turbulence, changing technology, competition between firms in the industry, and industry growth rate (7). On the other hand, Zahra and Bogner considered the three dimensions of dynamism, hostility, and heterogeneity to play a key role in business environmental turbulence (8).
Research regarding the dynamics of the business environment has revealed the sporadic factors that are involved in the business environment dynamism. Miller and Friesen developed a five-item scale for environmental dynamism (9), which has been adopted by several authors (10, 11). Furthermore, Achrol and Stern have developed a questionnaire with four items to describe the extent of changes/variability in the membership in electronic marketplaces, competitive behavior, customer behavior, and technical knowledge base (12). The questionnaire designed by Achrol and Stern has also been adopted by several researchers (13, 14), and some authors have proposed other items for the measurement of the degree of environmental dynamism (15, 16).
Small-sized enterprises are the main providers of new employment and innovation, playing a pivotal role in the economy of developing countries (17) As small enterprises (18), pharmacies are one of the main elements in the service delivery chain in the healthcare system of every country (19), as well as vital service centers for the community members and referring patients (20). In addition to service provision to various patients, pharmacies are an economic environment and business place, and the managers need to turn this environment into a profitable economic center as the proper economic turnover of pharmacies affects the provision of the required medicines to patients, thereby benefiting these individuals (21). Therefore, the recognition of the business environment of pharmacies could help in their management, as well as the improvement of their performance and profitability.
Although several studies have proposed some items for environmental dynamism, none has been able to provide a model for the business environmental dynamism in pharmacies. In addition, no research has been conducted in Iran to investigate the dynamics of the business environment and design a model and tool for this purpose. The existing gaps in the studies in this regard confirm the importance of our study. In today’s economy and given the importance of the national healthcare system, it is crucial to identify the influential factors in the business of pharmacies.
The main objective of the current research was to elaborate on a model for the dynamics of the business environment in Iranian pharmacies by addressing the following questions:
• What is an environmental dynamism model?
• What does the model consist of?
• How could the model be validated in pharmacies?
In order to answer the research questions, a literature review was performed regarding business environmental turbulence, business environmental dynamism, and small enterprises (i.e., pharmacies).
In the next section, the methodology of the research has been discussed, followed by the obtained results and their practical and scientific implications.
1.1. Literature Review
1.1.1. Business Environmental Turbulence
In recent years, environmental turbulence has urged companies to react quickly (1). A turbulent environment is an environment with a high degree of inter-period changes, which cause uncertainty and dynamism (22). A turbulent environment refers to the high levels of uncertainty, unpredictability, demand volatility, and changing growth conditions within an industry (23). The degree of change and complexity in a company environment and uncertainty in the environment are considered to be the examples of environmental turbulence (24). In this regard, Chung and Low described environmental turbulence as a certain level of turbulence or instability in the environment (25). Turbulence in the business environment refers to the situations where the existing information, knowledge, and experience are insufficient to allow decision-making or the prediction of the outcomes of the company’s performance in the future (26).
1.1.2. Business Environmental Dynamism
Environmental dynamism refers to the volatility and unpredictability of the external environment of a company (3). The dynamics of the environment indicate the extent and unpredictability of the changes in the industry (27). In addition, environmental dynamism could be defined based on the rate of industrial innovation associated with the unpredictability of the market (28). Environmental dynamism also refers to the rate of change and degree of variability of the environment (29). In other words, dynamic environments are an abundant source of ideas for the emergence of new opportunities. Some scholars have speculated about the positive correlation between the use of technology and degree of uncertainty in the business environment, and the dynamics of the environment have also been described as an influential factor in the adaptive innovation of business models in organizations (30). High environmental dynamics require the ability to respond to rapidly changing business conditions, which highlights the importance of the variables in the present study.
1.1.3. Small Enterprises (Pharmacies)
Recently, small- and medium-sized enterprises have been considered the major sources of employment in developed and developing countries. These companies play a key role in creating new jobs, innovation, flexibility, and economic growth (31). Since there are no universal global definitions for small- and medium-sized enterprises, many scholars have proposed various criteria in this regard, such as size, number of the employees, and turnover rate per year (31). In Iran, the definition of small- and medium-sized enterprises also varies in different organizations, and each organization and institution defines and classifies their enterprise based on their working requirements in terms of large-, small-, and medium-sized enterprises (32). In recent years, the pharmaceutical business has expanded significantly in terms of the provision of professional services and is now recognized as an important profession in the healthcare system (33).
2. Objectives
The present study aimed to assess the pharmacies in Kermanshah, Iran.
3. Methods
This study was performed using the explanatory sequential mixed method of the instrumental type (34). The mixed method is used if qualitative or quantitative methods alone cannot address an issue or when the researcher intends to explain a new phenomenon or test an emerging theory arising from the qualitative stage. In addition, the mixed method is often used when tools should be developed due to inadequacy (34).
Content analysis was used in the qualitative section of this study, and confirmatory factor analysis was employed in the quantitative section. Internet databases and scientific information banks were used as the sample population of the qualitative section during 2000 - 2020 in the field of environmental turbulence. For the comprehensive review of the valid documents in the area of the research subject, the scientific productions in the Scopus Citation Database were identified using keyword such as ‘environmental turbulence’, ‘environmental uncertainty’, ‘dynamic environment’, and ‘business environmental dynamism’. Through line-to-line study, the retrieved articles and resources were coded manually. Finally, 170 sources were identified, and after re-evaluation, 60 relevant resources were selected for the final analysis. The qualitative analysis resulted in the comprehensive dimension of environmental dynamism, which was identified with the two components of market turbulence and technological turbulence, as well as six sub-components.
In the quantitative section, a survey was conducted on 80 pharmacy owners, who were selected via random sampling from 185 pharmacies located in Kermanshah by conducting a researcher-made survey with 17 items. Based on content analysis and the extracted conceptual model, the validity of the research was evaluated under the supervision of experts. The multi-item constructs were scored based on a five-point Likert scale (totally agree = 1, totally disagree = 5). The components of market turbulence included market dynamics (items 1 and 2), market complexity (items 3 - 5), and market predictability (items 6 - 8). The components of technological turbulence included technological dynamics (items 9 and 10), technological complexity (items 11 - 14), and technological predictive capability (items 15 - 17). The validity of the questionnaire was assessed and confirmed by experts, and the reliability was evaluated using the Cronbach’s alpha.
Data analysis was performed in the SmartPLS3 software using confirmatory factor analysis. The questions with the most significant impact were identified by the confirmatory factor analysis, and the significance and severity of the effect of each component on the environmental dynamism was also determined. Finally, the model was assessed based on the goodness of fit (GOF).
4. Results
This section has been dedicated to the results of the content analysis process in two parts of coding and concept analysis. All the sources were initially reviewed, and relevant resources were identified through coding. Various contents from different articles were incoherent, and each source and reference was viewed from a different angle in regards to environmental turbulence. In the coding process, each article and resource was assessed, and considering the general concept, parts of the text of the sources that were explicitly or implicitly related to the code were selected.
Based on the significance of each concept, a title was designated to the concept in the text, and the concept was included in the explanation of the relevant source. Afterwards and with further text encodings, the files were constantly reviewed and examined to determine whether the specified part was related to any of the assigned dimensions or whether a new subject had to be determined. These dimensions were reviewed and changed several times during the research. The coding steps are presented in Table 1.
Table 1.Encoding Steps and Identifying the Environment Dynamics Dimension
| Dimensions | Component | Sub-Component | Open Coding |
|---|---|---|---|
| Environmental dynamism | Market turbulence | Market dynamics | Change in customer preferences, customer's desire to search for new products, customer offers, speed and frequency of customer preferences change |
| Market complexity | The existence of various factors affecting the business market, the relationship between the various factors and elements affecting the business market, customer attention to price, customer durability and loyalty, the impact of a business decision on many factors, the importance of delivery time of goods and services For the customer, the importance of delivery of goods and services to the customer | ||
| Market predictability | The ability to predict changes in customer preferences, the ability to predict market changes, information available to predict market changes, available information to predict the change in customer preferences, the existence of a certain trend in the market changes | ||
| Technological turbulence | Technological dynamics | The degree of technological change, the amount of opportunity created by technological change, the feasibility of new ideas through technological change, innovative technologies, speed and frequency of technological change | |
| Technological Complexity | The existence of several factors affecting technological change, the relationship between multiple factors and elements that affect technological change, the impact of a technological change on a large number of business factors | ||
| Technological predictability | The predictability of existing technology stability, the ability to predict new technology advances, available information to predict the state of the technology |
In the following section, parts of the content related to the component of market turbulence from the source text have been discussed.
Market turbulence reflects the rapid changes in the buyers’ preferences and encompasses a wide range of needs and demands, continuous entry and exit of the buyer through the market, and continuous emphasis on the provision of new products (35). Furthermore, market turbulence refers to the extent to which the competitive market conditions of a company are unpredictable and may change over time (32, 35). Market turbulence also refers to the extent and fluctuation in the customer mix, behaviors, and preferences (36). In addition, market turbulence involves the changes in structure-related marketing operations, and not only the dynamics of the market, but also the market uncertainty (37). As a result, there is the likelihood that the products and services offered by organizations may become incompatible with customers’ needs, thereby leading to the market competition that is caused by unstable markets. Market turbulence also leads to uncertain environments for organizational operations/activities and transformation strategies (38). Similarly, the contents regarding the technological turbulence component of the source text have been partly discussed in the following section.
Technological turbulence shows the level of technological change in an industry (39) and is defined as the degree of the changes associated with the product and process technology in an industry where an embedded company has also been defined (40). A rapidly changing technological environment is characterized by short product development cycles and fast technological obsolescence (41), which may create opportunities for companies to build superior competitive positions by changing or upgrading their products (42), while also creating challenges (43). In fact, technological turbulence leads to frequent alterations that urge companies to constantly keep up with and adapt to technological trends. Technological turbulence could be viewed as a threat to organizational operations as it is disruptive and creates unstable environments. As such, technological turbulence contributes to a sense of uncertainty (44). Figure 1 depicts the research model in the present study.
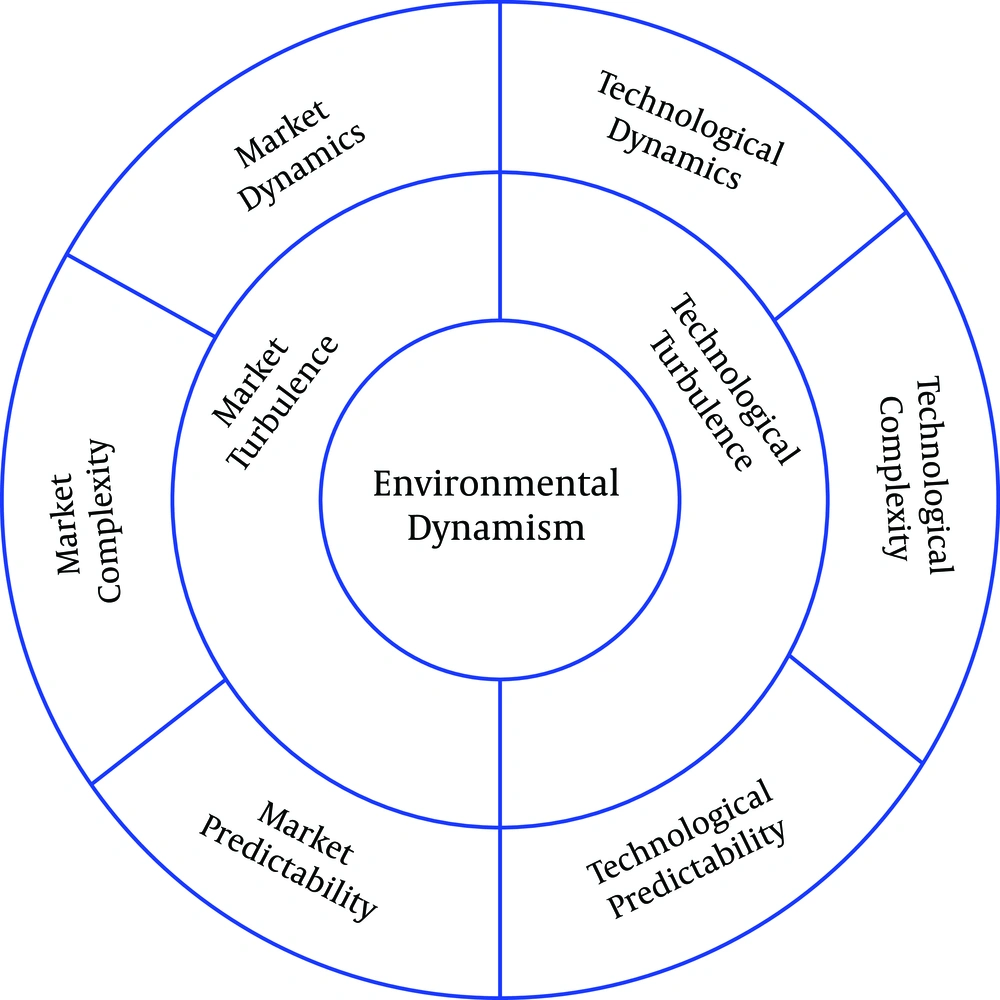
Figure 1.
Conceptual environmental dynamism in pharmacies
The evaluation of the modeling of environmental dynamism in Iranian pharmacies was performed in two stages using the Smart-PLS3 software. Initially, the validity and reliability of the model were evaluated, followed by the examination of the structural model. Based on the validity and reliability criteria, the accuracy of the correlations in the measurement models was ensured. In addition, the correlations the structural section and GOF of the research model were assessed (45).
The fit of measurement models is often determined based on the reliability and validity of the research structures. The Cronbach’s alpha is considered to be classic criterion for the measurement of reliability, which shows the correlations between a structure and the related indices. For the variables with a small number of questions, 0.7 is a reliable indicator of the alpha coefficient.
In addition to the Cronbach’s alpha, composite reliability (CR) was used in the present study to determine the reliability of each structure. The main advantage of the CR criterion over the Cronbach’s alpha coefficient is that the reliability of the structures is calculated in a non-absolute manner, but rather by the correlations between the structures. In the current research, the reliability of both criteria was used to measure the CR value, which was estimated to be above 0.7 for each structure, showing the intrinsic stability of the measurement models (46). The combined stability values for the research structures were calculated to be higher than 0.8.
After examining the reliability criterion, the second criterion is the average variance extracted (46), which showed the average shared variance between each construct with its indices and had to be higher than 0.5. Table 2 shows the general criteria for the quality of the model. Accordingly, the values of each variable were defined to be above the threshold. Therefore, the appropriateness of the convergent validity and reliability status of the research model were confirmed.
Table 2.General Criteria of the Model’s Quality
| Variables | AVE | CR | Cronbach’s alpha |
|---|---|---|---|
| Dynamism | 0.51 | 0.94 | 0.93 |
| Market turbulence | 0.58 | 0.95 | 0.89 |
| Market dynamics | 0.96 | 0.98 | 0.96 |
| Market complexity | 0.87 | 0.95 | 0.93 |
| Market predictability | 0.95 | 0.98 | 0.97 |
| Technological turbulence | 0.69 | 0.95 | 0.94 |
| Technological dynamics | 0.97 | 0.98 | 0.97 |
| Technological complexity | 0.92 | 0.98 | 0.97 |
| Technological predictability | 0.94 | 0.98 | 0.96 |
Table 3 shows the value of the load factors and t-values for each item. According to the results of the SmartPLS3 software output, since the values of the load factor magnitude of the observed variables and corresponding variable were appropriate, the perceived framework of environmental dynamism could be deduced, and a significant correlation and validity were observed between the items and sub-components.
Table 3.Factor Load Values and t-Value for Each Question
| Structure | Items | Load Factor | t-Value | Significance Level | Result |
|---|---|---|---|---|---|
| Market dynamics | Pub1 | 0.98 | 158.531 | 0.001 | Confirm Indicator |
| Pub2 | 0.98 | 147.516 | 0.001 | Confirm Indicator | |
| Market complexity | Pib1 | 0.90 | 36.716 | 0.001 | Confirm Indicator |
| Pib2 | 0.95 | 77.169 | 0.001 | Confirm Indicator | |
| Pib3 | 0.95 | 89.362 | 0.001 | Confirm Indicator | |
| Market predictability | Gpb1 | 0.97 | 130.298 | 0.001 | Confirm Indicator |
| Gpb2 | 0.97 | 113.281 | 0.001 | Confirm Indicator | |
| Gpb3 | 0.98 | 247.381 | 0.001 | Confirm Indicator | |
| Technological dynamics | Put1 | 0.98 | 121.044 | 0.001 | Confirm Indicator |
| Put2 | 0.98 | 143.041 | 0.001 | Confirm Indicator | |
| Technological complexity | Pit1 | 0.97 | 87.809 | 0.001 | Confirm Indicator |
| Pit2 | 0.98 | 159.967 | 0.001 | Confirm Indicator | |
| Pit3 | 0.97 | 115.163 | 0.001 | Confirm Indicator | |
| Pit4 | 0.91 | 31.744 | 0.001 | Confirm Indicator | |
| Technological predictability | Gpt1 | 0.96 | 134.063 | 0.001 | Confirm Indicator |
| Gpt2 | 0.98 | 235.086 | 0.001 | Confirm Indicator | |
| Gpt3 | 0.96 | 78.814 | 0.001 | Confirm Indicator |
Table 4 shows the results of the confirmatory factor analysis regarding the sub-components of the business environmental dynamism model.
Table 4.Factor Load Values, t-Values and R Square Values of Sub-Components
| Variable | Indicator | Load Factor | t-Value | R2 |
|---|---|---|---|---|
| Market turbulence | Market dynamics | 0.85 | 25.85 | 0.72 |
| Market complexity | 0.79 | 18.82 | 0.63 | |
| Market predictability | 0.74 | 11.06 | 0.55 | |
| Technological turbulence | Technological dynamics | 0.94 | 63.05 | 0.88 |
| Technological complexity | 0.92 | 69.00 | 0.84 | |
| Technological predictability | 0.69 | 6.10 | 0.48 |
Table 5 shows the results of the confirmatory factor analysis regarding the components of the business environmental dynamism model.
Table 5.Factor Load Values, t-Values and R Square Values of Components
| Variable | Indicator | Load Factor | t-Value | R2 |
|---|---|---|---|---|
| Environmental dynamism | Market turbulence | 0.85 | 39.12 | 0.73 |
| Technological turbulence | 0.92 | 65.47 | 0.85 |
To evaluate the fit of the structural model, several criteria were used, the most fundamental of which was the t-value. The correlation between the structures was estimated at 95% confidence level, which indicated the t-values to be higher than 1.96. Figure 2 depicts the confirmatory factor analysis of the model, and the values have also been presented to assess the structural part of the model. Considering that the values on the paths were higher than 1.96, the paths were considered significant, which confirmed the appropriateness of the research structural model.
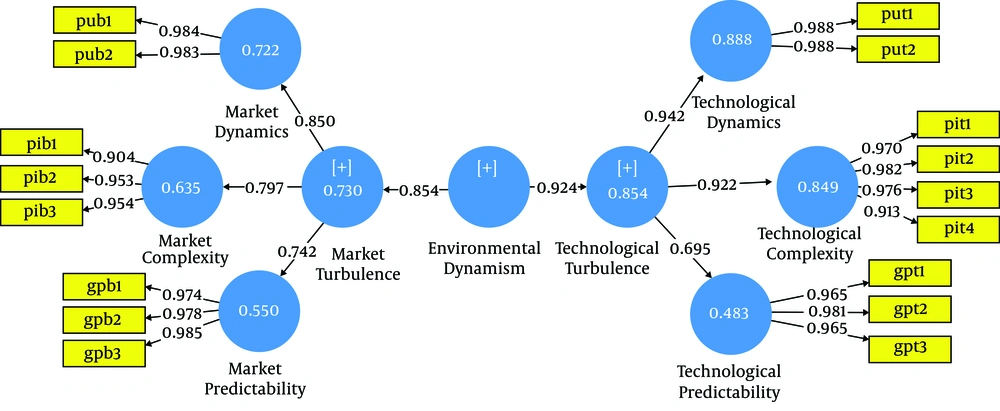
Figure 2.
Final research model
In the present study, the GOF was used to evaluate the fit of the model in the partial least squares, and the value was estimated at 0.76, indicating an upper general fit for the structural model.
5. Discussion
The present study aimed to elaborate on a new model for the business environmental dynamism in Iranian pharmacies, and several principal findings were obtained. Accordingly, the dynamics of the business environment could be summarized in the two components of market turbulence and technological turbulence. Market turbulence had three sub-components, including market dynamics, market complexity, and market predictability. Market dynamics refers to the intensity and speed of the changes in the customer and market preferences. Market complexity refers to the number of the elements affecting the market and their correlations. Market predictability refers to the information availability and predictability of the costumer and market preference changes.
Similarly, technological turbulence had three sub-components, including technological dynamics, technological complexity, and technological predictability. Technological dynamics refers to the intensity and speed of technological changes. Technological complexity refers to the number of the elements affecting technology and their correlations. Technological predictability refers to the information access and predictability of future technological changes and stability of the current technology. These findings are consistent with several studies in this regard (9, 12, 15, 16).
According to the findings of the current research, the sub-component of technological dynamics had the most significant impact on the technological turbulence of pharmacies, which indicated the intensity of technological changes. Furthermore, the sub-component of market dynamics had the most significant impact on the market turbulence in pharmacies, indicating the intensity and speed of the changes in the customer and market preferences. Therefore, pharmacy managers could improve business performance by properly identifying and analyzing the business environment, which requires sufficient time and knowledge, as well as the ability to identify the related issues thoroughly and accurately. The appropriate environmental strategy in this regard is not a one-size-fits-all answer, and some suggestions could be proposed to manage a dynamic environment.
First and foremost, dynamic capabilities enhance the effectiveness of routine operations with high levels of environmental dynamism (47). In addition, managers should not ‘put all their eggs in one basket’ when market turbulence arises. During times of market turbulence, internationalization should be regarded as a risk reduction strategy (48).
Market turbulence helps pharmacies to learn about changes through frequent measurements; they must also identify their marketing preferences and technical capabilities. Therefore, the companies that are in a volatile market, as opposed to sustainable markets, should benefit from frequent measurements and re-engineering activities to match their technology efficiency and capabilities by anticipating the changes in the customer needs.
Similarly, the pharmacies that are competing in industries with intense technological turbulence require efficient methods in this regard. First, team leaders should help members develop a shared understanding on the rate of the changes in the technological environment and challenges involved through conducting regular team training workshops to develop the habits of scanning the external environment and identifying the cues that are of potential significance to the survival and growth of the team. Second, the leaders must facilitate power alignment processes, encourage the team members to reduce dependence on the established team experts, and seek new knowledge from external sources in the face of high technological turbulence. To this end, the leaders should encourage all the team members to develop critical and independent thinking and participate in decision-making, while supporting the team members who possess relevant and updated knowledge and information to take charge. Finally, the leaders should create a highly autonomous and empowering work environment to facilitate proactive behaviors from team members that are conducive to power redistribution, while also providing support and resources when the team members seek advice and help. Once an autonomous climate is established, knowledge-worker teams will be able to efficiently manage their processes to meet the challenges imposed by the external environment (49).
In a business environment with a high degree of technological turbulence, pharmacies must continue to evolve their business practices to increase relevance as healthcare experts in a highly connected technological environment. The use of social media has surged in recent years, and the ubiquity of applications provides an ample opportunity for independent pharmacies to advertise their goods and services and increase their ability to promote health care for the public. Similar to other form of marketing, pharmacists must realize the strategies that lead to higher reach and end-user engagement. Use of photos, videos, humor, emotions, and education is commonly associated with greater online interactions with patients. When used effectively, social media has been shown to enhance business and patient connections and promote health care for the public, thereby yielding positive returns for pharmacies (50).
Undoubtedly, the ability of companies to compete with each other has become entangled with entrepreneurship and the belief that innovative ideas are the only way to sustain any company or business in the market, pushing them to work on this key influential factor in success (51). Consequently, using new methods of innovation (e.g., business model innovations), pharmacies could improve their performance in a dynamic business environment.
The main limitation of the current research was to access to the owners and managers of the pharmacies for enrollment in the survey.
5.1. Conclusion
The present study aimed to identify and designate the dimensions of business environmental dynamism using a qualitative and quantitative approach and the content analysis strategy to provide an appropriate conceptual framework for this issue. Previous studies have investigated some components of environmental turbulence and environmental dynamism, with each study identifying the influential factors in the dynamics of the environment separately.
According to the results of the present study, the dynamics of the business environment were summarized in the two components of market turbulence and technological turbulence. Market turbulence had three sub-components, including market dynamics, market complexity, and market predictability. Technological turbulence also had three sub-components, including technological dynamics, technological complexity, and technological predictability. The sub-component of technological dynamics had the most significant impact on the technological turbulence of the pharmacies, while the sub-component of market dynamics had the most significant impact on the market turbulence in the pharmacies. Therefore, a pharmacy manager must have a proper understanding of the business environment, as well as the ability to identify his business environment before deciding the style and strategy of the company.
