
1. Background
The field of medical research ethics has gained substantial attention in recent years as a central topic in modern bioethics. As scientific and technological advances continue to push the boundaries of medical research, ethical considerations related to human subject research have become increasingly complex and critical (1-4). Research ethics committees (RECs) have been established worldwide to support the appropriate implementation of ethical principles and standards in research, with the primary goal of protecting research participants while facilitating the advancement of scientific knowledge (5, 6). In medical research, ethical considerations are essential for safeguarding the rights, safety, and well-being of human subjects. However, the dynamic nature of medical advances often introduces new ethical challenges, underscoring the need for ongoing education and awareness (7).
The Declaration of Helsinki established ethical guidelines for medical research involving human subjects and replaced the Nuremberg Code; it is considered the primary international standard for ethical research involving humans (8). The World Health Organization (WHO) and the Council for International Organizations of Medical Sciences (CIOMS) further elaborated on its principles (9, 10). There is growing recognition of the importance of research ethics and the need for robust ethical review processes in developing countries (11). The Iranian National Committee for Ethics in Biomedical Research has played a pivotal role in developing guidelines and regulations for ethical research conduct (12). However, despite these efforts, there remains a substantial need for specialized training and education for ethics committee members and researchers.
As medical research advances, those involved in its oversight and conduct must be adequately prepared to address these challenges (13, 14). The effectiveness of ethics education for health professionals is critical for ensuring the ethical conduct of research (15, 16).
Recent studies have demonstrated the positive impact of ethics education on the knowledge, attitudes, and behaviors of health professionals. For example, Browman et al. (17) reported that short-term training programs in research ethics significantly improve the responsible and ethical conduct of clinical trials and medical research among faculty members and trainees. Similarly, Chongwe et al. (18) highlighted the critical need for structured ethics instruction to prepare faculty members and students for ethical challenges in clinical research and medical practice. These findings align with the objective of the present study, which was to assess how an ethics workshop influences awareness of research ethics principles among faculty members and health professionals.
2. Objectives
In this study, knowledge refers to factual information and an understanding of the basic principles related to research ethics, whereas awareness denotes broader conscious recognition of and sensitivity to ethical issues and principles. Knowledge represents what participants explicitly know, whereas awareness reflects their conscious acknowledgement of and attentiveness to ethical concepts in research contexts. Accordingly, this study evaluated the impact of an educational intervention on knowledge and awareness of the general principles of research ethics, particularly those relevant to human intervention studies, among faculty members and health professionals at Guilan University of Medical Sciences, Rasht, Iran. The importance of this research is underscored by evidence that many ethics committees in Iran lack specific programs for initial training and necessary retraining of their members. This educational gap can lead to inconsistencies in ethical review processes and may compromise the protection of research participants.
3. Methods
3.1. Study Design and Participants
This quasi-experimental study included faculty members and health professionals at Guilan University of Medical Sciences, Rasht, Iran, in 2022. All individuals provided written consent to participate in the study. The study was approved by the Ethics Committee of Guilan University of Medical Sciences, Rasht, Iran (IR.GUMS.REC.1401.097).
3.2. Sampling and Eligibility Criteria
Sampling was performed using a convenience method. The sample size was calculated using the following formula, assuming an estimated proportion (p) of 0.5, a margin of error (d) of 0.15, a 95% confidence level (Z₁₋α/₂ = 1.96), and accounting for a potential 20% dropout rate.
The inclusion criteria were being a faculty member or health professional, being affiliated with Guilan University of Medical Sciences, being employed in Rasht, Iran, and being willing to provide written consent to participate. The exclusion criteria were inability to complete the questionnaire due to language barriers or cognitive impairments, inability to attend the full 8-hour workshop, and severe concurrent illnesses that might affect participation or concentration during the workshop.
3.3. Data Collection and Educational Intervention
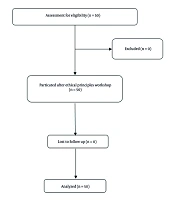
Using a convenience sampling method, 35 participants were enrolled in the study. Participants’ age, gender, marital status, academic degree, employment status, and history of ethics workshop attendance were recorded. Participants’ awareness of ethical principles related to human interventions was assessed before and after the 8-hour workshop, General Principles of Ethics in Research (Human Interventions), using a self-designed questionnaire. The workshop covered concepts, definitions, types of human interventions, and ethical principles in human intervention research.
The questionnaire included 16 multiple-choice questions on the following topics: research objectives, prioritization of participant safety, researcher qualifications, risk and harm minimization, preliminary measures, research termination, criteria for initiating research, informed consent requirements, form of informed consent, reporting changes to the ethics committee, ensuring voluntary consent, consent for the use of biological materials/data, impact on medical services, vulnerable groups, alignment with social, cultural, and religious values, and research objectives. The final questionnaire contained 16 questions. Participants selected the correct option for each question. Each correct answer was scored as 1, and each incorrect answer was scored as 0. The highest possible score was 16, and the lowest possible score was 0. The content validity ratio (CVR) for each question was calculated as 0.88 based on responses, and questions with coefficients below 0.7 were removed. After assessment of relevance, clarity, and acceptability, all questions had a content validity index (CVI) above 0.8, and the overall CVI was 0.931. Questionnaire reliability was assessed using Cronbach’s alpha as 0.83.
3.4. Statistical Analysis
Statistical data were reported as numbers (percentages) and mean ± standard deviation (SD). The normality of the key outcome variable (knowledge scores) was assessed using the Shapiro-Wilk test. The results indicated no significant deviation from normality (P > 0.05). In addition, graphical methods, including Q-Q plots and histograms, supported the assumption of an approximately normal distribution. Therefore, parametric tests, such as the paired t-test and ANOVA, were used where appropriate. All data were analyzed using SPSS version 26, and the significance level was set at 0.05 for all tests.
4. Results
The mean age of the participants was 42.91 ± 8.57 years (range, 28 - 69 years). Most participants were aged ≤ 40 years (51.4%) and were male (51.4%). Most participants were married (65.7%) and were assistant professors (60.0%). Regarding employment status, the largest group had contractual appointments (45.7%), followed by permanent positions (37.1%). Overall, 82.9% of the participants had previously attended research ethics workshops (Table 1).
Table 1.
Demographic Characteristics of Participants
| Variables | No (%) |
|---|---|
| Age (y) | |
| ≤ 40 | 18 (51.4) |
| > 40 | 17 (48.6) |
| Gender | |
| Male | 18 (51.4) |
| Female | 17 (48.6) |
| Marital status | |
| Single | 12 (34.3) |
| Married | 23 (65.7) |
| Academic degree | |
| Assistant professor | 21 (60.0) |
| Associate professor | 13 (37.1) |
| Professor | 1 (2.9) |
| Occupation status | |
| Permanent | 13 (37.1) |
| Permanent-probationary | 1 (2.9) |
| Contractual | 16 (45.7) |
| Service Commitment Scheme | 5 (14.3) |
| Previously attended a research ethics workshop | |
| Yes | 29 (82.9) |
| No | 6 (17.1) |
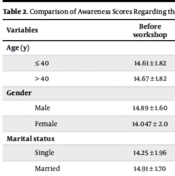
Table 2 compares participants' awareness scores regarding the basic principles of research ethics in the medical field before and after the workshop. Using the Wilcoxon signed-rank test, all pre-post comparisons showed significant improvements (P value < 0.05), except in the Service Commitment Scheme group (P = 0.317), in which the improvement was not statistically significant. Using the Mann-Whitney U test and ANOVA, none of the between-group comparisons reached statistical significance (P value > 0.05), indicating that the degree of improvement did not differ significantly across these categories (Table 2).
Table 2.
Comparison of Awareness Scores Regarding the Basic Principles of Research Ethics in the Medical Field Before and After the Workshop (N = 35) a
| Variables | Before workshop | After workshop | Within-group statistic | Within-group P-value | Mean difference ± SD | Between-group statistic | P-value |
|---|---|---|---|---|---|---|---|
| Age (y) | |||||||
| ≤ 40 | 14.61 ± 1.82 | 15.67 ± 0.84 | 2.87 b | 0.004 b | 1.05 ± 1.43 | 0.32 c | 0.747 c |
| > 40 | 14.67 ± 1.82 | 16 ± 0.0 | 2.39 b | 0.017 b | 1.23 ± 1.82 | 0.32 c | 0.747 c |
| Gender | |||||||
| Male | 14.89 ± 1.60 | 15.83 ± 0.71 | 2.75 b | 0.006 b | 0.94 ± 1.43 | 0.34 c | 0.734 c |
| Female | 14.047 ± 2.0 | 15.82 ± 0.53 | 2.54 b | 0.011 b | 1.35 ± 1.80 | 0.34 c | 0.734 c |
| Marital status | |||||||
| Single | 14.25 ± 1.96 | 15.67 ± 0.89 | 2.40 b | 0.016 b | 1.42 ± 1.68 | 0.81 c | 0.418 c |
| Married | 14.91 ± 1.70 | 15.91 ± 0.42 | 2.84 b | 0.004 b | 1.0 ± 1.59 | 0.81 c | 0.418 c |
| Academic degree | |||||||
| Assistant professor | 14.52 ± 1.94 | 15.71 ± 0.78 | 2.83 b | 0.005 b | 1.19 ± 1.66 | 0.13 c | 0.894 c |
| Associate professor | 14.85 ± 1.62 | 16 ± 0.0 | 2.41 b | 0.016 b | 1.15 ± 1.62 | 0.13 c | 0.894 c |
| Occupation status | |||||||
| Permanent | 14.61 ± 1.80 | 16 ± 0.0 | 2.39 d | 0.017 d | 1.38 ± 1.80 | 0.68 d | 0.513 d |
| Permanent-probationary | 14.50 ± 1.90 | 15.75 ± 0.77 | 2.72 d | 0.007 d | 1.25 ± 1.65 | 0.68 d | 0.513 d |
| Service Commitment Scheme | 15.20 ± 1.79 | 15.60 ± 0.89 | 1.00 d | 0.317 d | 0.40 ± 0.89 | 0.68 d | 0.513 d |
a Values are expressed as mean ± SD.
b Wilcoxon signed-rank test.
c Mann-Whitney U test.
d ANOVA test.
5. Discussion
Adherence to ethical and legal standards in medical research and clinical trials leads to improved quality of patient treatment, reduced intervention-related adverse events, enhanced scientific quality of published articles, and increased generalizability of study findings to the general population (19-21). Given that organizing clinical trial workshops is an annual responsibility of the research and education departments of medical universities, assessing the impact of these workshops is highly important. The findings of the present study suggested that the research ethics workshop effectively enhanced participants' awareness regardless of their demographic characteristics or professional background, highlighting the broad impact of the educational intervention.
A study by Browman et al. in India underscored the importance of introducing ethics training at the postgraduate level and in the undergraduate medical curriculum. They reported that even a short-term research ethics training program could effectively enhance the responsible and ethical conduct of clinical trials and medical research among faculty members and trainees (17). Chongwe et al. emphasized that although many faculty members felt prepared to assist students with research methodology, only a minority felt equipped to address ethical considerations in research. This disparity highlighted a critical need for mandatory and structured instruction in research ethics for faculty members and students to better prepare them for the ethical challenges they may face in their professional careers (18). Education and oversight are considered two crucial elements for improving research ethics. Studies have shown that although awareness of ethical guidelines can enhance ethical sensitivity in practice, other factors also influence individuals' commitment to these standards. The social environment, regulatory bodies, and the presence of ethical oversight committees play key roles in organizing and enforcing ethical research practices.
5.1. Limitations
This study has several important limitations that should be acknowledged. First, a pronounced ceiling effect was observed in the post-test scores, particularly among the older age group (> 40 years) and associate professors, for whom participants achieved perfect scores with zero variance. This limited the sensitivity to detect further knowledge gains and violated the assumptions of parametric tests such as ANOVA. Second, most participants (82.9%) had previous ethics workshop experience, constituting a significant confounding factor that likely elevated baseline knowledge and may have limited the observed improvement to a refresher effect. Third, the study design lacked blinding, exposing it to potential recall bias and social desirability bias among participants, as well as possible bias during data analysis. Fourth, the sample size was relatively small and underpowered, which may increase the risk of type II errors and limit generalizability. Finally, the evaluation metric focused solely on immediate knowledge retention measured using a self-designed multiple-choice questionnaire. Although the questionnaire demonstrated good psychometric properties, it cannot capture deeper ethical reasoning, applied competence, or behavioral change. These limitations should be considered when interpreting the findings, and future research should address these issues through more rigorous designs, larger and more diverse samples, improved measurement tools, and longer-term follow-up to assess ethical competence beyond knowledge.
5.2. Conclusions
The results showed a significant difference between the mean awareness scores before and after the workshop, with the mean awareness score increasing significantly after the workshop.