


1. Background
Postoperative pain following cesarean sections poses a significant challenge, as effective analgesia is essential for facilitating breastfeeding, enhancing maternal satisfaction, and promoting early recovery. Inadequate pain control can trigger neuroendocrine responses, potentially leading to central sensitization and chronic pain (1, 2). Traditional analgesics, such as opioids and non-steroidal anti-inflammatory drugs (NSAIDs), carry risks of maternal and fetal side effects, including respiratory depression, gastrointestinal distress, and hypotension, which may impair recovery and infant bonding (3, 4). Recent evidence suggests that multimodal approaches, incorporating neuropeptides like oxytocin, may offer safer alternatives by modulating pain pathways with fewer side effects (3, 5-8). For instance, systematic reviews indicate oxytocin’s potential in reducing pain sensitivity in chronic conditions, though results remain mixed for acute postoperative settings (5, 6).
Oxytocin, a neuropeptide traditionally used to manage postpartum hemorrhage, has shown promise as an analgesic in various contexts due to its potential to modulate pain perception with minimal side effects (9-11). However, evidence on its efficacy for postoperative pain remains mixed, with some studies reporting no significant analgesic benefit from intranasal oxytocin in chronic pain syndromes (12). Recent research highlights oxytocin’s involvement in anti-nociceptive and anti-inflammatory pathways, potentially through activation of descending pain inhibitory systems and inhibition of mast cell degranulation (7, 8). Clinical trials post-2020, including those on intranasal oxytocin for chronic pelvic pain, suggest sex-specific effects and context-dependent analgesia, warranting further exploration in obstetric settings (3).
2. Objectives
The present study aimed to assess the analgesic effects of continuous low-dose oxytocin infusion in women undergoing cesarean sections under spinal anesthesia. We hypothesized that oxytocin infusion would reduce postoperative pain severity and analgesic requirements without significant adverse effects (13).
3. Methods
3.1. Trial Design
This was a single-center, parallel-group, randomized, double-blind, placebo-controlled trial with a 1:1 allocation ratio, conducted at Kowsar Hospital, Qazvin, Iran, from December 2021 to March 2022. No major changes to the trial design occurred after commencement. The study adhered to the CONSORT 2010 guidelines (Schulz KF, Altman DG, Moher D, for the CONSORT group. CONSORT 2010 statement: Updated guidelines for reporting parallel group randomized trials).
3.2. Participants
Eligible participants were women aged 18 - 40 years scheduled for elective cesarean sections under spinal anesthesia. Exclusion criteria included significant coexisting conditions (hepatorenal or cardiovascular diseases, psychotic disorders), long-term use of antidepressants or analgesics, chronic headache, contraindications to spinal anesthesia (e.g., local infection, bleeding disorders), and risk factors for increased postpartum bleeding (e.g., multiple gestations, polyhydramnios, placenta previa, uterine rupture). Written informed consent was obtained from all participants. The trial was approved by the Institutional Ethics Committee of Qazvin University of Medical Sciences (IR.QUMS.REC.1399.496) and registered with the Iranian Clinical Trial Registry (IRCT20190905044705N1).
3.3. Interventions
All participants received spinal anesthesia with 2.5 cc of 0.5% bupivacaine hydrochloride (20 mg/4 mL, Mylan, France) via a 25-gauge needle at the L4-L5 intervertebral space, achieving a sensory level up to T6. Pre-anesthesia, 500 cc of Ringer’s lactate was administered. Post-placental delivery, both groups received 20 units of oxytocin (10 units/mL, Caspian Tamim Pharmaceutical Company) in normal saline over 10 minutes to control bleeding. The intervention group received an additional 10 units of oxytocin per liter of normal saline every 8 hours (totaling 30 units over 24 hours), while the control group received a placebo (normal saline) infusion. Syringes were labeled A or B to ensure blinding. Additional uterotonics (methylergonovine 0.2 mg or misoprostol 200 mcg suppository) were administered if needed. Analgesics (100 mg diclofenac suppository for NRS > 4, followed by 30 mg intravenous ketorolac for breakthrough pain) were provided upon patient request.
3.4. Outcomes
1. Primary outcomes: Pain severity (NRS, 0 - 10) and frequency of analgesic requests within 24 hours post-surgery.
2. Secondary outcomes: Hemodynamic parameters [heart rate (HR), systolic blood pressure (SBP), diastolic blood pressure (DBP)], hemoglobin levels, blood loss, and adverse effects (nausea, vomiting, headache). Assessments occurred at baseline, 10 and 30 minutes post-anesthesia, and every 6 hours postoperatively. Pain was evaluated using the NRS and Visual Analog Scale (VAS) by blinded assessors.
3.5. Sample Size
The sample size was calculated to detect a clinically meaningful reduction in analgesic requests (effect size 0.5) with 80% power and an alpha of 0.05. Based on pilot data indicating higher-than-expected variability, 110 participants (55 per group) were targeted to account for potential dropouts and ensure adequate power for subgroup analyses.
3.6. Randomization
1. Sequence generation: A computerized random number table generated the allocation sequence.
2. Allocation concealment: Opaque, sealed envelopes were used to conceal the sequence until assignment.
3. Implementation: An independent statistician generated the sequence, research nurses enrolled participants, and an anesthesiologist assigned interventions.
4. Blinding: Patients, care providers, and outcome assessors were blinded to group assignments. Syringes were identically labeled, and placebo infusions matched the intervention in appearance and volume.
3.7. Statistical Methods
Categorical variables (e.g., analgesic requests, adverse effects) were expressed as counts/percentages and analyzed using chi-square or Fisher’s exact tests. Quantitative variables were assessed for normality using the Kolmogorov-Smirnov test. Parametric data (e.g., HR, SBP) were reported as mean ± SD and compared using the Student’s t-test; nonparametric data (e.g., surgery duration, blood loss) were reported as median (interquartile range) and analyzed using the Mann-Whitney test. Significance was set at P < 0.05. Analyses were conducted using SPSS v27.0 (SPSS Inc., Chicago, IL, USA). No interim analyses or stopping guidelines were applied.
4. Results
4.1. Participant Flow
Of 160 assessed patients, 50 were excluded (e.g., chronic pain, opioid use, bleeding disorders, refusal to consent). A total of 110 participants were randomized (55 per group). Seven control group participants were excluded (3 logistical issues, 4 protocol violations), resulting in 103 analyzed (55 intervention, 48 control; Figure 1).
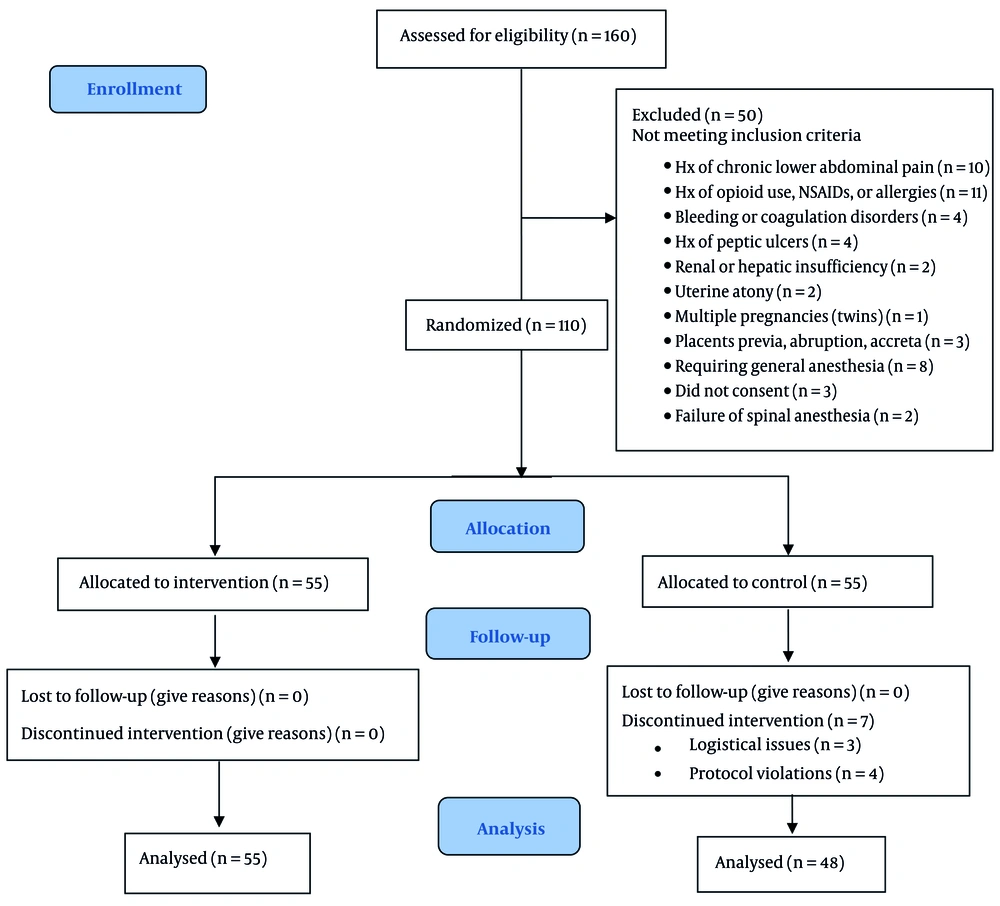
Figure 1.
CONSORT flow diagram
4.2. Baseline Data
No significant differences were observed between groups in age (28.44 ± 7.45 vs. 28.73 ± 5.77 years, P = 0.826), BMI (22.90 ± 3.63 vs. 23.62 ± 2.84 kg/m2, P = 0.272), education level (P = 0.207), gestational age (P = 0.754), or cesarean section history (P = 0.864) (Table 1). Preoperative clinical data (HR, SBP, DBP, hemoglobin) and intraoperative variables (surgery duration, blood loss, ephedrine, atropine, methylergonovine use) were also comparable (Table 2).
Table 1.Comparison of General Information of Patients Undergoing Cesarean Section a
| Variables | Groups | P-Value | |
|---|---|---|---|
| Intervention | Control | ||
| Age (y) | 28.44 ± 7.45 | 28.73 ± 5.77 | 0.826 |
| BMI (Kg/m2) | 22.90 ± 3.63 | 23.62 ± 2.84 | 0.272 |
| Level of education | 0.207 | ||
| Uneducated | 4 (7.3) | 2 (4.2) | |
| Under diploma | 29 (52.7) | 22 (45.8) | |
| Diploma | 19 (34.5) | 19 (39.6) | |
| Higher than diploma | 3 (5.5) | 5 (10.4) | |
| Gestational age (wk) | 0.754 | ||
| 34 - 36 | 10 (18.2) | 6 (12.5) | |
| 37 - 40 | 39 (70.9) | 38 (79.2) | |
| > 40 | 6 (10.9) | 4 (8.3) | |
| Caesarian section time | 0.864 | ||
| One | 23 (41.8) | 18 (37.5) | |
| Two | 25 (45.5) | 27 (56.3) | |
| Three | 7 (12.7) | 3 (6.3) | |
a Values are expressed as No. (%) or mean ± SD.
Table 2.Comparison of Clinical Data of Patients Undergoing Cesarean Section: Pre-surgery Assessment and Medications Used During Surgery a
| Variables | Groups | P-Value | |
|---|---|---|---|
| Intervention | Control | ||
| SBP (mmHg) | 128 ± 13 | 125 ± 11 | 0.150 b |
| DBP (mmHg) | 82 ± 10 | 79 ± 10 | 0.086 b |
| HR (beats/min) | 90 ± 12 | 89 ± 15 | 0.718 b |
| HB (g/dL) | 12.1 ± 1.0 | 12.2 ± 1.2 | 0.638 b |
| Surgery duration (min) | 50 (40 - 65) | 53 (40 - 60) | 0.440 c |
| Blood loss volume (mL) | 500 (300 - 800) | 450 (340 - 700) | 0.598 c |
| Fluid prescribed during surgery (mL) | 2000 (2000 - 2500) | 2000 (2000 - 2500) | 0.583 c |
| Ephedrine | 0.677 d | ||
| No ephedrine use | 30 (54.5) | 27 (56.3) | |
| 5 to 10 mg | 17 (30.9) | 16 (33.3) | |
| 15 to 20 | 8 (14.5) | 5 (10.4) | |
| Atropine used (n) | 0.175 e | ||
| Positive | 53 (96.4) | 43 (89.6) | |
| Negative | 2 (3.6) | 5 (10.4) | |
| Methergine used (n) | 0.840 e | ||
| Positive | 10 (18.2) | 8 (16.7) | |
| Negative | 45 (81.8) | 40 (83.3) | |
Abbreviations: SBP, systolic blood pressure; DBP, diastolic blood pressure; HR, heart rate.
a Values are expressed as No. (%), mean ± SD, or 95% CI.
b Independent t-test.
c Mann-Whitney test.
d Chi-square for trend.
e Chi-square.
4.3. Outcomes
At 24 hours post-surgery, the intervention group had a significantly lower mean HR (86 ± 6 vs. 89 ± 6 bpm, P = 0.027). Blood loss [median 500 mL (300 - 800) intervention vs. 450 mL (340 - 700) control, P = 0.598] and hemoglobin levels (12.1 ± 1.0 g/dL intervention vs. 12.2 ± 1.2 g/dL control, P = 0.638) were comparable between groups. The intervention group requested fewer analgesics (65.5% vs. 29.2% with no requests, P < 0.001) and used less diclofenac (2.42 ± 1.12 vs. 3.29 ± 1.40 suppositories, P = 0.001). Ketorolac use was similar (1.36 ± 0.80 vs. 1.17 ± 0.88 mg; P = 0.238, Table 3). No serious adverse events were reported. Adverse effects (nausea, vomiting, headache, antiemetic use) showed no significant differences (P > 0.05). Mild nausea (25.5% vs. 14.6%, P = 0.576), vomiting (7.3% vs. 2.1%, P = 0.369), headache (9.1% vs. 4.2%, P = 0.445), and antiemetic use (27.3% vs. 12.5%, P = 0.063) were comparable between groups, though the intervention group trended toward higher mild nausea and antiemetic use (Table 4). Blood loss and hemoglobin levels were comparable (P > 0.05).
Table 3.Comparison of Pain Medication Requests Post-cesarean Section a
| Medication | Groups | P-Value |
|---|---|---|
| Suppository diclofenac | 0.001 b | |
| Intervention: 2.42 ± 1.12 | 36 (65.5) | |
| Control: 3.29 ± 1.40 | 14 (29.2) | |
| Intramuscular ketorolac | 0.238 | |
| Intervention: 1.36 ± 0.80 | 19 (34.5) | |
| Control: 1.17 ± 0.88 | 34 (70.8) | |
| Requests for pain relief in all five evaluations | < 0.001 b | |
| Intervention | 19 (34.5) | |
| Control | 34 (70.8) | |
| At least one instance of not requesting pain medication | - | |
| Intervention | 36 (65.5) | |
| Control | 14 (29.2) |
a Values are expressed as No. (%) or mean ± SD.
b Significant.
Table 4.Frequency of Side Effects of Oxytocin Injection in the Intervention and Control Groups a
| Variables | Group | P-Value | |
|---|---|---|---|
| Control | Intervention | ||
| Nausea | 0.576 | ||
| No | 35 (72.9) | 35 (63.6) | |
| Mild | 7 (14.6) | 14 (25.5) | |
| Moderate and severe | 6 (12.5) | 6 (10.9) | |
| Vomiting | 0.369 | ||
| No | 47 (97.9) | 51 (92.7) | |
| Yes | 1 (2.1) | 4 (7.3) | |
| Headache | 0.445 | ||
| No | 46 (95.8) | 50 (90.9) | |
| Yes | 2 (4.2) | 5 (9.1) | |
| Antiemetic medication | 0.063 | ||
| No | 42 (87.5) | 40 (72.7) | |
| Yes | 6 (12.5) | 15 (27.3) | |
a Values are expressed as No. (%).
5. Discussion
The results of this randomized clinical trial provide compelling evidence that low-dose continuous oxytocin infusion during the first 24 hours post-cesarean section is an effective analgesic strategy for patients undergoing the procedure under spinal anesthesia. Our findings demonstrate a significant reduction in the need for additional pain medication among participants receiving continuous oxytocin, with 65.5% of patients in the intervention group not requesting any pain relief, compared to only 29.2% in the control group (P < 0.001). This notable difference underscores the potential of oxytocin as a valuable adjunct in postoperative pain management, suggesting that its use may enhance patient comfort and reduce reliance on traditional analgesics.
Although no significant differences were observed in adverse effects such as nausea, vomiting, and headache between groups, the intervention group showed a non-significant trend toward higher mild nausea (25.5% vs. 14.6%) and antiemetic use (27.3% vs. 12.5%). This may reflect oxytocin’s known gastrointestinal effects at higher doses, but the low-dose regimen used here minimized these risks, supporting its safety profile. Recent studies, including animal models, further indicate oxytocin’s anti-inflammatory properties via inhibition of mast cell degranulation, which could contribute to reduced postoperative swelling and pain without exacerbating adverse effects (7, 8).
5.1. Theoretical Basis of Oxytocin Analgesia
While our results align with previous studies exploring the analgesic properties of oxytocin in various contexts (9-11, 14, 15), it is essential to address the theoretical frameworks surrounding its analgesic effects. The role of oxytocin in pain modulation is complex and multifaceted, involving both central and peripheral mechanisms. Over the past two decades, substantial evidence has emerged demonstrating oxytocin’s analgesic properties within the central nervous system (CNS) (16). Research has emphasized the involvement of the spinal cord in processing peripheral pain signals, paving the way for extensive studies on spinal antinociception (17). Updated reviews post-2020 confirm these mechanisms, with oxytocin modulating pain through activation of descending inhibitory pathways and potential sex-specific effects, as seen in chronic pain models (5, 6).
5.2. Emotional and Psychological Dimensions of Pain
Pain is not merely a sensory experience; it is deeply intertwined with emotional responses that can trigger intense aversive behaviors and create enduring cognitive impressions. Recent studies have shifted focus toward oxytocin’s influence on CNS structures associated with emotional processing, particularly concerning fear and anxiety (18). The established benefits of oxytocin in mitigating these emotional responses are likely significant contributors to its pain-relieving effects in both physiological and pathological contexts. However, the precise mechanisms through which oxytocin modulates pain expression remain unclear. In the context of labor pain and other visceral pain conditions that pose particular management challenges, more research is required to fully comprehend the effects of oxytocin on reward pathways and memory reinforcement.
5.3. Peripheral Mechanisms of Oxytocin
An emerging area of interest is the potential analgesic role of oxytocin in peripheral tissues. Recent evidence indicates that oxytocin receptors are expressed by small-diameter sensory neurons, particularly C-type nociceptors (19). This discovery may elucidate the antinociceptive effects observed after intravenous oxytocin administration and optogenetic stimulation of endogenous release from the supraoptic nucleus (20, 21). Interestingly, Ende et al. found an inverse relationship between 1- and 24-hour oxytocin levels and incisional pain 24 hours after surgery, indicating that lower pain levels are linked to higher plasma oxytocin levels (22). However, conflicting findings exist; for instance, some studies indicated that daily intranasal oxytocin administration over several weeks had no analgesic effect in patients with chronic pain syndromes (12, 23). These discrepancies may arise from variations in oxytocin dosing, patient demographics, types of surgeries, anesthesia protocols, and the evaluation of chronic versus acute pain. Recent meta-analyses highlight these inconsistencies, showing no significant overall reduction in pain intensity but encouraging results for specific chronic conditions like migraines and back pain (5).
5.4. Mechanisms of Action
Both preclinical and clinical studies have demonstrated oxytocin’s anti-hyperalgesic effects. It is believed that oxytocin activates presynaptic receptors in the dorsal horn, stimulating GABAergic interneurons that inhibit nociceptive signals. Additionally, oxytocin may modulate pain perception via the endogenous opioid system, an indirect pathway (9, 24-28). Psychological factors such as stress responses to pain, mood, and anxiety may also mediate oxytocin’s analgesic effects (29). Given that the optimal effective dose of oxytocin remains unclear, we administered a total of 30 IU over 24 hours, as this is a commonly used and safe dosage in obstetric studies. Higher doses may increase the risk of side effects, including nausea, vomiting, and hypotension (30).
5.5. Clinical and Future Directions
In conclusion, our study contributes to the ongoing discourse surrounding oxytocin’s analgesic effects, particularly in the context of post-cesarean section pain management. Although our findings indicated no significant difference in ketorolac consumption between groups (P = 0.238), we believe this may be related to the timing of ketorolac administration based on pain severity upon arrival in the ward. In many cases, diclofenac was effective in subsequent pain episodes, suggesting that if oxytocin infusion begins immediately post-operation, ketorolac use could be further reduced, minimizing exposure to its side effects. Increasing the oxytocin infusion dose during the first six hours post-surgery, according to its ED90, may also decrease analgesic consumption during hospitalization (31, 32). Moreover, this strategy minimizes the need for NSAIDs, which can have negative side effects, especially in the postoperative setting. By reducing NSAID consumption, continuous oxytocin infusion not only improves pain management but also lessens the possibility of these drugs’ adverse effects, thereby promoting a safer and more effective recovery process for patients.
These results add to the increasing body of research supporting the clinical application of oxytocin, especially in obstetric settings. However, more investigation is necessary to examine the safety profile and long-term impacts of continuous oxytocin infusion, as well as its potential applications in various pain management scenarios. Addressing the theoretical bases of oxytocin’s analgesic effects will enhance our understanding and application of this promising analgesic strategy.
5.6. Conclusions
According to the results of this randomized clinical trial, low-dose continuous oxytocin infusion is an effective analgesic strategy for patients undergoing cesarean sections under spinal anesthesia. The significant reduction in the need for additional pain medication and the high percentage of patients not requesting pain relief in the intervention group highlight oxytocin’s potential as a valuable adjunct in postoperative pain management. This approach promotes a safer recovery by reducing dependency on NSAIDs, improving patient comfort, and reducing the likelihood of associated side effects. These results suggest that incorporating continuous oxytocin infusion into postoperative care protocols may lead to improved outcomes for patients following cesarean delivery. Further research is warranted to explore the long-term benefits and broader applications of oxytocin in pain management across various surgical contexts.
5.7. Limitations
The study was conducted at a single center, potentially limiting generalizability. The sample size, while adequate for primary outcomes, may not detect rare adverse effects. The 24-hour follow-up period limits insights into long-term outcomes. Potential biases were minimized through blinding and randomization, but unmeasured confounders (e.g., psychological factors) could influence results.
5.8. Generalizability
The findings are applicable to women undergoing elective cesarean sections under spinal anesthesia in similar settings, provided exclusion criteria are met. The intervention’s simplicity and low cost make it feasible for broader implementation, particularly in resource-limited settings.
