


1. Background
Schizophrenia is often a chronic and debilitating condition characterized by various groups of positive and negative symptoms. The differentiation between positive and negative symptoms was first introduced in neurology and later adopted by psychiatry (1, 2). The prevalence of schizophrenia varies depending on environmental factors and disease etiology, but it has been reported that the global prevalence is approximately 3.3 per 1000 individuals (3). Recognizing the importance of effective educational strategies to improve quality of life, many researchers have developed intervention programs aimed at promoting mental health in different aspects (4). In the context of schizophrenia, this distinction aligns with clinical observations and helps define the disorder through specific symptom domains. Negative symptoms are marked by a reduction or absence of normal behaviors related to motivation and interest, such as avolition, anhedonia, and asociality, as well as impaired expressive abilities, including reduced affect and alogia (5). In contrast, positive symptoms are characterized by exaggerated or distorted normal functions, such as delusions, hallucinations, and disorganized behavior (6).
Treatment for patients varies based on clinical conditions. Studies have indicated that 2 medications, Olanzapine and Risperidone, are commonly used for treating schizophrenia (7). However, research to date has not conclusively determined which of these drugs is more effective or has fewer side effects compared to the other (8). Recent studies suggest that using modafinil in conjunction with Olanzapine and Risperidone may improve clinical symptoms in patients with schizophrenia. For instance, Kandefer et al. demonstrated that Modafinil treatment in schizophrenia patients could lead to improvements in negative symptoms and cognitive function (9). Conversely, some studies have found that modafinil does not affect the recovery process of patients' clinical symptoms (10, 11). As a result, there is no established theory regarding the impact of modafinil on improving negative symptoms in schizophrenia patients. This study aims to investigate this matter further.
2. Objectives
This study was done to assess the impact of modafinil on improving negative symptoms in schizophrenia patients.
3. Methods
3.1. Participants
This study is a clinical trial. In this research, 40 individuals diagnosed with schizophrenia and exhibiting negative symptoms (as per DSM-5 criteria) were selected. These participants were either admitted to the neuropsychiatric department or referred to the neuropsychiatric clinic at Golestan Hospital in Ahvaz. They were then randomly assigned into 2 groups, each comprising 20 participants. Eligible patients included those aged 18 - 65, diagnosed with schizophrenia, and currently treated with Risperidone or Olanzapine. Exclusion criteria were the use of other typical antipsychotic drugs, coexisting psychiatric conditions such as schizoaffective disorder, other psychotic disorders, bipolar disorder, depression, anxiety disorders (e.g., panic disorder or obsessive-compulsive disorder), post-traumatic stress disorder, or eating disorders. Individuals with substance dependency or abuse, including drugs or alcohol, or those who received electroconvulsive therapy in the current or preceding 12 months, were also excluded. A flowchart illustrating the patient selection process is presented in Figure 1.
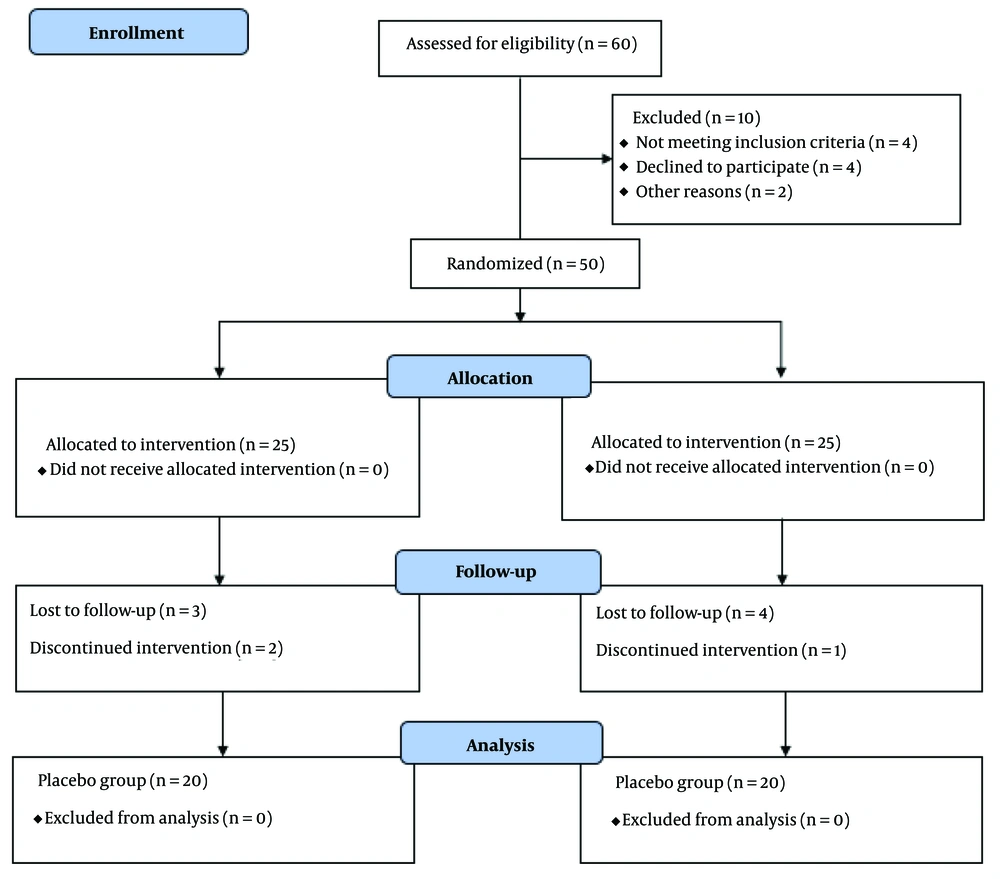
Figure 1.
Flowchart of patient selection
3.2. Randomization
Initially, a computer-generated table of random numbers was created. After obtaining informed consent for random allocation, a number was randomly selected from this table for the first patient. For subsequent patients, we moved one position to the right in the table of random numbers. Patients with even numbers were assigned to the intervention group, while those with odd numbers were allocated to the control group.
3.3. Intervention
In this experimental cohort study, participants received a daily dose of 100 to 200 mg of modafinil alongside their existing antipsychotic treatment of either Risperidone or Olanzapine. The control group received a placebo tablet in addition to their prescribed antipsychotic medication. The placebo tablet was meticulously crafted by the Faculty of Pharmacy at Ahvaz University to closely match modafinil in physical characteristics, including shape, smell, taste, size, and color. The production process of the placebo tablet was identical to that of the intervention group. The follow-up duration for this study was 4 weeks. Both the evaluator and the patients were blinded to the administered medication. The Scale for the Assessment of Negative Symptoms (SANS) was utilized to assess negative symptoms before the intervention, and at 2 and 4 weeks post-intervention.
3.4. Ethical Statement
This study received approval from the Ethical Committee of Ahvaz Jundishapur University of Medical Sciences (ethical code: IR.AJUMS.REC.1402.216). Additionally, it was registered in the Iranian Registry of Clinical Trials (IRCT20161228031626N6).
3.5. Statistical Analysis
Treatment effects were analyzed using a repeated measures analysis of variance (ANOVA) model, with time (before intervention, 2 and 4 weeks after intervention) as the within-subjects factor and treatment group (Modafinil, placebo) as the between-subjects factor. An unpaired Student's t-test with a two-sided P-value was employed to compare the initial and final conditions of both groups participating in the trial. Fisher's exact test was also used to analyze and compare demographic information and the prevalence of adverse effects across different procedures. Results are presented as mean ± standard deviation. Differences with a P-value of < 0.05 were considered statistically significant.
4. Results
Considering the inclusion criteria, 40 schizophrenia patients with negative symptoms, either admitted to the neuropsychiatric department or referred to the neuropsychiatric clinic of Golestan Hospital in Ahvaz, were included in this study. They were randomly divided into 2 groups of 20 individuals each. Regarding demographic information, the patients were matched, and statistical tests were utilized for Analysis. The mean age of participants in the intervention group was 34.00 ± 6.60 years, while the mean age in the placebo group was 36.90 ± 6.88 years. The calculated P-value was 0.07, exceeding the predetermined significance threshold, indicating no significant age difference between the 2 groups. Gender distribution analysis revealed that in the group receiving modafinil (intervention), 12 individuals (60%) were male, and 8 individuals (40%) were female. In the placebo group, 11 individuals (55%) were male, and 9 individuals (45%) were female.
The results of the chi-square test indicated that there was no association between the treatment group and gender. This suggests that the two groups had a similar distribution of gender. Analysis of the disease duration revealed that individuals in the intervention group had an average disease duration of 3.35 ± 1.69 years, while those in the placebo group had been diagnosed with schizophrenia an average of 3.70 ± 2.17 years ago. Statistical Analysis showed that there was no statistically significant difference in disease duration between the two groups. Additionally, the calculated P-value of 0.57 indicated that there was no significant distinction between the two groups (Table 1).
Table 1.Demographic Characteristics of Patients a
| Variables | Intervention (n = 20) | Placebo (n = 20) | P-Value |
|---|---|---|---|
| Age | 34.00 ± 6.60 | 36.90 ± 6.88 | 0.07 |
| Duration of disease | 3.35 ± 1.69 | 3.70 ± 2.17 | 0.57 |
| Sex | 0.21 | ||
| Male | 12 (60) | 11(55) | |
| Female | 8 (40) | 9 (45) | |
| Residency | 0.33 | ||
| City | 13 (65) | 10 (50) | |
| Rural | 7 (35) | 10 (50) | |
| Education | 0.22 | ||
| Diploma | 6 (30) | 7 (35) | |
| Bachelor | 5 (25) | 6 (30) | |
| Master of science | 4 (20) | 4 (20) | |
| Ph.D. | 5 (25) | 3 (15) |
a Values are expressed as No. (%) or mean ± SD.
An analysis of the two cohorts over a period of time revealed that before any interventions were implemented, there was no significant difference in terms of SANS scores between the individuals in the two groups. More precisely, the mean negative symptom score for those who underwent the intervention was 110.24, while the corresponding figure for the placebo-administered group was 114.61. The obtained P-value exceeded the predefined significance level of 5%, indicating the absence of any significant difference between the two groups regarding the negative symptom score.
Two weeks after the initiation of the intervention, a follow-up assessment was conducted on the patients from both cohorts regarding their negative symptoms. The findings revealed a slight disparity between the two groups, with a P-value of 0.04, representing only a 1% deviation from the significance level. Consequently, despite the observable difference in negative symptoms between the groups, the discrepancy was of minimal magnitude at this point. Subsequent investigations have shown that after 4 weeks, a statistically significant disparity exists in the scores between the two groups. The mean score of negative symptoms in the cohort administered with modafinil was 84.39, with a standard deviation of 3.54. In contrast, the placebo-receiving group had an average score of 113.79, with a standard deviation of 3.75. The calculated P-value for this statistical Analysis was 0.002, which is smaller than the predetermined threshold of 5%, indicating a notable statistical difference between the two groups.
In this study, a repeated measurement design was employed to examine the relationship between time and the group under investigation. The findings of the statistical Analysis revealed that the interaction effect of time and group was statistically significant. It implies that the effectiveness of modafinil as a medicinal supplement is contingent upon the length of administration time (Table 2). The temporal similarity of the efficacy pattern was not consistent between the two groups (groups-by-time interaction, P = 0.026) (Figure 1). The significance of the difference in the negative subscale of PANSS was notable between the two treatment groups at the endpoint. The visual representation depicted in the graph below illustrates that the disparity between the intervention and placebo groups becomes more pronounced as the duration of drug consumption increases.
Table 2.Scale for the Assessment of Negative Symptoms (SANS) Score and the Sub-scales During the Study Time in Patients
| Variables | Intervention (n = 20) | Placebo (n = 20) | P-Value |
|---|---|---|---|
| Before intervention | |||
| Total Score SANS | 110.24 ± 8.74 | 114.61 ± 9.50 | 0.34 |
| Affective flattening or blunting | 36.74 ± 4.30 | 34.62 ± 4.11 | 0.45 |
| Alogia | 22.41 ± 4.54 | 21.11 ± 5.77 | 0.24 |
| Avolition/apathy | 16.52 ± 11.37 | 15.36 ± 10.07 | 0.51 |
| Asociality/anhedonia | 21.15 ± 13.47 | 19.74 ± 4.62 | 0.26 |
| Attention | 12.65 ± 4.19 | 11.41 ± 3.54 | 0.12 |
| 2 weeks after intervention | |||
| Total Score SANS | 99.70 ± 10.24 | 111.24 ± 70.08 | 0.04 |
| Affective flattening or blunting | 35.21 ± 5.30 | 33.15 ± 3.52 | 0.22 |
| Alogia | 22.65 ± 5.61 | 22.52 ± 5.37 | 0.11 |
| Avolition/apathy | 15.76 ± 10.24 | 14.27 ± 9.43 | 0.23 |
| Asociality/anhedonia | 19.24 ± 12.21 | 22.34 ± 3.222 | 0.32 |
| Attention | 13.72 ± 5.26 | 13.62 ± 4.44 | 0.4 |
| 4 weeks after intervention | |||
| Total Score SANS | 84.39 ± 3.54 | 113.79 ± 3.75 | 0.002 |
| Affective flattening or blunting | 37.14 ± 3.51 | 36.50 ± 3.69 | 0.62 |
| Alogia | 22.16 ± 2.47 | 21.10 ± 3.85 | 0.41 |
| Avolition/apathy | 21.10 ± 3.85 | 23.54 ± 3.81 | 0.36 |
| Asociality/anhedonia | 23.54 ± 3.81 | 23.65 ± 4.74 | 0.02 |
| Attention | 20.22 ± 4.62 | 22.41 ± 3.36 | 0.52 |
All subscales were assessed throughout the study period. At the beginning of the trial and 2 weeks post-intervention, no significant difference in symptoms was observed between the groups. However, four weeks after starting the intervention, a reevaluation of negative symptoms was conducted. This revealed that only the aspect of non-sociality/anhedonia varied between the 2 groups, with the Modafinil group showing significant improvement in anhedonia (Table 2). Five categories of adverse reactions were recorded during the study. The occurrence of adverse reactions did not differ significantly between the modafinil and placebo treatments. Notably, every group, without exception, experienced at least one adverse event during the trial.
According to the results of the repeated measure analysis, significant differences were observed in the total SANS scores between subjects who received the intervention and those in the placebo group. Additionally, time was a statistically significant factor. There was also a significant Group×Time interaction effect. Among the subscales, asociality/anhedonia showed significant differences among different groups and throughout the study period (Table 3 and Figure 2).
Table 3.Effects of Adjunctive Modafinil and Placebo on Scale for the Assessment of Negative Symptoms (SANS) Based on the Repeated Measure Analysis
| Least Square Means | F-Value | P-Value | ||||
|---|---|---|---|---|---|---|
| Total Score SANS | ||||||
| Time | 62.6 | 6.20 | 0.017 | |||
| Group | 60.8 | 5.43 | 0.02 | |||
| Time × group | 56.4 | 7.29 | 0.01 | |||
| Subscale of SANS | ||||||
| Affective flattening or blunting | ||||||
| Time | 72.20 | 1.44 | 0.12 | |||
| Group | 52.26 | 1.32 | 0.78 | |||
| Time × group | 47.79 | 3.4 | 0.14 | |||
| Alogia | ||||||
| Time | 46.65 | 2.42 | 0.23 | |||
| Group | 38.70 | 2.01 | 0.15 | |||
| Time × group | 53.61 | 1.09 | 0.12 | |||
| Avolition/Apathy | ||||||
| Time | 62.23 | 2.41 | 0.62 | |||
| Group | 29.23 | 1.98 | 0.98 | |||
| Time × group | 41.80 | 1.79 | 0.36 | |||
| Asociality/Anhedonia | ||||||
| Time | 32.19 | 8.64 | 0.02 | |||
| Group | 27.19 | 9.51 | 0.001 | |||
| Time × group | 7.17 | 0.002 | ||||
| Attention | ||||||
| Time | 60.80 | 1.6 | 0.19 | |||
| Group | 54.79 | 3.1 | 0.78 | |||
| Time × group | 51.19 | 2.67 | 0.65 | |||
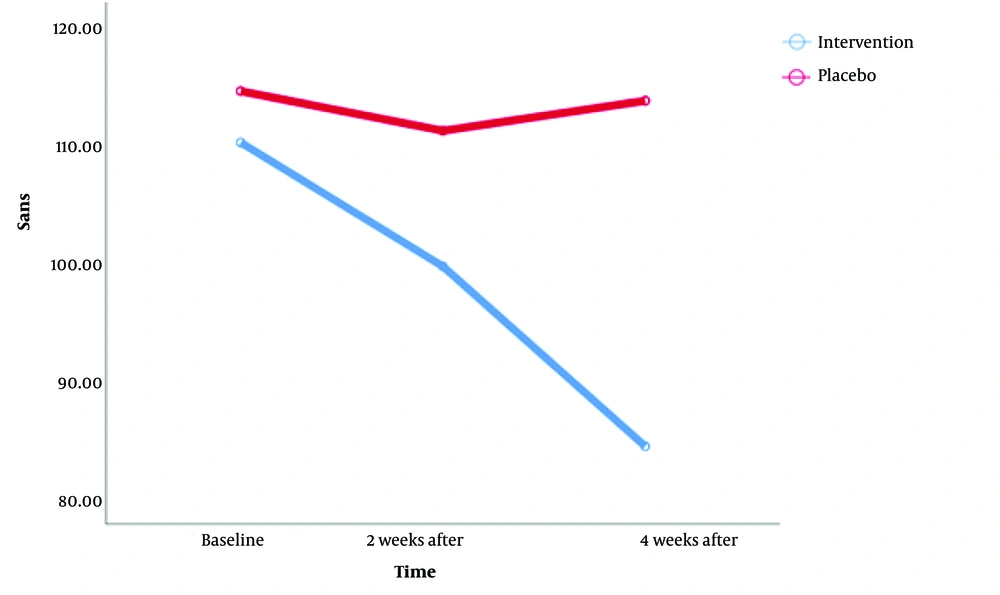
Figure 2.
Scale for the assessment of negative symptoms (SANS) for time and group interaction
5. Discussion
Recognizing, assessing, and addressing clinically significant negative symptoms of schizophrenia is crucial for enhancing patient outcomes in a majority of patients. Negative symptoms are more strongly correlated with impaired patient functioning, reduced quality of life, and decreased productivity compared to positive symptoms, which can be more effectively managed with current treatments (12). This situation is partly due to clinicians often overlooking negative symptoms and the lack of readily available evidence-based treatment options. Consequently, the limited availability of such treatments results in a tendency to neglect the identification of negative symptoms.
This study aimed to evaluate the effect of adding modafinil to the treatment of negative symptoms in schizophrenic patients receiving Risperidone or Olanzapine. The results indicated that there was minimal impact on the alleviation of negative symptoms after 2 weeks of treatment. However, a significant improvement was observed after 4 weeks, with a clear distinction between the 2 groups. When examining specific negative symptoms, only anhedonia showed differences between the groups after 4 weeks, with no significant disparities in other symptoms. These findings are consistent with those of a 4-week, randomized, placebo-controlled, parallel-group study, which also concluded that modafinil did not enhance attention, a component of negative symptoms (13). In our study, Modafinil administration resulted in significant improvement in antisocial anhedonia compared to the control group.
Similar results were observed in various other studies (14, 15). This study found that both groups showed significant improvement in the total score of negative symptoms during the 4-week treatment with risperidone. Akhondzadeh et al.'s research suggested that since schizophrenia's negative symptoms may be linked to dopaminergic hypofunction in the prefrontal cortex, drugs like modafinil, which increase dopaminergic activity, should theoretically reduce these symptoms (14). However, in an eight-week double-blind, placebo-controlled study, no significant effect of modafinil on negative symptoms was observed (16). This could be due to the small number of participants, resulting in insufficient statistical power to detect significant differences in negative symptoms. Other studies also indicated that modafinil had no effect on the recovery process of negative symptoms (10, 11).
Contrasting findings were reported in other research (17, 18), suggesting no significant difference in the change of negative symptom ratings between modafinil and placebo treatments. Several reasons could explain these negative results. It's possible that modafinil is simply ineffective in treating negative symptoms in schizophrenia patients, as seen in this study with patients both with and without deficiency syndrome. Alternatively, a 200 mg/day dosage of modafinil might not be within the therapeutic window for treating schizophrenia, suggesting the need for dosage adjustment.
Another theory is that patients treated with modafinil may have experienced improvements in negative symptoms that were not detectable by the SANS evaluation tool (11). Measuring improvement often depends on observable changes in behavior or activity levels. In a randomized, double-blind, placebo-controlled trial, the effects of adjunctive Armodafinil on cognitive function and psychopathology in antipsychotic-treated patients with schizophrenia or schizoaffective disorders were examined. The study found that time affected overall PANSS scores, including positive, negative, and cognitive symptoms, with patients in both groups generally improving over time. The interaction effect of time and group was significant, indicating the effect of drugs over time. Analysis of individual scale items revealed a group × time interaction effect for the SANS anhedonia-asociality item, similar to our findings (19).
A systematic review assessed the impact of modafinil on negative symptoms of schizophrenia, revealing its effectiveness in alleviating these symptoms in some individuals with schizophrenia. The review also reported that modafinil is safe, well-tolerated, and does not worsen other symptom dimensions (5). Additionally, modafinil has appetite-suppressing properties, reducing food intake in healthy participants and potentially mitigating antipsychotic-induced weight gain.
The exact mechanism of modafinil's effects is still unclear. It is hypothesized that modafinil acts as a stimulator of hypocretin/orexin, affecting adrenergic neurons in the locus coeruleus. Immunohistochemical Analysis using Fos protein has shown the activation of hypocretin/orexin neurons following Modafinil administration, indicating that some drug effects may be mediated by this neuropeptide. Hypocretin/orexin neurons are involved in various domains, including vigilance states, arousal, emotion, reward processing, motivation, substance addiction, feeding, and sleep-wake regulation. Additional evidence suggests that modafinil may operate via a similar mechanism to hypocretin/orexin, facilitating histamine release (5, 20).
Additionally, modafinil has been demonstrated to inhibit dopamine reuptake, thus increasing the extracellular concentration of dopamine. It also binds to and stimulates alpha 1B-adrenergic receptors (21).
5.1. Conclusions
In conclusion, this study suggests that modafinil could be an effective adjunctive therapy for schizophrenia, particularly for treating anhedonia symptoms. However, larger controlled trials are necessary before recommending broader clinical applications.


