
1. Background
Cardiac resynchronization therapy (CRT) is a conventional treatment for end-stage heart failure (HF) patients resistant to medication (1, 2). FDA-approved implanted devices for HF management began in 2001. Left bundle branch block (LBBB), which alters the timing and contraction pattern, worsens the mechanical function of the heart with failure and produces inadequate ventricular filling, lower left ventricular contractility, extended mitral regurgitation, and increased mortality. These mechanical representations of disturbed ventricular conduction are called ventricular dyssynchrony and can be accompanied by a QRS complex longer than 120 ms (3). Biventricular pacemakers treat ventricular dyssynchrony. This type of pacing treatment is called CRT (4). The CRT is an effective treatment for left ventricular systolic dysfunction, according to several studies (5). This therapy synchronizes left and right ventricular contractions. The CRT has been shown to improve left ventricular systolic function, left ventricle anatomy, symptoms, and reduce patient mortality (6-8).
ACC/AHA guidelines indicate CRT implantation for: (A) patients with left ventricular ejection fraction (LVEF) of less than 35%, LBBB with QRS time of over 150 ms, sinus rhythm, and NYHA II-IV class, despite optimal medical therapy (class I); (B) patients with LVEF of less than 35%, LBBB with QRS time of 120 to 149 ms, sinus rhythm, and NYHA II-IV despite optimal medical therapy (class IIa); (C) patients with LVEF of less than 35%, QRS time of over 120 ms, atrial fibrillation rhythm, and NYHA III-IV class despite maximum medical therapy who need frequent ventricular pacing (class IIa); (D) patients with LVEF of less than 35%, non-LBBB with QRS time of over 150 ms, sinus rhythm, and NYHA III-IV class despite maximum medical therapy (class IIa). The LBBB as a major criterion for CRT implantation can have fragmented or non-fragmented (smooth) patterns, and this fragmentation may be related to the presence of scar in the myocardium.
Determining the precise criteria for response to CRT is also a challenging issue, which has been considered in different studies proposing various criteria such as improved exercise capacity, improved quality of life, an increase of at least a single class in the NYHA scoring system, an increase of 10 to 25% in the 6-minute walk test, an increase of 5% or more in the absolute value of LVEF, and a decrease of 15% or more in left vernacular end-systolic volume (LVESV). The latter two factors are strong predictors of clinical improvement (9, 10). Moreover, notch QRS complexes, particularly in lateral leads, can be associated with ventricular delay and may be a marker of a good response to CRT. However, notch duration is also a factor; a longer notch duration, especially exceeding 67.5 ms, decreases the likelihood of successful CRT (11). If the criteria to select the patients for CRT are chosen carefully and precisely, the therapeutic response will be 60 - 70% (12, 13). However, clinical response and echocardiography are not synchronized, and clinical improvement is observed in a greater number of patients. Therefore, predicting the patients’ response to CRT before treatment is highly significant because CRT is an expensive and aggressive method. Different echocardiographic parameters have been investigated for predicting the appropriate therapeutic response to CRT in candidate patients in different studies (9, 10); however, none of them have proposed an acceptable predictive criterion for evaluating CRT results (12).
2. Objectives
The present study investigated the prediction of CRT treatment response using QRS complex morphology to evaluate whether the presence of QRS notching in HF patients could predict a positive or negative response to CRT.
3. Methods
3.1. Study Population
The present study was conducted on patients with HF who volunteered to receive CRT at the heart clinics affiliated with Ahvaz Jundishapur University of Medical Sciences and Tehran Heart Center affiliated with Tehran University of Medical Sciences in 2015. At the start of the study, there were 106 patients. During the six-month follow-up period, four patients died, and three were excluded from the research due to refusal to continue participation. Ultimately, 99 people were examined. Inclusion criteria were as follows: Symptomatic congestive HF according to the criteria issued by NYHA class III and IV that has not responded to medical therapies, LVEF of less than or equal to 35%, QRS complex of over 120 ms, and age over 18 years. Exclusion criteria were as follows: Right branch block (RBB), presence of a pacemaker, expected lifetime of less than 1 year, severe kidney dysfunction (serum creatinine over 3 mg/dL), atrial fibrillation rhythm, and lack of consent to participate in the study.
3.2. Study Design
After proper patients were selected from among those who were candidates for CRT implantation and their informed consent was obtained, their personal and medical information, including age, gender, and cardiac risk factors (smoking, hypertension, hyperlipidemia, diabetes, and family history), and the results of angiography were recorded in the study forms. Subsequently, the patients’ history was recorded to precisely determine NYHA function class, and a 12-lead electrocardiogram was performed. Among patients with LBBB and intraventricular conduction delay, the presence of two or more R waves or a notch on the R or S wave in at least two consecutive leads was considered as notched QRS complex (nQRS). Patients without a notch in the QRS complex were considered as smooth QRS complex (sQRS) (Figures 1 and 2). According to the location of nQRS (lateral, inferior, and anterior leads) and absence of a notch, the patients were divided into four subgroups. Echocardiographic criteria, including LVESV and LVEF for each patient, were recorded in the study form based on transthoracic echocardiography and the Simpson method. Six months after CRT implantation, the patients’ detailed history was collected again to determine NYHA function class, echocardiography was conducted again, and the difference between LVESV and LVEF was measured. A decrease in LVESV of 15% or more, an increase in LVEF of 5% or more, or at least one class improvement in NYHA function class was considered a positive therapeutic response. Subsequently, the positive therapeutic response among individuals with nQRS and sQRS was analyzed according to the location of nQRS in lateral, inferior, and anterior leads. Inclusion criteria are as follows: Symptomatic congestive HF according to the criteria issued by NYHA class II to IV that has not responded to medical therapies, LVEF of less than or equal to 35%, QRS complex of over 120 ms, and age over 18 years. Exclusion criteria are as follows: Right branch block, presence of a pacemaker, expected lifetime of less than 1 year, severe kidney dysfunction (serum creatinine over 3 mg/dL), atrial fibrillation rhythm, and lack of consent to participate in the study.
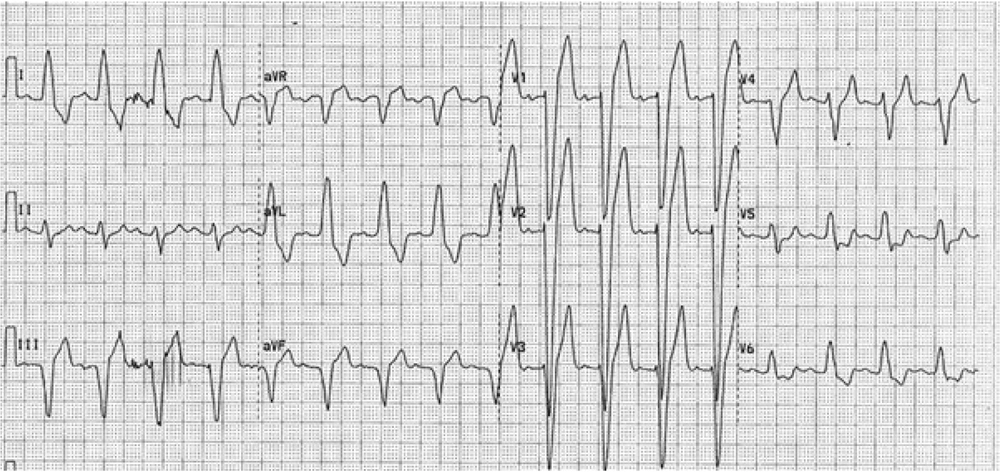
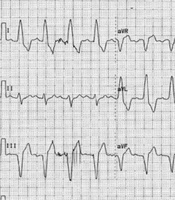
Figure 1.
Electrocardiogram of left bundle branch block (LBBB) with smooth QRS complex (sQRS). In addition to the wideness of the QRS complex, no additional prominent notch are observed in the descending and ascending parts of the complex.

Figure 2.
Electrocardiogram of left bundle branch block (LBBB) with notched QRS (nQRS). Notching of the QRS complex is observed in both the descending part of the precordial leads and the inferior leads. It is also observed in the ascending part of I and aVL.
3.3. Data Collection Instruments
Echocardiography was carried out for the patients using GE Vingmed Ultrasound Horton, Norway-model: VIDVID3, class I, type BF. Images from four- and two-chamber views were obtained. The LVESV and LVEF were measured using the Simpson method. To avoid errors in echocardiography measurement at each center, the process was carried out by an individual three times, and the means were recorded.
3.4. Sample Size
The sample size was calculated based on a comparison of two proportions: A 79.1% response rate in the QRS index ≥ 30% group and 41.7% in the < 30% group. Using a two-tailed test with a significance level of 0.05 and 90% power (β = 0.10), the required sample size was estimated to be 39 participants per group. After adjusting for a 20% anticipated attrition rate, the final total sample size was determined to be 98 participants (14).
3.5. Statistical Analysis of the Collected Data
The collected data were analyzed using SPSS software. Numerical variables were expressed as mean ± standard deviation, while nominal ones were presented as numbers and percentages. Continuous variables were compared using t-tests or nonparametric tests. Ordinal variables were compared using chi-square and Fisher tests. P-values of less than 0.05 were considered statistically significant. All statistical operations were carried out using SPSS 18.0.
4. Results
In the present study, 99 patients afflicted by HF who received CRT were investigated. Their mean age was 52.1 ± 10.2 years, with 59 men (59.6%). Ninety-seven patients received CRT-D, and two received CRT-P. The patients’ demographic characteristics are summarized in Table 1. Investigation of the presence of a notch indicated that 64 patients had a notch in at least two of their leads, while 35 patients had sQRS. Among patients with a notch in the QRS complex, 49 had a notch in lateral leads, 43 in inferior leads, and 36 in anterior leads. An initial comparison between patients with a notch and those with sQRS indicated no difference between the two groups regarding basic variables, except for the patients’ gender. The results of this comparison are presented in Table 2. Subsequently, the patients were compared according to the subgroups of the presence of a notch, with results showing no significant difference among the four subgroups. The results of comparing the four groups are presented in Table 3.
| Variables | Values d |
|---|---|
| Age | 52.1 ± 10.2 |
| Male gender | 59 (59.6) |
| CRT type | |
| CRT-D | 97 (97.8) |
| CRT-P | 2 (2.2) |
| Comorbidities | |
| Diabetes | 27 (29.3) |
| Hypertension | 41(44.5) |
| Dyslipidemia | 33 (36.1) |
| Family history | 6 (6.9) |
| Smoking | 20 (22.1) |
| Coronary angiography | |
| Normal | 48 (48.5) |
| Ischemic heart disease | 51 (51.5) |
| NYHA class | |
| III | 73 (79.3) |
| IV | 19 (20.7) |
| Leads with notch | |
| sQRS | 35 (35.3) |
| Lateral | 49 (49.5) |
| Inferior | 43(43.4) |
| Anterior | 36 (36.3) |
| LVEF | 23.9 ± 6.1 |
| LVESV | 160.1 ± 67.9 |
Abbreviations: CRT, cardiac resynchronization therapy; LVEF, left ventricular ejection fraction; LVESV, left ventricular end systolic volume; NYHA, New York Heart Association; CRT-D, cardiac resynchronization therapy defibrillator; CRT-P, cardiac resynchronization therapy with a pacemaker; sQRS, smooth QRS complex.
a A P-value less than 0.05 is considered statistically significant.
b The continuous variables were compared using t-test or nonparametric tests.
c Order variables were compared using chi-square and Fischer tests.
d Values are expressed as No. (%) or mean ± SD.
Table 2.
| Variables | sQRS | With Notch | P-Value |
|---|---|---|---|
| Age | 58.5 ± 9.1 | 60.7 ± 12.1 | 0.34 |
| Male gender | 27 (77.0) | 32 (50.0) | 0.008 |
| CRT type | 0.35 | ||
| CRT-D | 32 (92.5) | 65 (100) | |
| CRT-P | 2 (7.5) | 0 (0) | |
| Comorbidities | |||
| Diabetes | 7 (25.9) | 19 (29.2) | 0.81 |
| Hypertension | 10 (37.0) | 31 (47.8) | 0.36 |
| Dyslipidemia | 6 (21.9) | 27 (42.5) | 0.11 |
| Family history | 2 (7.4) | 8 (8.5) | 0.99 |
| Smoking | 8 (31.7) | 11 (18.0) | 0.19 |
| Coronary angiography | 0.35 | ||
| Normal | 15 (42.8) | 33 (51.5) | |
| Ischemic heart disease | 20 (57.2) | 31 (48.5) |
Abbreviations: CRT, cardiac resynchronization therapy; LVEF, left ventricular ejection fraction; LVESV, left ventricular end systolic volume; NYHA, New York Heart Association; CRT-D, cardiac resynchronization therapy defibrillator; CRT-P, cardiac resynchronization therapy with a pacemaker; sQRS, smooth QRS complex.
a A P-value less than 0.05 is considered statistically significant.
b The continuous variables were compared using t-test or nonparametric tests.
c Order variables were compared using chi-square and Fischer tests.
| Variables | Lateral (n = 49) | sQRS (n = 35) | Inferior (n = 43) | Anterior (n = 36) | P-Value |
|---|---|---|---|---|---|
| Age | 60.3 ± 11.4 | 58.5 ± 9.1 | 60.1 ± 10.3 | 59.1 ± 11.4 | 0.89 |
| Male gender | 23 (47.8) | 27 (77.0) | 18 (43.7) | 16 (55.5) | 0.08 |
| CRT type | 0.22 | ||||
| CRT-D | 49 (100) | 32 (92.5) | 43 (100) | 30 (100) | |
| CRT-P | 0 (0) | 2 (7.5) | 0 (0) | 0 (0) | |
| Comorbidities | |||||
| Diabetes | 14 (29.5) | 7 (25.9) | 14 (32.8) | 7 (24.4) | 0.93 |
| Hypertension | 23 (47.8) | 10 (37.0) | 16 (37.5) | 17 (42.2) | 0.81 |
| Dyslipidemia | 22 (45.0) | 6 (21.9) | 17 (41) | 14 (46.6) | 0.32 |
| Family history | 4 (9.8) | 2 (7.4) | 2 (6.2) | 1 (3.3) | 0.72 |
| Smoking | 9 (18.3) | 8 (31.7) | 6 (15.6) | 2 (8.8) | 0.19 |
| Coronary angiography | 0.61 | ||||
| Normal | 28 (57.1) | 15 (42.8) | 24 (55.8) | 17 (47.2) | |
| Ischemic heart disease | 21 (42.9) | 20 (57.2) | 19 (44.2) | 19 (52.8) | |
| NYHA class | 0.82 | ||||
| III | 40 (81.6) | 29 (82.8) | 34 (79.6) | 29 (80.5) | |
| IV | 9 (18.4) | 6 (17.2) | 9 (20.4) | 7 (19.5) | |
| LVEF | 22.9 ± 6.4 | 21.1 ± 5.9 | 22.4 ± 6.9 | 23.3 ± 7.9 | 0.11 |
| LVESV | 153.8 ± 70.5 | 182.7 ± 61.0 | 157.7 ± 73.3 | 155.6 ± 71.7 | 0.06 |
Abbreviations: CRT, cardiac resynchronization therapy; LVEF, left ventricular ejection fraction; LVESV, left ventricular end systolic volume; NYHA, New York Heart Association; CRT-D, cardiac resynchronization therapy defibrillator; CRT-P, cardiac resynchronization therapy with a pacemaker; sQRS, smooth QRS complex.
a A P-value less than 0.05 is considered statistically significant.
b The continuous variables were compared using t-test or nonparametric tests.
c Order variables were compared using chi-square and Fischer tests.
Comparing the changes in echocardiographic criteria before and after CRT implantation indicated that LVESV before CRT implantation in the sQRS group was higher than that in the nQRS group (Table 2). After CRT implantation and during follow-up in NYHA function class, there was no significant difference between the two groups with and without a notch (P = 0.89). After CRT implantation, however, in echocardiography follow-up, LVESV reduction was higher in the nQRS group than in the sQRS group, but this difference was not significant (P = 0.27). On the other hand, LVEF improvement after CRT implantation was not significantly different between the two groups (P = 0.87). Comparisons of the changes in NYHA function class, LVEF, and LVESV between the two main nQRS and sQRS groups and the subgroups, which were not significantly different, are shown in Table 4 and Table 5.
Table 4.
| Variables | sQRS (n = 35) | With Notch (n = 64) | P-Value |
|---|---|---|---|
| NYHA class improvement | 32 (91.4) | 58 (90.6) | 0.89 |
| LVEF improvement | 18 (51.4) | 34 (53.1) | 0.87 |
| LVESV reduction | 13 (37.1) | 31 (48.4) | 0.27 |
Abbreviations: LVEF, left ventricular ejection fraction; LVESV, left ventricular end systolic volume; NYHA, New York Heart Association; sQRS, smooth QRS complex.
a A P-value less than 0.05 is considered statistically significant.
b The continuous variables were compared using t-test or nonparametric tests.
c Order variables were compared using chi-square and Fischer tests.
Table 5.
| Variables | Lateral (n = 49) | sQRS (n = 35) | Inferior (n = 43) | Anterior (n = 36) | P-Value |
|---|---|---|---|---|---|
| NYHA class improvement | 44 (89.8) | 32 (91.4) | 39 (90.6) | 33 (91.6) | 0.82 |
| LVEF improvement | 25 (51.2) | 18 (51.4) | 22 (51.1) | 21 (58.3) | 0.71 |
| LVESV reduction | 18 (36.5) | 13 (37.1) | 19 (44.1) | 20 (55.5) | 0.29 |
Abbreviations: LVEF, left ventricular ejection fraction; LVESV, left ventricular end systolic volume; NYHA, New York Heart Association; sQRS, smooth QRS complex.
a A P-value less than 0.05 is considered statistically significant.
b The continuous variables were compared using t-test or nonparametric tests.
c Order variables were compared using chi-square and Fischer tests.
5. Discussion
In the present study, conducted to determine the predictive value of QRS complex morphology in therapeutic response to CRT, it was observed that there was no significant relationship between the presence of a notch in the QRS complex of patients and the rate of clinical response to CRT based on NYHA function class and echocardiographic response, as measured by improvement in LVESV or LVEF. These findings align with those of the study conducted by Nesti et al. (13), who reported no significant relationship. However, in contrast to these findings, Pan et al. (15) observed that the presence of a notch in lateral leads had a positive predictive value for response to CRT. The results of the present study also did not align with those reported by Assadian Rad et al. (16), who concluded that the absence of fragmented QRS (fQRS) was a predictive criterion for response to CRT.
The CRT is considered an important non-pharmacological treatment option for treating patients with chronic congestive HF and wide QRS who are under sufficient medical treatment (17). Many studies have indicated an improvement in NYHA function class, quality of life, and right ventricular function following CRT implantation (18-20). In the present study, a general improvement in the patients’ status was also observed after CRT implantation. The CRT implantation is currently recommended according to QRS duration (17). Despite the fact that patients are selected based on the current criteria for treatment with CRT, a significant portion of patients do not respond to CRT properly (12). The CRT-related results from numerous studies indicate that 30 - 40% of patients do not respond to treatment with CRT (21). Another study evaluated the predictive value of QRS fragmentation on clinical events in patients undergoing CRT and found significant prognostic value for all-cause mortality and HF hospitalization, indicating that this group of patients needs close observation (22).
The results of the present study, however, are in agreement with previous studies, especially regarding the response based on clinical symptoms and improvement in NYHA function class, which is acceptable such that more than 90% of patients responded positively to CRT, and a significant number of patients were responders regarding echocardiographic criteria. Since this issue has been addressed in numerous studies, precise determination of predictive criteria for failure to respond to CRT and poor results in patients with HF treated with CRT remains challenging. Unnatural QRS morphologies, such as notched QRS, can be a good predictor for the rate of response to treatment with CRT (15, 23). Since nQRS is commonly observed among patients with structural changes in the heart and ventricular conduction disorder, it has received less attention before. In thin QRS complexes (less than 120 ms), the presence of an extra R (R’) or notch in the R or S wave, or more than one R’ wave in more than two consecutive leads, is defined as fQRS, which indicates the presence of previous scars and is associated with poor prognosis (24). The fQRS is a criterion for local cardiac conduction delay, and it has been indicated that it can be related to intraventricular systolic dyssynchrony in patients with non-ischemic dilated cardiomyopathy with thin QRS complex (25); therefore, it can be utilized as a criterion for determining patients who benefit from CRT (26, 27).
Although the relationship between QRS morphology and the rate of response to CRT was confirmed in some studies, there are others, like the present one, that have not confirmed such a relationship (28, 29). This can be attributed to the interference of various factors such as the study patients, differences in the time of evaluating the response to CRT, measurement error in electrocardiogram and echocardiography, and the presence of unknown interfering factors. Moreover, nQRS is caused by ventricular myocardium scar and is a function of the location and size of the scar (30). Therefore, differences among patients can affect the result of response to CRT.
5.1. Conclusions
The present study aimed to evaluate the predictive value of QRS complex morphology regarding the presence or absence of a notch and its location in the leads of the electrocardiogram and response to cardiac resynchronization device therapy. Investigating the patients before and six months after CRT implantation indicated that there was no significant relationship between the presence of a notch and its location in the QRS complex and the rate of response to CRT based on NYHA function class improvement and echocardiographic response. The latter mechanism regarding eliminating the conduction delay to the lateral wall of the heart, even in the presence of scars or other causes that lead to notching in QRS, could have positive effects on the mechanism of cardiac contraction by coordinating the onset of action potentials in the two ventricles. Overall, CRT could be recommended to all HF patients with LBBB. Investigating the effect of cardiac conduction system pacing on cardiac function in patients with fQRS is also suggested for future research.
5.2. Limitations
Like other studies, the present study has limitations, which include failure to investigate the presence of fibrotic tissue as a cause of QRS notching by imaging methods. Also, the small sample size could affect the response evaluation.