
1. Background
Diabetes is a major metabolic disorder worldwide. The International Diabetes Federation and the World Health Organization estimate that over 800 million adults live with diabetes, a number that has quadrupled since 1990, now comprising nearly 14% of the adult population. This figure may rise to 853 million by 2050 (1, 2). In Iran, the adult type 2 diabetes (T2D) burden stands at about 11.4%, but some investigations identify figures approaching 24% among the over-40 age group, and future decades will likely see the rate climb further (1, 3). The T2D remains a chief vector for cardiovascular complications, neuropathy, and retinopathy, and is associated with a marked shortening of life (4). Psychological costs are rising: A cross-country study shows that 77% of patients experience mental disorders related to their condition, with diabetes burnout reaching 80%. Ongoing demands, dietary adjustments, and glucose monitoring lead to treatment lapses and negative health outcomes. Limited access to specialist evaluations and coordinated management exacerbates the challenges in lower-resource healthcare systems (5-7). Proficient diabetes self-management relies on individual, behavioral, and environmental interactions, which are crucial for better clinical outcomes (8). Within this management process, self-efficacy — defined as an individual’s belief in their ability to successfully engage in targeted health behaviors — serves as the primary catalyst for meaningful change (9). Nurses and other healthcare professionals leverage this conviction to assist patients in adopting self-care routines that promote health and discourage those that may be detrimental (10, 11). Given the rising burden of diabetes in Iran, enhancing patient self-efficacy could alleviate pressures on health systems and improve metabolic control (12). Among the methods for fostering efficacy, follow-up care delivered in patients’ homes is noteworthy, as it shifts proactive management beyond the clinical setting into daily routines (9). Home care educates and empowers family caregivers to assist patients in managing their health independently (13-16). This approach is regarded as the best method for instruction and reinforcement, fostering natural exchanges among patients, families, and nurses (16). Community health nurses provide home care services, ensure safety, and advance the health of the diabetic population (16, 17). Since bolstering self-efficacy is essential to effective diabetes self-management, we must prioritize strategies that strengthen this capability (18). Existing literature indicates that a significant number of diabetes patients exhibit low self-efficacy (16).
2. Objectives
The present study aims to evaluate the impact of a structured home care intervention on self-efficacy among Iranian adults with T2D, considering the established benefits of home care programs and the limited research surrounding their effects.
3. Methods
This trial employed a parallel-group, randomized, controlled, pretest-posttest design, conducted in 2019 as a project for a master’s thesis, and received ethical clearance from Hamadan University’s Medical Sciences Committee (IR.UMSHA.REC.1397.769). The work is listed in the Iranian Registry of Clinical Trials (IRCT20120215009014N263). Enrollment utilized consecutive sampling of patients from Hamadan’s Diabetes Research Center from January through December 2019. Eligible individuals were (A) diagnosed with T2D by a physician; (B) 30 to 70 years old; (C) living with T2D for at least six months; (D) free of acute diabetes complications; (E) free of serious psychiatric disorders, including major depression and eating disorders; (F) not receiving any psychological intervention in the prior year; and (G) not following a restricted diet influenced by other medical issues. The exclusion criteria were: (A) use of psychedelics; (B) substance abuse (alcohol or opioid) during the study period; and (C) patient death. A total of 110 patients were assessed, of whom 80 met the inclusion criteria. Thirty patients were excluded due to lack of inclusion criteria (n = 20) or unwillingness to participate (n = 10). The required sample size was calculated to be 37 participants per group using G*Power software. Parameters included a two-tailed significance level of 0.05, a statistical power of 0.80, and an expected large effect size (Cohen’s d = 0.80) based on previous research in similar populations (19, 20). To account for a potential 10% attrition rate, the final target sample size was increased to 40 participants per group.
Data were collected using a two-part questionnaire. The first part included items on demographic characteristics and features of the disease: Age, gender, marital status, occupation, level of education, Body Mass Index (BMI), income, treatments received, and family history of diabetes. The second part was the Diabetes Management Self-efficacy Scale (DMSES). The DMSES is a standard questionnaire developed by Bijl et al. (21) in collaboration with international research teams. The assessment includes 20 questions on diet management (8 items), physical activity (4 items), medication (3 items), and blood sugar levels (4 items). Responses are scored on an 11-point Likert scale from 0 (“Cannot do at all”) to 10 (“Certainly can do”), resulting in an overall score from 0 to 200. Higher scores indicate greater self-efficacy: Below 80 signifies low confidence, 80 to 140 reflects moderate confidence, and above 140 shows strong confidence in managing diet, physical activity, medication, and blood glucose monitoring. The reliability of the Iranian version of the DMSES was reported as 0.83, determined by Cronbach’s alpha in a study by Haghayegh et al. (22). We assessed the reliability of the DMSES in the new research environment by measuring internal consistency using Cronbach’s alpha among 30 individuals diagnosed with T2D. The overall alpha for the composite scale was 0.91, indicating excellent reliability. Dimension-specific alphas were 0.63 for self-monitoring, 0.75 for medication adherence, 0.70 for activity practices, and 0.94 for dietary management, reflecting acceptable to strong consistency across subdomains. Ethical and procedural approvals were obtained from the Vice-Chancellor for Research and the Ethics Committee of Hamadan University of Medical Sciences. Patients were recruited from the Hamadan-based Diabetes Research Center. Eighty eligible individuals were randomized into an intervention or control group, with 40 assigned to each using a permuted block strategy. Allocation sequences were generated off-site from a computer-based random number list. Although blinding participants and the investigator was impractical due to the nature of the intervention, analysts remained blind to group assignments. All subjects received a pre-intervention briefing on the study’s design and purpose, and written informed consent was obtained prior to enrollment. Each participant completed the questionnaire under the supervision of the researcher, who clarified items as needed to ensure uniformity in instructions. Subsequent stages of the protocol, including initial assessments, implementation of the home care intervention, and follow-up evaluations, were conducted by the same researcher — a community health nurse with specialized training — to minimize variability in execution. An external data analyst managed data entry, organization, and statistical analysis, accessing only coded information to maintain blinding from group designations. Patients in the intervention group received a home care training program based on validated nursing texts, journals, and standards (23-25). The program was implemented during home visits organized by the researcher. The educational content, developed as a booklet, received approval from diabetes education experts at Hamadan University of Medical Sciences. It included two face-to-face training sessions and two telephone follow-ups, each lasting 40 minutes, over one month. The training covered both theoretical and practical components, utilizing the booklet, posters, videos, and a medical manikin, with at least one family member present (preferably the primary caregiver). During home visits and follow-ups, some patients provided informal feedback on their diabetes management experiences. Although these comments were not part of the structured questionnaire, representative remarks are included in the Discussion to illustrate the challenges faced by patients.
The self-efficacy outcome was measured again two months following the conclusion of the intervention (26). Patients from both groups completed questionnaires at the Diabetes Research Center. Data were analyzed using SPSS Statistics, version 16.0. The Kolmogorov-Smirnov test assessed the normality of variable distributions. A one-way univariate analysis of covariance (ANCOVA) controlled for age differences, as the mean age was higher in the control group. All ANCOVA assumptions were verified, including the equality of regression slopes. Within-group changes from pre-test to post-test were analyzed using paired-samples t-tests. Missing responses were addressed through multiple imputation, generating five complete datasets using the Markov Chain Monte Carlo method. The effect size of the intervention was calculated as Cohen’s d for primary outcomes. Statistical significance was set at P < 0.05.
4. Results
The mean age of the patients was 54.73 ± 7.80 years in the intervention group and 58.95 ± 7.84 years in the control group (P = 0.018). Most patients were female, married, homemakers, had higher education, and were receiving oral medication. Most patients in the intervention group had moderate income, while most in the control group had low income. The mean BMI was 27.68 ± 3.95 in the intervention group and 26.93 ± 4.10 in the control group. A family history of diabetes was present in most of the patients in the control group and in half of the patients in the intervention group. Overall, missing data accounted for 0% of all observations. These were addressed using multiple imputation with five iterations of the MCMC method, as described in the methods section. After imputation, all participants (n = 80) were included in the final analyses. Table 1 presents a comparison of the frequency of demographic characteristics between the intervention and control groups. Additionally, Figure 1 illustrates the CONSORT flow diagram of participants through each stage of the randomized controlled trial.
Table 1.
Comparison of the Frequency of Demographic Characteristics Between the Intervention and Control Groups Before the Intervention a
| Variables | Control Group (N = 40) | Intervention Group (N = 40) | Test Statistics | P-Value |
|---|---|---|---|---|
| Gender | 0.058 b | 0.809 | ||
| Female | 27 (67.5) | 28 (70) | ||
| Male | 13 (32.5) | 12 (30) | ||
| Marital status | 1.06 c | 0.580 | ||
| Single | 0 (0) | 1 (2.5) | ||
| Married | 34 (85) | 34 (85) | ||
| Widow | 6 (15) | 5 (12.5) | ||
| Occupation | 2.75 c | 0.456 | ||
| Employee | 2 (5) | 0 (0) | ||
| Retired | 9 (22.5) | 6 (15) | ||
| Homemaker | 24 (60) | 27 (67.5) | ||
| Self-employed | 5 (12.5) | 7 (17.5) | ||
| Level of education | 2.73 c | 0.548 | ||
| Primary education | 31 (77.5) | 33 (82.5) | ||
| Diploma | 7 (17.5) | 6 (15) | ||
| Associate degree | 2 (5) | 0 (0) | ||
| Higher education | 0 (0) | 1 (2.5) | ||
| Family income | 5.39 c | 0.076 | ||
| Low | 21 (52.5) | 15 (37.5) | ||
| Moderate | 18 (45) | 18 (45) | ||
| High | 1 (2.5) | 7 (17.5) | ||
| Current treatment of diabetes | 5.29 c | 0.061 | ||
| Oral medicine | 22 (55) | 24 (60) | ||
| Insulin therapy | 1 (2.5) | 6 (15) | ||
| Both | 17 (42.5) | 10 (25) | ||
| Family history of diabetes | 2.52 b | 0.112 | ||
| Yes | 27 (67.5) | 20 (50) | ||
| No | 13 (32.5) | 20 (50) |
a Values are expressed as No. (%).
b Chi-squared test.
c Fisher’s exact test.
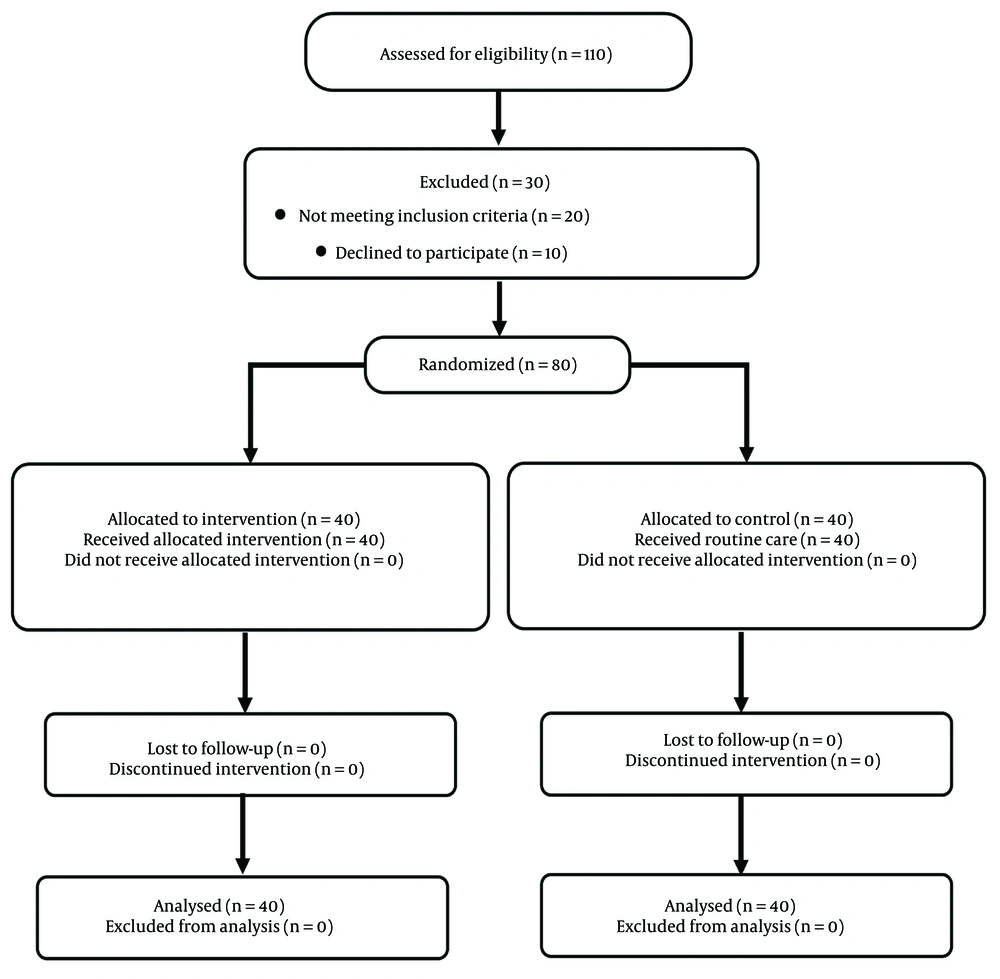
Figure 1.
CONSORT flow diagram of participants through each stage of the randomized controlled trial
The intervention had a large effect on total self-efficacy (partial η2 = 0.177, 95% CI: 0.066 to 1.000), as well as on physical activity (partial η2 = 0.205, 95% CI: 0.086 to 1.000) and blood sugar measurement (partial η2 = 0.228, 95% CI: 0.104 to 1.000). The effect sizes for diet adherence (partial η2 = 0.080, 95% CI: 0.010 to 1.000) and medication use (partial η2 = 0.007, 95% CI: 0.000 to 1.000) were small. The sample size had been determined a priori to detect a large effect (partial η2 ≈ 0.14) with 80% power at a two-sided α = 0.05. Post-hoc power analysis indicated that the study retained > 80% power to detect the observed effects in total self-efficacy and the main behavioral outcomes. The results of the ANCOVA showed that the mean scores of diet adherence (P = 0.002), physical activity (P < 0.001), medication use (P < 0.001), blood sugar measurement (P < 0.001), and total self-efficacy (P < 0.001) were statistically different between the two groups before the intervention. After the intervention, the mean scores of self-efficacy were higher in the intervention group than in the control group, as there was a statistically significant difference in the mean scores of physical activity (P = 0.003), blood sugar measurement (P < 0.001), and total self-efficacy (P < 0.001) between the two groups after the intervention. However, the mean scores of diet adherence (P = 0.177) and medication use (P = 0.474) were the same between both groups (Table 2).
Table 2.
Mean Scores of Self-efficacies Between the Among the Patients After Intervention a
| Scales; Score Range | Intervention Group | Control Group | ANCOVA Test Statistics (F-Value) | P-Value |
|---|---|---|---|---|
| Adherence to diet (8 items); 0 - 80 | ||||
| Before the intervention | 47.63 ± 9.52 | 53.77 ± 8.63 | 10.78 | 0.002 |
| After the intervention | 56.33 ± 5.65 | 53.75 ± 6.68 | 1.86 | 0.177 |
| t-value | -9.26 | 0.02 | - | - |
| P-value | < 0.001 | 0.982 | - | - |
| Physical activity rate (4 items); 0 - 40 | ||||
| Before the intervention | 22.87 ± 4.56 | 27.00 ± 5.25 | 14.78 | < 0.001 |
| After the intervention | 28.80 ± 2.72 | 26.13 ± 3.67 | 9.62 | 0.003 |
| t-value | -10.87 | 1.20 | - | - |
| P-value | < 0.001 | 0.238 | - | - |
| Medication use (3 items); 0 - 30 | ||||
| Before the intervention | 20.95 ± 3.46 | 24.15 ± 2.69 | 17.83 | < 0.001 |
| After the intervention | 24.85 ± 2.08 | 24.53 ± 2.36 | 6.32 | 0.014 |
| t-value | -8.17 | -0.82 | - | - |
| P-value | < 0.001 | 0.419 | - | - |
| Blood sugar measurement (4 items); 0 - 40 | ||||
| Before the intervention | 27.50 ± 4.18 | 31.18 ± 2.92 | 20.36 | < 0.001 |
| After the intervention | 33.25 ± 1.58 | 31.27 ± 2.44 | 17.83 | < 0.001 |
| t-value | -10.06 | -0.22 | - | - |
| P-value | < 0.001 | 0.827 | - | - |
| Total self-efficacy; 0 - 190 | ||||
| Before the intervention | 118.95 ± 17.91 | 136.10 ± 15.50 | 21.71 | < 0.001 |
| After the intervention | 143.23 ± 10.18 | 135.67 ± 10.67 | 38.02 | < 0.001 |
| t-value | -12.23 | 0.19 | - | - |
| P-value | < 0.001 | 0.847 | - | - |
Abbreviation: ANCOVA, analysis of covariance.
a Values are expressed as mean ± standard deviation (SD).
5. Discussion
The objective of the outlined study was to assess the influence of an in-home care model on self-efficacy among individuals with T2D referred to the Diabetes Research Center in Hamadan. Literature suggests that enhancing self-efficacy is both achievable and clinically relevant in this population. Supporting evidence comes from Sahebalzamani, who reported that a structured multimedia and video teach-back approach significantly elevated self-efficacy levels in T2D patients (27). Moein et al., in a study on the effect of an empowerment program on the self-efficacy of patients with T2D, showed that the implementation of an empowerment program improved self-efficacy in these patients (28). Despite the differences in the type of intervention and the method used, the results of these studies are consistent with the results of the present study. Similarly, Eshghi Motlagh et al. found that the implementation of an educational program based on Bandura’s theory improved self-efficacy and its dimensions in pregnant women with pre-diabetes (29).
In the present study, the mean scores of self-efficacy and its dimensions were significantly higher in the control group compared to the intervention group before the intervention. This is in line with a study by Amini et al. on the effect of a home care program on therapeutic adherence in patients with T2D, which found that the mean score of patients’ therapeutic adherence was significantly different between groups (30). This may be attributed to factors such as patients’ prior knowledge, exposure to mass media, intrinsic motivation, and pre-existing information about the disease. However, the home care program increased the mean scores of total self-efficacy, physical activity, and blood sugar measurement in the intervention group. Although the home care program also increased the mean scores of diet adherence and medication use, the increase was not significant compared to the control group.
Yamamoto et al. concluded that a self-efficacy-based intervention was useful for glycemic control in patients with T2D (31). However, the results of their study are inconsistent with the results of our study, which may be due to differences in the length of follow-up, intervention type, and study methodology. The non-significant increase in the mean scores of diet adherence and medication use may be attributed to the need for a more intensive and longer intervention to achieve significant improvements in these dimensions. Additionally, financial and cultural factors, which were beyond the control of the researcher, could have influenced the study variables. For instance, one patient reported refusing to purchase medications due to financial distress and the high costs of some drugs. The results of the present study showed that the home care program had a positive effect on managing blood sugar levels. This is consistent with another study, which found that peer support within the community can improve self-efficacy and self-management behaviors in T2D patients (32). Despite the differences in the types of intervention, sampling methods, and time period of the studies, similar results were obtained in terms of total self-efficacy. In both studies, the researcher came to a common result that providing information for the patients, social support, and similar data collection tools could improve patients’ self-efficacy. However, due to the above differences, it is not possible to determine which method could be more effective. Based on the literature review, there were few studies in the area of home care. Therefore, we used the results of other interventional studies. In a study by Gurkan et al., it was found that a home-based nursing intervention program with five weeks of follow-up improved diabetes management and self-efficacy in patients with type 1 diabetes (33).
Hailu et al. showed a significant increase in knowledge and adherence to diet and foot care recommendations, although no significant difference was found in the mean score of self-efficacy between the two groups before and after the intervention (34). Khashouei et al., in a study on the effectiveness of acceptance and commitment therapy on self-efficacy in patients with T2D, indicated that the mean score of self-efficacy of patients in the intervention group significantly decreased compared to the control group after the intervention (35). In the present study, patients’ level of self-efficacy increased after the home care program. Our result is inconsistent with the results of the above study. It seems that the discrepancy in the results is due to the difference in the type of intervention and methodology between the two studies. In the study by Wichit et al., no significant relationship was found between the family-oriented program and quality of life in patients with T2D. This may be attributed to the limited number of home visits included in the program (36). In this study, strengths included direct interaction with the healthcare team, adherence to the treatment plan, tailored information and support for patient self-care, delivery of standardized information, assistance for family members managing patient stress, familiarization with support service centers, distribution of educational booklets, and implementation of telephone follow-ups.
A limitation was the reliance on self-report questionnaires for data collection. To address this, thorough explanations about the importance of honesty in survey responses were provided to patients in both groups. Future studies should consider using direct observation and interviews as alternative methodologies. Although randomization was applied, baseline imbalances were noted between groups regarding diet, physical activity, medication use, and blood sugar measurement scores. Such discrepancies may occur by chance in randomized trials, especially with small sample sizes. ANCOVA was used to adjust for these imbalances; however, some residual confounding may still exist, necessitating caution in conclusions. Additionally, exposure to informal information through media represents another limitation. While both groups had similar exposure, randomization may not fully eliminate residual effects on participants’ understanding or self-efficacy. These considerations should be taken into account in future interpretations of the results.
5.1. Conclusions
The study findings indicate that a home care program can boost self-confidence in individuals with T2D, particularly in blood sugar monitoring and physical exercise. The program also showed improvements in medication adherence and dietary compliance, though these were less pronounced and not statistically significant. Thus, home care programs are valuable additions to standard clinical management. Integrating systematic, home-delivered education and regular monitoring into T2D care pathways provides a practical approach for healthcare practitioners to enhance patients’ self-management skills and support family members in chronic care. Further validation over longer periods and larger cohorts is needed to strengthen the evidence base.