
1. Introduction
Ischemic heart disease (IHD) is a prevalent global health condition that affects millions of families worldwide, placing a substantial economic burden on health systems (1, 2). Most patients are cared for at home by family members who have voluntarily assumed the caregiver role, shifting disease management from clinical to domestic settings (3, 4). These informal caregivers are indispensable, maintaining patient stability and reducing readmission rates (4).
However, caregivers endure significant physical and psychological pressures, often experiencing fatigue, anxiety, burnout, and social isolation (5-7). Research shows cardiac patient caregivers face higher caregiver burden, psychological stress, and social isolation than other groups (8), potentially leading to emotional exhaustion and reduced care quality (9).
Most educational programs for caregivers focus on transferring clinical knowledge (10), failing to address internal pressures or enhance their sense of meaning and control. Caregivers need inner power, social support, and a sense of worth. This underscores the importance of empowerment approaches. In response to these challenges, some studies have explored targeted interventions. For example, research published in the Jundishapur Journal of Chronic Disease Care has shown that family-centered empowerment programs can effectively reduce burden and improve quality of life for caregivers of patients with heart failure (11), and that supportive-educational interventions can decrease caregiver strain (12). However, while these studies address burden and strain, the specific impact of interventions designed to enhance spiritual care and social support—key components of a caregiver’s inner resilience—remains less explored.
In this study, we investigated the effect of an empowerment program on caregiver burden, spiritual care, and social support in IHD patient caregivers, aiming to improve their health and quality of life. We hypothesized that the intervention would significantly reduce caregiver burden and increase spiritual care and social support compared to the control group, with effects sustained at one-month follow-up.
2. Methods
This quasi-experimental study was conducted from 2024 to 2025 in the cardiac department of Ayatollah Taleghani Hospital, Shahid Beheshti University of Medical Sciences, Tehran, Iran. The study received ethical approval (IR.SBMU.PHNS.REC.1403.028). The study included informal primary caregivers of patients with a definitive diagnosis of chronic IHD. This study was submitted to the Iranian Registry of Clinical Trials (IRCT), but was determined to be ineligible for a clinical trial registration code due to its quasi-experimental, non-randomized design.
2.1. Study Design and Participant Allocation
Participants were selected via purposive sampling. To minimize selection bias and historical effects, a consecutive allocation method was employed. The first 40 eligible caregivers who consented to participate between May 1, 2024, and July 31, 2024, were allocated to the intervention group. The subsequent 40 eligible caregivers who consented between August 1, 2024, and October 31, 2024, were allocated to the non-equivalent control group. Both groups were consecutively recruited from the same cardiac ward during the same overall study period. This non-randomized design was chosen due to practical constraints of group session scheduling. The intervention group received the SCT program; the control group received routine hospital care. Inclusion criteria for caregivers were age ≥18 years, primary informal caregiver providing ≥20 hours of care per week, and at least six months since the patient’s IHD diagnosis. Exclusion criteria were severe mental illness, cognitive impairment (MMSE score <24), or caring for another patient with a chronic disease.
The sample size was calculated a priori. Based on a pilot study, an effect size (d) of 0.8 was anticipated for the primary outcome of caregiver burden. With α = 0.05 and power (1 - β) = 0.80, a sample size of 26 per group was calculated. To account for a potential 30% attrition rate, this was increased to 35 per group. We ultimately recruited 40 per group, which further strengthened the study’s power.
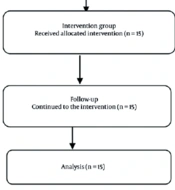
In this quasi-experimental study, 40 caregivers were assigned to the intervention group via purposive sampling based on their availability for group sessions. A non-equivalent control group, comprising 40 caregivers, was recruited consecutively from the same ward. The intervention group received the SCT-based empowerment program, while the control group continued with routine hospital care. A flow diagram (Figure 1) provides a detailed overview of participant allocation.
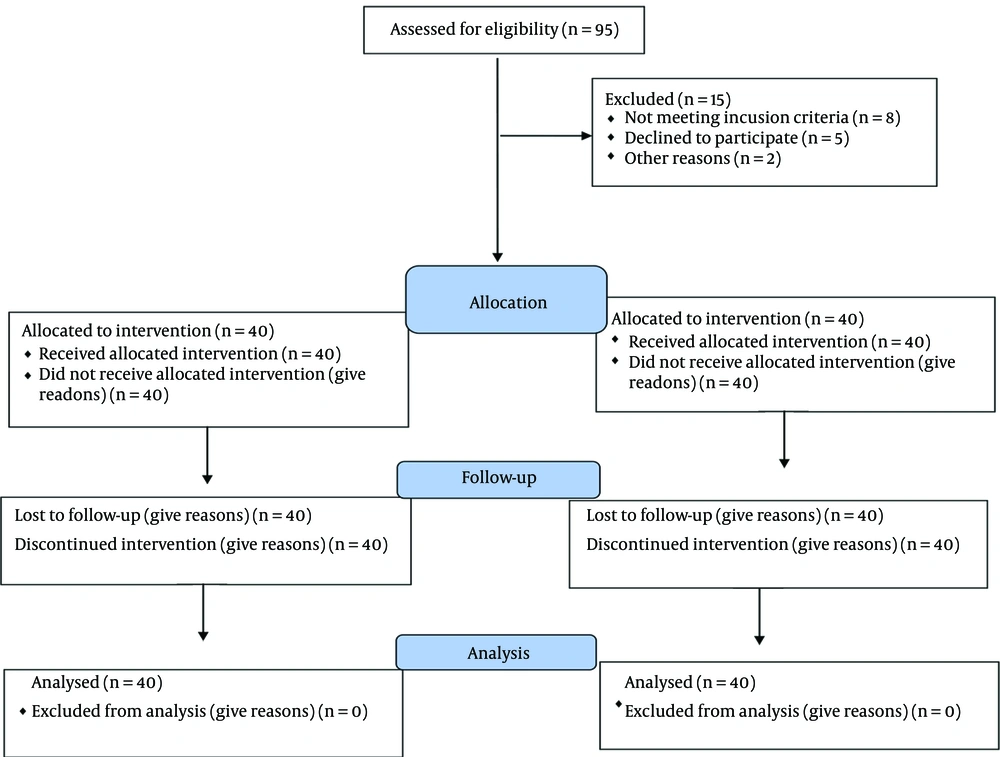
Figure 1.
CONSORT flow diagram of participant recruitment, allocation, follow-up, and analysis throughout the study
2.2. Theoretical Framework
This study was grounded in Bandura’s social cognitive theory (SCT), a comprehensive model for behavior change that emphasizes the continuous interaction among individuals, the environment, and past experiences (13, 14). A core tenet of SCT is self-efficacy—an individual’s belief in their capability to execute behaviors required to produce specific performance attainments. When individuals believe they can perform required behaviors, this forms the foundation for psychological stability and effective performance (15). We theorized that by enhancing self-efficacy through mastery experiences, vicarious learning, and verbal persuasion—key constructs of SCT—caregivers would feel more in control, thereby reducing their burden and having the psychological space to seek spiritual and social support (Figure 2). Furthermore, we posit that SCT constructs, particularly cognitive reappraisal and enhanced self-efficacy, provide a theoretical foundation for improving spiritual care. By reframing stressful caregiving situations and gaining confidence in their abilities, caregivers may find greater meaning and purpose, which are core components of spiritual health (Figure 2).
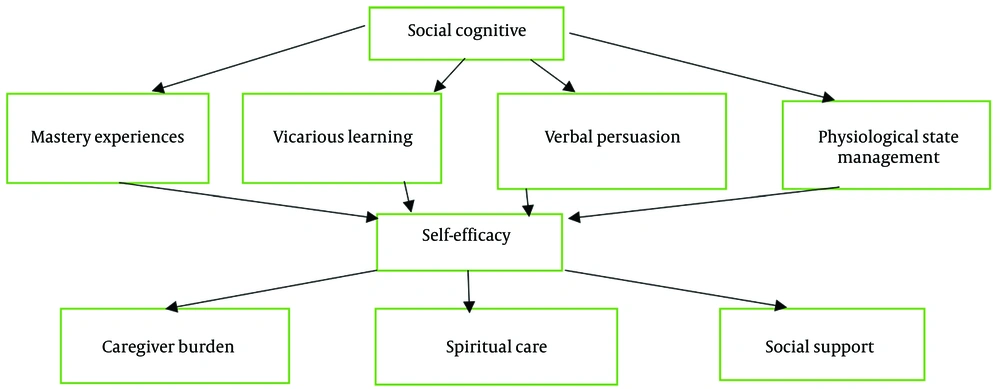
Figure 2.
A conceptual model is presented
2.3. Intervention
Social cognitive theory-based interventions use observation, modeling, and positive feedback to enhance caregivers’ sense of control, meaning, and self-confidence. The detailed, session-by-session content of the intervention is provided in Table 1. In brief, the intervention consisted of five 90-minute weekly sessions based on SCT constructs: IHD education, reducing caregiver burden, enhancing social support, increasing spiritual care, and improving self-efficacy. Session attendance was monitored, with a mean attendance rate of 95% across all five sessions. Fidelity was monitored through session checklists completed by the facilitator and random observation by the principal investigator (Table 1).
Table 1.
Session-by-Session Content of the Social Cognitive Theory-Based Intervention
| Variables | Main Topic | Target SCT Construct(s) | Main Activities and Materials | Homework Assignment |
|---|---|---|---|---|
| 1 | Introduction and Disease Education | Social Support, Mastery Experiences | Group introductions and program overview; PowerPoint presentation on IHD nature, symptoms, and lifestyle management; group discussion on daily caregiving challenges; setting small achievable personal goals for the week. | Identify and write down one caregiving challenge and one small goal to manage it. |
| 2 | Managing Caregiver Burden | Vicarious Learning, Verbal Persuasion | Sharing homework assignments; role-playing stressful scenarios; 4-step problem-solving technique training; positive feedback and encouragement from group members and the facilitator. | Use the problem-solving technique for a real-life challenge and record the outcome. |
| 3 | Enhancing Social Support | Mastery Experiences, Physiological State Management | Group discussion on available social support resources and barriers to asking for help; practicing effective sentences for asking for help; small-group role-playing; deep breathing technique training. | Ask for help from at least one person in the coming week and record their reaction. |
| 4 | Promoting Spiritual Care | Physiological State Management, Cognitive Reappraisal | Group discussion on finding meaning and purpose in the caregiver role; guided 10-minute meditation practice; journaling about positive or challenging moments from a spiritual perspective; cognitive reappraisal technique training. | Perform 5 minutes of meditation daily and write down one negative thought and its reappraisal. |
| 5 | Sustainability and Future Planning | Verbal Persuasion, Mastery Experiences | Reviewing personal achievements; developing a personal roadmap for maintaining skills; discussing potential future obstacles and coping strategies; celebrating successes and acknowledging active participation. | Place the roadmap in a visible location and review it weekly. |
Abbreviation: SCT, social cognitive theory.
2.4. Data Collection and Statistical Methods
Data were collected using demographic questionnaires, the Zarit Burden Interview (ZBI) (16), the Spiritual Well-Being Scale (SWBS) (17), and the Phillips Social Support Questionnaire (PSSQ) (18). The ZBI and SWBS were chosen for their validated Persian versions. The PSSQ, despite its narrow range, is sensitive to changes in perceived support.
Data were analyzed using SPSS 26. Normality was assessed via the Shapiro-Wilk test. Baseline characteristics were compared using independent t-tests and chi-square tests. The primary analysis used ANCOVA, with the follow-up score as the dependent variable, group as the independent variable, and the baseline score as a covariate. Effect sizes were reported as Cohen’s d with 95% confidence intervals, and significance was set at P < 0.05.
3. Results
3.1. Participant Flow and Baseline Characteristics
Of 95 caregivers screened, 80 were allocated to either the intervention (n = 40) or control group (n = 40). All 80 completed the post-intervention assessment, and 78 completed the one-month follow-up. Analysis was conducted on an intention-to-treat (ITT) basis for all 80 participants. As shown in Table 2, the groups were demographically homogeneous at baseline, with no significant differences in caregiver burden, spiritual care, or social support (P > 0.05).
Table 2.
Demographic and caregiving characteristics of the test and control groups a
| Variables | Intervention Group (n = 40) | Control Group (n = 40) | Test Statistic | P-Value |
|---|---|---|---|---|
| Mean age (y) | 49.8 ± 10.7 | 51.2 ± 11.3 | t = 0.56 | 0.57 |
| Gender | χ² = 0.22 | 0.64 | ||
| Female | 28 (70) | 30 (75) | ||
| Male | 12 (30) | 10 (25) | ||
| Marital status | χ² = 0.09 | 0.77 | ||
| Married | 34 (85) | 33 (82.5) | ||
| Single/other | 6 (15) | 7 (17.5) | ||
| Education | χ² = 0.18 | 0.91 | ||
| Elementary | 6 (15) | 7 (17.5) | ||
| Diploma | 15 (37.5) | 14 (35) | ||
| Bachelor and above | 19 (47.5) | 19 (47.5) | ||
| Caregiver's occupation | χ² = 0.28 | 0.87 | ||
| Homemaker | 20 (50) | 22 (55) | ||
| Employed | 14 (35) | 12 (30) | ||
| Retired/other | 6 (15) | 6 (15) | ||
| Relationship with patient | χ² = 0.36 | 0.72 | ||
| Spouse | 23 (57.5) | 25 (62.5) | ||
| Child | 12 (30) | 10 (25) | ||
| Sibling/other | 5 (12.5) | 5 (12.5) | ||
| Duration of care (mon) | 26.1 ± 9.3 | 27.5 ± 10.2 | t = 0.65 | 0.52 |
| Weekly hours of care | 47.2 ± 15.6 | 45.8 ± 14.9 | t = 0.38 | 0.70 |
a Values are presented as No. (%) unless otherwise indicated.
3.2. Primary Intervention Effects
ANCOVA revealed significant intervention effects across all outcomes. For caregiver burden, the intervention group had significantly lower scores post-intervention (mean difference = -18.40, P < 0.001, d = 1.85) and at one-month follow-up (mean difference = -25.12, P < 0.001, d = 2.53) (Table 3).
Table 3.
Comparison of Caregiver Burden Scores Between Groups Over Time (ANCOVA, Adjusted for Baseline)
| Variables | Intervention Group (Mean ± SD) | Control Group (Mean ± SD) | Mean Difference (95% CI) | P-Value | Cohen's d |
|---|---|---|---|---|---|
| Before intervention | 60.72 ± 6.41 | 63.41 ± 6.42 | - | - | - |
| Post-intervention | 48.41 ± 5.96 | 66.81 ± 5.96 | -18.40 (-21.21, -15.59) | <0.001 | 1.85 |
| One-month follow-up | 42.43 ± 4.56 | 67.55 ± 4.56 | -25.12 (-27.95, -22.29) | <0.001 | 2.53 |
| ANCOVA results | F(1, 77) = 145.82 | <0.001 | η² = 0.65 |
For spiritual care, the intervention group scored significantly higher post-intervention (mean difference = 11.94, P < 0.001, d = 1.52), an effect maintained at follow-up (mean difference = 12.03, P < 0.001, d = 1.53) (Table 4).
Table 4.
Comparison of Spiritual Care Scores Between Groups Over Time (ANCOVA, Adjusted for Baseline)
| Variables | Intervention Group (Mean ± SD) | Control Group (Mean ± SD) | Mean Difference (95% CI) | P-Value | Cohen's d |
|---|---|---|---|---|---|
| Before intervention | 111.56 ± 6.42 | 107.49 ± 6.42 | - | - | - |
| Post-intervention | 123.87 ± 5.94 | 111.93 ± 5.94 | 11.94 (9.01, 14.87) | <0.001 | 1.52 |
| One-month follow-up | 121.54 ± 5.52 | 109.51 ± 5.52 | 12.03 (9.10, 14.96) | <0.001 | 1.53 |
| ANCOVA results | F(1, 77) = 98.45 | <0.001 | η² = 0.56 |
For social support, the intervention group also had significantly higher scores post-intervention (mean difference = 7.50, P < 0.001, d = 1.25). While the effect size decreased, it remained significant at follow-up (mean difference = 5.16, P < 0.001, d = 0.86) (Table 5).
Table 5.
Comparison of Social Support Scores Between Groups Over Time (ANCOVA, Adjusted for Baseline)
| Variables | Intervention Group (Mean ± SD) | Control Group (Mean ± SD) | Mean Difference (95% CI) | P-Value | Cohen's d |
|---|---|---|---|---|---|
| Before intervention | 15.38 ± 6.41 | 15.22 ± 6.41 | - | - | - |
| Post-intervention | 22.87 ± 5.97 | 15.37 ± 5.97 | 7.50 (5.98, 9.02) | <0.001 | 1.25 |
| One-month follow-up | 21.67 ± 4.36 | 16.51 ± 4.36 | 5.16 (3.64, 6.68) | <0.001 | 0.86 |
| ANCOVA results | F(1, 77) = 76.31 | <0.001 | η² = 0.49 |
3.3. Secondary Exploratory Analyses
Exploratory analyses revealed weak, non-significant correlations between caregiver age and burden (r = -0.19), and caregiving length and spiritual care (r = 0.16). No significant difference in baseline social support was found between genders.
4. Discussion
Our findings demonstrate that an SCT-based empowerment program effectively reduced caregiver burden and enhanced spiritual care and social support in IHD patient caregivers, with effects sustained at one month. The large effect sizes suggest both statistical and clinical significance, highlighting the superiority of self-efficacy-focused interventions over purely informational approaches.
The notably large effect sizes, particularly for caregiver burden (d > 2), should be interpreted with caution. Contributing factors may include the program’s intensive nature, the high motivation of volunteer participants, and potential expectancy or Hawthorne effects. We recommend these findings be considered preliminary evidence for confirmation in larger trials.
The significant reduction in caregiver burden aligns with SCT principles, likely strengthening self-efficacy through mastery experiences and vicarious learning (13, 14). This finding is consistent with recent Iranian studies using supportive-educational frameworks for heart failure caregivers (12), but contrasts with purely informational educational interventions that often show limited effects (10, 19). It also supports self-efficacy studies in other caregiving contexts (11, 15).
The improvement in spiritual care supports our proposition that SCT can foster spiritual well-being. By reducing burden and enhancing control, the program likely created psychological space for spiritual growth (5, 20). The group sessions provided a safe environment for sharing, a form of group spiritual care (20, 21). This aligns with research on integrating spiritual and psychological care, especially in culturally spiritual contexts such as Iran (21).
The significant increase in social support was anticipated, as SCT emphasizes environmental factors. The group sessions functioned as a supportive microsystem, allowing caregivers to build networks (10, 15). This demonstrates the effectiveness of face-to-face interventions and addresses the reported lack of social support for caregivers in chronic diseases in Iran (12, 18).
4.1. Limitations and Future Research
Limitations include the quasi-experimental, non-randomized design (risk of selection bias), single-center design (limited generalizability), reliance on self-report measures, short one-month follow-up, and lack of patient-centered outcomes or cost-effectiveness analysis. Future research should employ multicenter randomized controlled trials with larger samples, longer follow-ups, objective measures, and cost-effectiveness and patient outcome analyses.
4.2. Generalizability
Findings are most applicable to caregivers of chronic IHD patients within similar cultural contexts in Iran. Adaptation is necessary for other cultural settings or patient groups.
4.3. Conclusion
This study provides promising evidence that an SCT-based empowerment program can effectively reduce caregiver burden and enhance spiritual care and social support. Investing in informal caregivers is a humane and potentially cost-effective strategy. However, definitive policy recommendations should await confirmation from larger, long-term trials.