


1. Background
2. Objectives
3. Methods
3.1. Tissue Specimens
| Parameter | Subjects, No. (%) |
|---|---|
| Tumor stage | |
| II | 3 (15) |
| III | 12 (60) |
| IV | 5 (25) |
| Tumor grade | |
| I | 6 (30) |
| II | 3 (15) |
| III | 11 (55) |
| Tumor size (cm) | |
| ≤ 5 | 8 (40) |
| > 5 | 12 (60) |
| Histology | |
| Invasive | 4 (20) |
| Adenocarcinoma | 13 (65) |
| Carcinoma | 3 (15) |
3.2. Cell Line and Culture
3.3. Lipopolysaccharide–Induced Inflammation in AGS Cells
| Gene Name | Forward Sequence (5’-3’) | Reverse Sequence (5’-3’) | Length, bp |
|---|---|---|---|
| β-actin | GAGCATCCCCCAAAGTTCACA | GGGACTTCCTGTAACAACGCA | 103 |
| CB1R | TGAACTCCACCGTGAACC | CTGTGAACACTGGCTGCA | 169 |
| IL-1β | ACGAATCTCCGACCACC | CTCGTTATCCCATGTGTCGAAG | 184 |
| IL-6 | GTGTGAAAGCAGCAAAGAGGC | TACCTCAAACTCCAAAAGACCAGTG | 142 |
| TNF-α | AGCCCATGTTGTAGCAAACC | ATGAGGTACAGGCCCTCTGA | 135 |
3.4. RNA extraction and real-time PCR
3.5. Western Blot Analysis
3.6. 5-Bromo-2-Deoxyuridine (BrdU) Labeling Cell Proliferation Assay
3.7. Statistical Analysis
4. Results
4.1. CB1R Was Overexpressed in Human Gastric Cancer
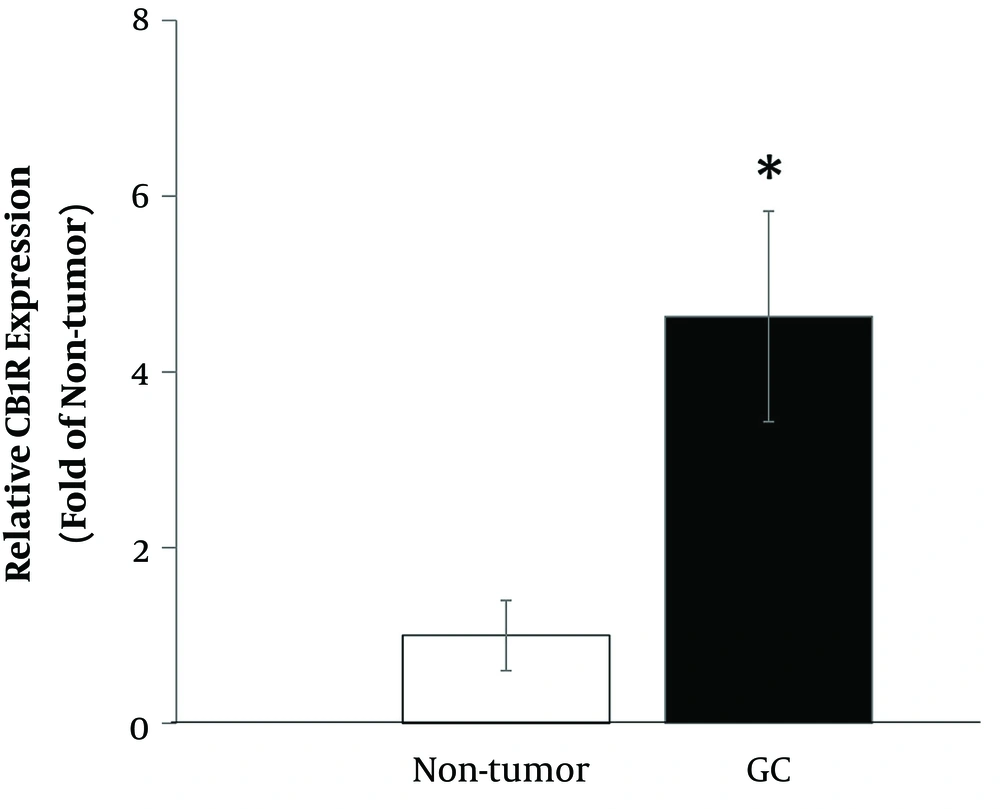
Relative expression of CB1R in gastric cancer tissues compared with normal adjacent tissues. *, P < 0.05.
4.2. Inflammation Was Induced by LPS in AGS Cells
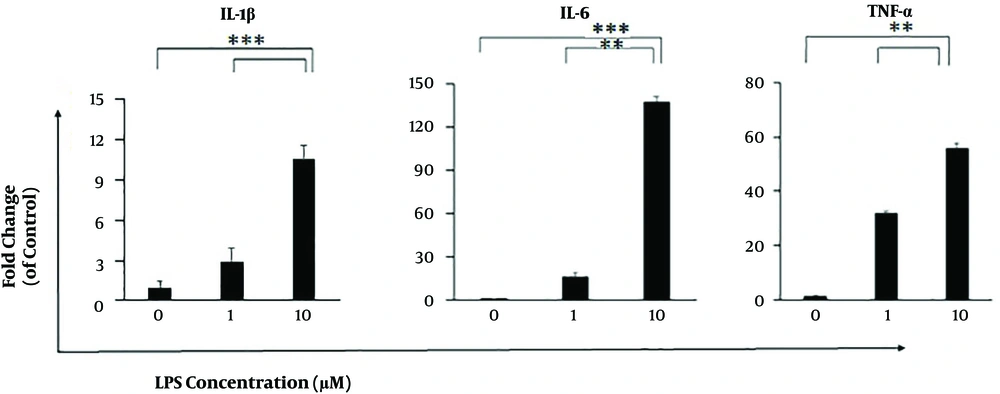
Effect of LPS stimulation on the expression of IL-1β, IL-6, and TNF-α in AGS cells. The cells were stimulated with 1 and 10 µg/mL LPS for 6 h and the expression levels of genes were evaluated using qRT-PCR analysis. Data were normalized to β-actin and were expressed as means ± SEM. All experiments were performed in triplicate. **, P < 0.01; ***, P < 0.001.
4.3. The effect of LPS Treatment on the Expression of CB1R in AGS Cells
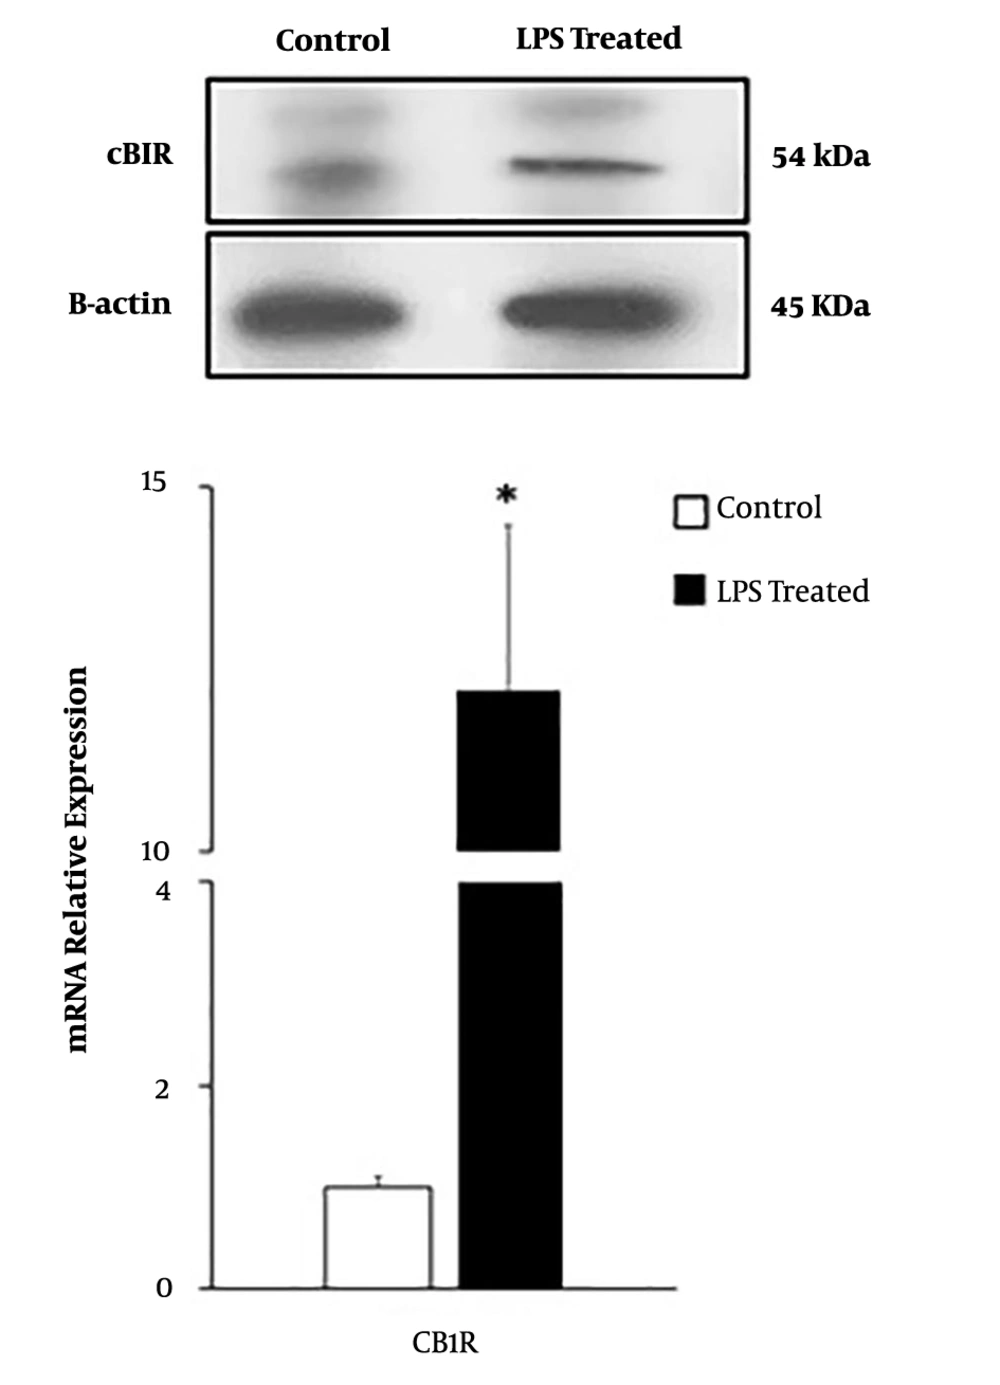
Influence of LPS on the CB1R expression in AGS cells. CB1R expression was evaluated by qRT-PCR and western blot. Data were normalized to β-actin and were expressed as means ± SEM. Each experiment was performed in triplicate. *, P < 0.05.
4.4. LPS Boosted Cell Proliferation in AGS Cells
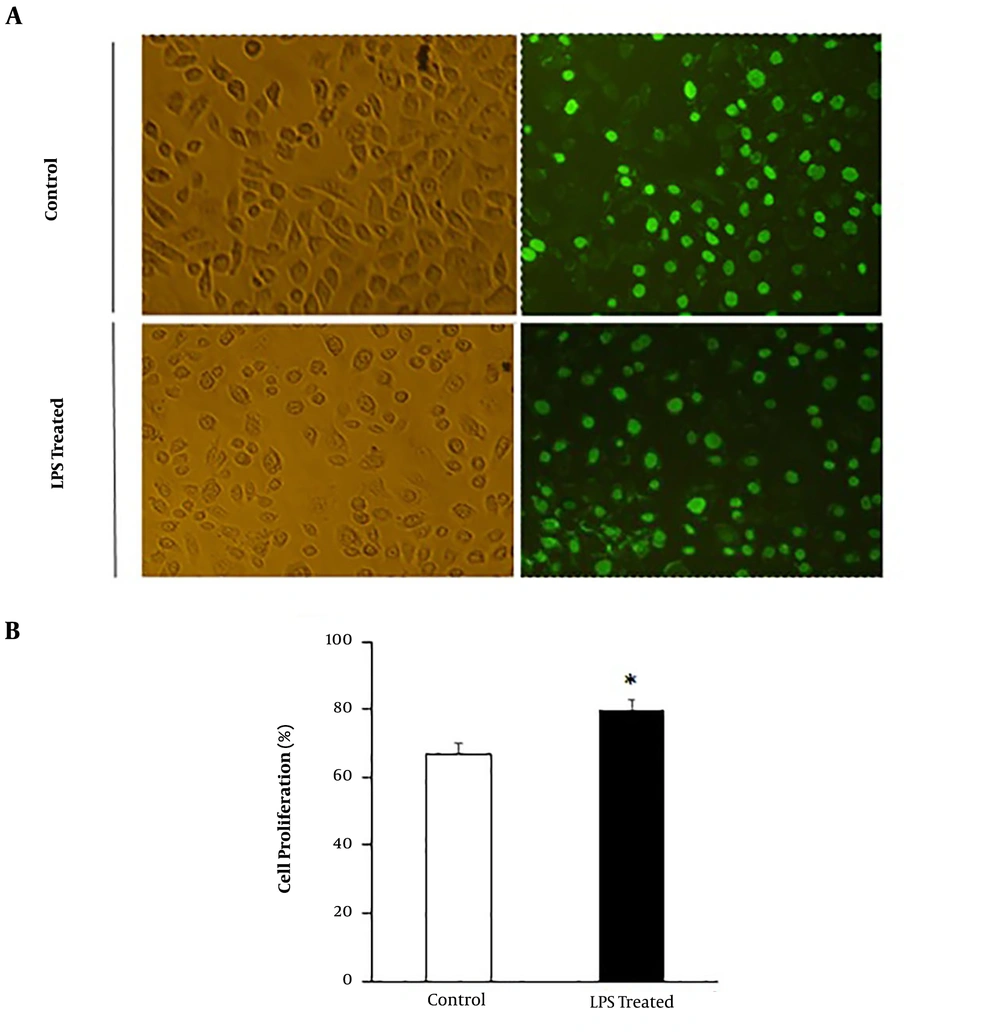
Effect of LPS treatment on cell proliferation in AGS cells. LPS treatment promoted cell proliferation in AGS cells compared with the control group. A, Representation of cell proliferation under a fluoresence microscope; B, the number of BrdU-positive staining cells was obtained by counting labeled cells per 100 cells under a fluorescence microscope in the LPS-treated group compared with the control group. Each experiment was performed in triplicate. *, P < 0.05, in comparison to the control group.
