


1. Background
2. Objectives
3. Methods
3.1. Sampling
3.2. RNA Extraction
3.3. Complementary DNA Synthesis
3.4. Primer Designing and Selection of Calibrating Genes
| Gene (Accession Number) | Beacon Designer Scores | Oligo7 Scores | Sequence | Tm (°C) | PCR Product Length (bp) |
|---|---|---|---|---|---|
| RTRAF (NM_016039.3) | 59.8 | 894 | F5'GGTTTTGACACAGGAGATGC3' | 60 | 115 |
| R5'AACAGCTACTATGGCTTCGTTG3' | |||||
| SYMPK (NM_004819.3) | 82.6 | 729 | F5'ACG GTGCTGAGGGTCATTGA3' | 60 | 146 |
| R5'GAGGGTGGGACTTTGTCTGTGA3' | |||||
| GAPDH (NM_001256799.3) | 82.5 | 769 | F5'CCACTCCTCCACCTTTGACG3' | 58 | 107 |
| R5'CCACCACCCTGTTGCTGTAG3' |
Abbreviations: TM, melting temperatures; PCR, polymerase chain reaction; PTC, papillary thyroid carcinoma; RTRAF, RNA transcription, translation, and transport factor; SYMPK, symplekin scaffold protein; GAPDH, glyceraldehyde 3-phosphate dehydrogenase.
a The beacon designer and oligo scores are displayed. Sequences of primers are provided along with melting temperatures. The length of the papillary thyroid carcinoma product is also shown.
3.5. Reverse Transcription Quantitative Polymerase Chain Reaction
3.6. Melting Curve Analysis
3.7. Statistics
4. Results
4.1. RNA Quality and Quantity Analysis
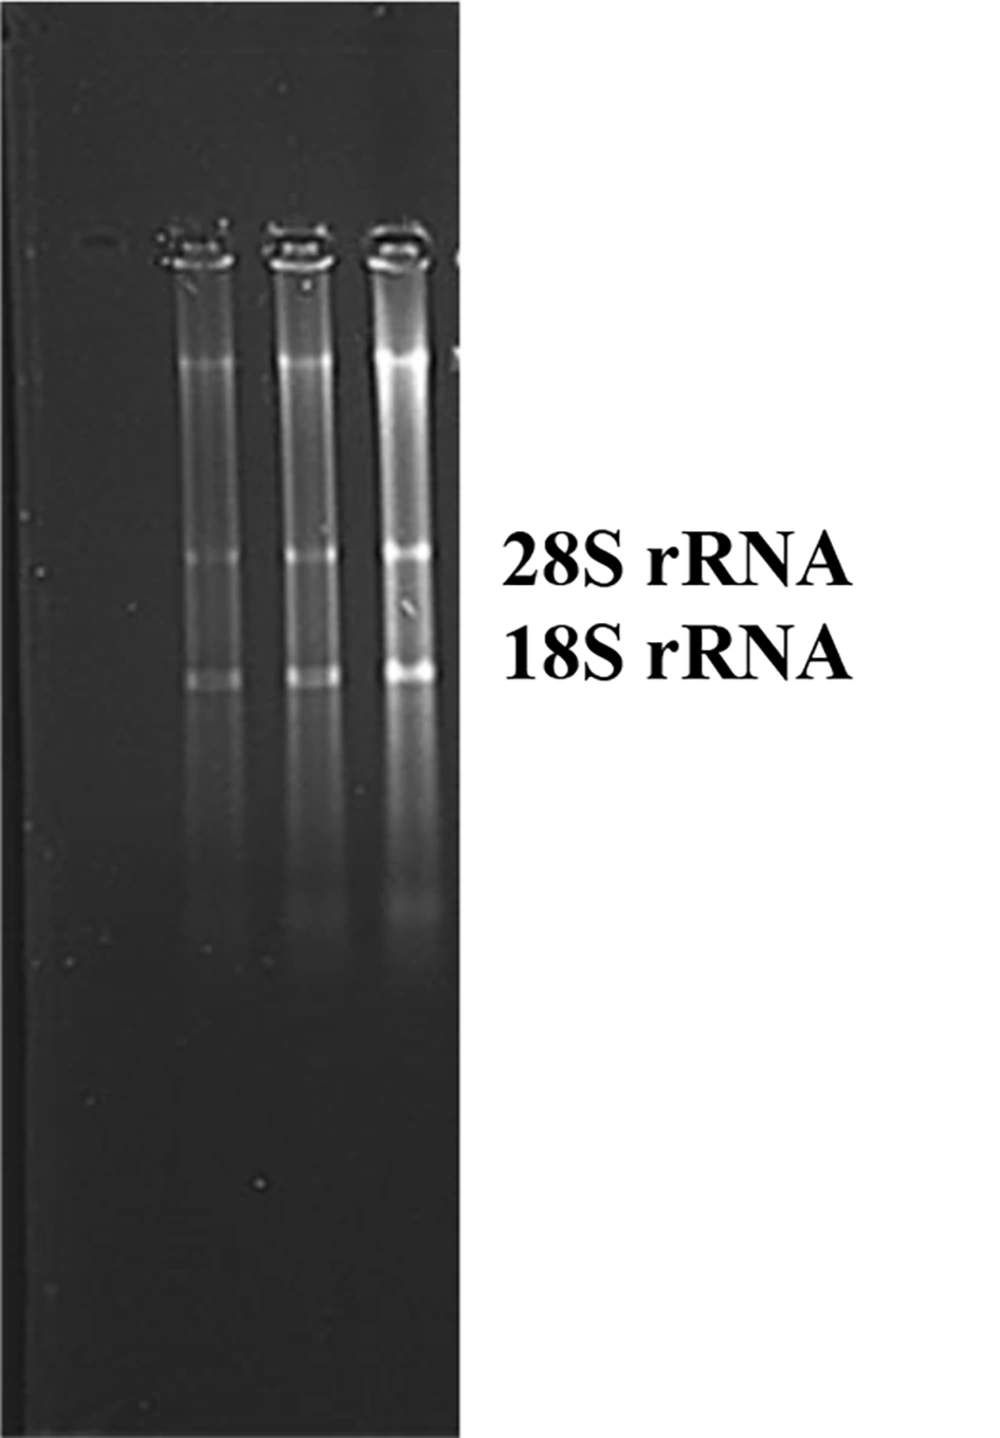
The presence of ribosomal RNA (rRNA) bands can be observed on the agarose gel. It has been verified that the extracted RNAs are in pristine condition.
4.2. Melting Curve Analysis of Reverse Transcription Quantitative Polymerase Chain Reaction Products
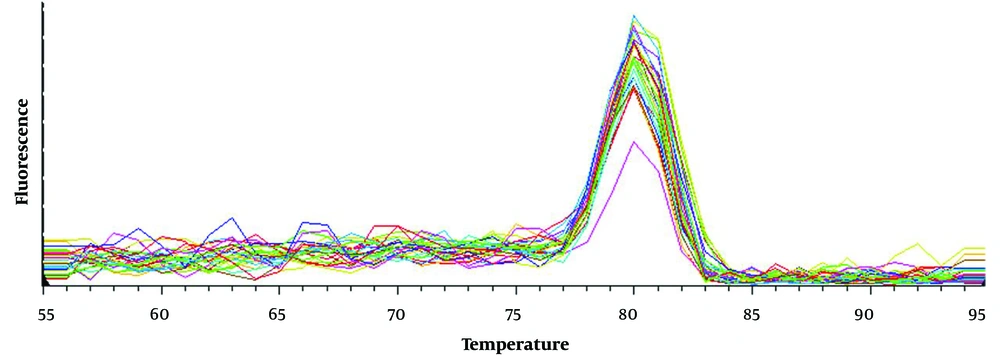
The diagram depicting the melting curve reveals a peak at 80.0°C. This image demonstrates the exceptional caliber of gene amplification of RTRAF via the utilization of exon-junction primers. The lack of any other peak indicates that the RT-qPCR failed to amplify the extracted RNAs.
4.3. Reverse Transcription Quantitative Polymerase Chain Reaction Data Analysis
| Gene | Tissue | Expression | 95% CI | P-Value | Result |
|---|---|---|---|---|---|
| RTRAF/SYMPK | Benign goiter/ adjacent normal | 0.154 | 0.001 - 13.935 | 0.002 | Downregulation |
| Malignant PTC/ adjacent normal | 0.874 | 0.006 - 97.057 | 0.808 | NS |
Abbreviations: RTRAF, RNA transcription, translation, and transport factor; SYMPK, Symplekin scaffold protein; PTC, papillary thyroid carcinoma; NS, not significant.
a The RNA Transcription, Translation, and Transport Factor gene expression is decreased in benign goiter tissues (P = 0.002) but not in PTC tissues (P = 0.808).
4.4. Correlations between RNA Transcription, Translation, and Transport Factor Gene Expression, Tumor Size, and Patient Age
| Comparison | Pearson | 95% CI | P-Value | Result |
|---|---|---|---|---|
| RTRAF expression vs. tumor size | -1.574 | -0.6849 - 0.1119 | 0.1329 | NS |
| RTRAF expression vs. age | 0.56139 | -0.3305 - 0.5422 | 0.5815 | NS |
| Tumor size vs. age | -1.3237 | -0.6541 - 0.1666 | 0.2022 | NS |
Abbreviations: RTRAF, RNA transcription, translation, and transport factor; NS, not significant.
a The expression level of the RNA Transcription, Translation, and Transport Factor is not correlated with papillary thyroid carcinoma tumor size (P = 0.1329) or patient age (P = 0.5815). Papillary thyroid carcinoma tumor size and patient age show no correlation (P = 0.2022).


