
1. Background
Sepsis is a life-threatening clinical syndrome induced by dysregulated host immune responses to various infections (1, 2). It involves a major pathological event called immunological dysregulation, which includes hyperinflammation and immunosuppression (3, 4). Mortality during the early stages of sepsis has been significantly reduced due to advances in supportive and palliative care. Currently, 70% of mortality occurs more than 5 days after the onset of sepsis, primarily because of immunosuppression and secondary infection (3, 4). Correspondingly, the latest definitions of sepsis have emphasized the main influence of immunosuppression on the lethal effect of sepsis and the importance of targeting immunosuppression (5). Despite reasonable clinical evidence, gaps still exist between our understanding and clinical practice. Particularly, individual differences lead to uncertainties about the onset and duration of the transition from a hyperinflammatory phase to an immunosuppressive phase in most patients; consequently, a deficiency in the availability of clinically effective drugs exists. Thus, new drugs that possess the dual immunomodulatory function of anti-inflammatory and anti-immunosuppressive effects should be developed.
Marine natural products with diverse chemical structures provide an abundant resource for modern drug development (6, 7). Astaxanthin (AST) is a tetraterpene that predominantly originates from marine organisms and exhibits powerful pharmacological effects (8, 9). It exerts protective roles in a septic mouse model because of its anti-inflammatory potential (10). However, its involvement in modulating immunosuppression remains largely unknown. Lipopolysaccharide (LPS), the main component and virulence factor of Gram-negative bacteria (GNB), plays a key role in sepsis pathogenesis (11, 12). Additionally, sepsis patients have similar plasma metabolites to healthy LPS-treated volunteers (13-15), thus LPS has been widely used as an inducer for sepsis models (16, 17). Macrophages play a key role throughout the sepsis process, and their dysfunction is considered one of the main causes of the transition to the immunosuppressive phase (18, 19). Thus, using an in vitro sepsis model based on LPS-treated macrophages, we further investigated the immunomodulatory properties of AST at the immunosuppressive stage of sepsis in detail.
2. Objectives
This study aimed to investigate the immunomodulatory effects of AST on immunosuppressed macrophages in vitro, focusing on its ability to restore inflammatory responses and immune function.
3. Methods
3.1. Reagents
We purchased AST and LPS from Sigma (Sigma-Aldrich, China), mouse tumor necrosis factor-alpha (TNF-α) and interleukin-6 (IL-6) ELISA kits from Neobioscience (Shenzhen, China), MTT assay, Neutral Red Uptake assay, and nitric oxide (NO) test kits from Beyotime (Shanghai, China), Trizol reagent from Invitrogen (CA, USA), TransAM™ NF-κB p65 transcription detection kit from Active Motif (CA, USA), reactive oxygen species (ROS) detection kit from US Everbright (Suzhou, China), antibody against NF-κB p65, and Alexa Fluor® 488-conjugated secondary antibody from Abcam (Shanghai, China).
3.2. Cell Culture
The macrophage cell line (RAW264.7), authenticated by short tandem repeat profiling, was cultivated in 10% FBS-DMEM at 37°C with 5% CO2. When the cells reached about 80% confluence, they were washed, subcultured, and then transferred into new cell culture bottles for incubation. Mycoplasma detection was performed before each cell experiment.
3.3. MTT Assay
Cytotoxic activity was determined using the MTT assay. After treatment, 10 μL of MTT solution (5 g/L) was added to each well, and the cells were incubated for an additional 4 hours. The culture medium was then removed, and 150 μL of dimethyl sulfoxide (DMSO) was added to each well. The plates were shaken for 10 minutes, and the absorbance of each well was measured at 570 nm using a microplate reader (Molecular Devices, CA, USA). The cell proliferation inhibition rate was then calculated.
3.4. Determination of Working Concentrations
Prior to investigating the immunomodulatory effects, the optimal non-toxic concentrations of AST and LPS were determined. The cytotoxicity of various concentrations of AST (0.25 - 8 μM) on RAW264.7 cells was evaluated using the MTT assay under both basal conditions and following LPS challenge. Based on literature reports suggesting potential toxicity at higher concentrations (20) and the need to establish effective concentrations, these preliminary tests were conducted. Similarly, the cytotoxicity of LPS was assessed (data not shown), and based on these results and literature (21, 22), a concentration of 100 ng/mL LPS was selected to induce the cell model. Based on the MTT assay results and the reported maximum human plasma concentration of AST (approximately 2.18 ± 0.17 µM) (23, 24), AST concentrations ranging from 0.25 µM to 2 µM were selected for all subsequent experiments evaluating its immunomodulatory properties.
3.5. Macrophage Bactericidal Activity
Cells were treated with AST for 12 hours followed by LPS stimulation (LPS1st). After washing twice with PBS, cells were maintained in DMEM for 2 hours followed by incubation with viable Escherichia coli (corresponding to LPS restimulation (LPS2nd), ratio cell/bacteria: 1:10) for 2 hours at 37°C. After applying the lysis buffer, the samples were incubated with MTT for 1 hour. The OD 540 of the viable bacteria from lysed macrophages reacting with MTT was recorded. The percentage of bacteria killed by macrophages was measured by establishing the standard curves of the OD corresponding to numbers of viable bacteria.
3.6. Macrophage Phagocytosis Assay
Macrophage phagocytic capacity was tested using the neutral red uptake assay. Macrophages were seeded in a 96-well plate (1 × 10⁵ cells/well) with five parallel wells and cultured overnight. The culture solution was discarded, and fresh medium containing different concentrations of fucoidan was replenished for 24 hours. After 30 minutes of incubation with macrophages, unphagocytized neutral red was removed. After washing, macrophages were incubated with lysis buffer overnight, and the absorbance value was measured at 540 nm.
3.7. Nitric Oxide Detection
The NO level of macrophages was assayed using a Griess assay-based detection kit following the manufacturer's instructions. The OD 540 was recorded, and the NO level of each sample was obtained from 5 biological replicates.
3.8. ELISA Assays
We tested the TNF-α and IL-6 levels in supernatants using ELISA kits per the provided instructions as previously published (25). The intensity of the color was recorded at 450 nm, and the inflammatory cytokine levels were obtained from 5 biological replicates.
3.9. NF-κB Activity Assay
NF-κB activity was assayed from 5 biological replicates using a DNA-binding ELISA-based assay kit following the manufacturer's (Active Motif) procedure. Furthermore, the nuclear/cytoplasmic expression of the p65 subunit was also visualized using an immunofluorescence (IF) assay under a fluorescence microscope as described previously (26).
3.10. Reactive Oxygen Species Determination
The amount of ROS was determined from 5 biological replicates using the fluorescent dye DCFH-DA (US Everbright) following our previously described procedure (27). The fluorescence intensity was detected by a fluor spectrophotometer (emission = 525 nm and excitation = 488 nm), and the final fluorescence intensity was normalized by cell counting.
3.11. RNA Isolation and Transcriptome Sequencing
Total RNAs were extracted using TRIzol following the instructions. After checking the quality, content, and integrity, the RNA sequencing libraries were generated, followed by sequencing on the Illumina NovaSeq™ 6000 platform to generate 150 bp paired-end reads. The raw sequencing data were used for quality control and subsequent bioinformatics analyses, including gene set enrichment analysis (GSEA), gene ontology (GO), and Kyoto Encyclopedia of Genes and Genomes (KEGG) pathway analyses.
3.12. Statistical Analysis
The data were shown as mean ± standard deviation of triplicates. Statistical comparisons were performed by ANOVA. P < 0.05 was considered statistically significant.
4. Results
4.1. Astaxanthin Shows No Cytotoxicity at Tested Concentrations
The effect of AST on the viability of RAW264.7 macrophages was assessed using an MTT assay. Figure 1A shows the chemical structure of AST. As shown in Figure 1B, treatment with AST at concentrations ranging from 0.25 μM to 4 μM for the duration of the experiment did not significantly affect cell viability compared to the control group under basal conditions. Furthermore, in the presence of LPS1st (100 ng/mL), AST concentrations from 0.25 μM to 2 μM also showed no significant cytotoxicity (Figure 1C). These results confirm that the AST concentrations used in subsequent functional assays were non-toxic to macrophages under the applied experimental conditions.
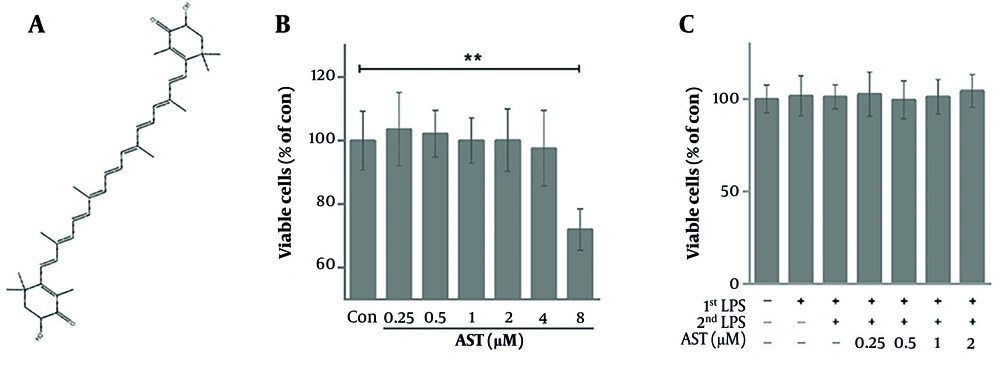
Figure 1.
Cytotoxic effect of astaxanthin (AST) on RAW264.7 cells. A, chemical structure of AST; B, RAW264.7 cells were treated with various concentrations of AST (0.25 - 8 μM) for 24 h, and cell viability was detected via the MTT assay; C, RAW264.7 cells were pretreated with AST (0.25 - 2 μM) for 24 h before lipopolysaccharide (LPS) stimulation and LPS restimulation (LPS2nd); cell viability was detected via the MTT assay. Data were presented as the mean ± SD of three independent experiments. *P < 0.05 and **P < 0.01.
4.2. Regulatory Effects of Astaxanthin on Lipopolysaccharide-Restimulation-Induced Immunosuppression of Macrophages
Although AST exerts potent anti-inflammatory effects, its role in immunosuppression is unclear. To further clarify the specific anti-septic mechanism of AST, we analyzed its effect on LPS2nd-caused macrophage immunosuppression. The results showed that AST concentration-dependently antagonized immunosuppression induced by inflammatory responses, as reflected by the increased production of inflammatory factors upon LPS2nd (Figure 2A and B). We also analyzed the NF-κB activity via an ELISA assay (Active Motif) and subcellular localization. We observed that the NF-κB activity in AST-pretreated macrophages sharply increased after LPS2nd compared to the control (Figure 2C and D), which was consistent with the results of inflammatory cytokine release. Furthermore, GSEA showed exceptional enrichment of inflammation-related (Figure 2E) and NF-κB (Figure 2F) pathways. Collectively, these results suggest that AST displays anti-immunosuppressive activities in macrophages.
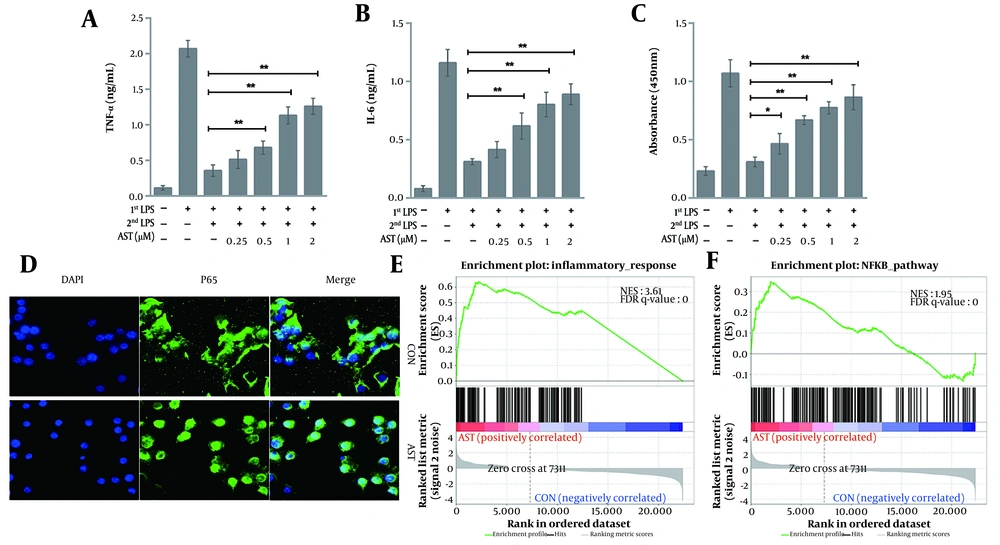
Figure 2.
RAW264.7 cells were pretreated with astaxanthin (AST) (0.25 - 2 μM) for 24 h before lipopolysaccharide (LPS) (100 ng/mL) treatment. After 12 h of LPS stimulation (LPS1st), RAW264.7 cells were washed twice, maintained in DMEM for 2 h, and subjected to LPS restimulation (LPS2nd) for another 12 h. The production of A, tumor necrosis factor-alpha (TNF-α); and B, interleukin-6 (IL-6) was then determined via ELISA; *P < 0.05 and **P < 0.01; C, NF-κB p65 DNA binding activity (NF-κB activity) was assessed using an NF-κB p65 transcription factor assay kit (Active Motif). Data were presented as the mean ± SD of three independent experiments; *P < 0.05 and **P < 0.01; D, The intracellular localization of the NF-κB subunit p65 was detected via immunofluorescence (IF) by using an anti-p65 antibody, and the nuclei were stained with DAPI. Bar = 20 μM. Gene set enrichment analysis (GSEA) showed that AST pretreatment was positively correlated with; E, inflammatory response; and F, NF-κB signaling.
4.3. Regulatory Effects of Astaxanthin on Lipopolysaccharide-Restimulation-Impaired Pathogen Clearance in Macrophages
After AST pretreatment and LPS2nd, we evaluated the scavenging capacity of macrophages. In contrast to LPS1st, LPS2nd significantly decreased the in vitro bactericidal activity of macrophages, while such effects were weakened by AST pretreatment (Figure 3A). The increased bacterial clearance could be a result of enhanced bactericidal capacity because the growth and survival of AST-pretreated macrophages did not essentially differ between LPS1st or LPS2nd (Figure 1C). We then quantified the phagocytic capacity of macrophages. The neutral red uptake assay showed a marked reduction in the phagocytic activity of LPS2nd macrophages compared with that of the LPS1st group; conversely, the reduction was largely restored by AST pretreatment (Figure 3B). We further explored AST's effects on macrophage oxidative stress. The observed changes in NO and ROS levels were mostly consistent with those of phagocytic and bactericidal activities in macrophages (Figure 3C and D). Furthermore, GSEA demonstrated the significant enrichment of phagocytosis (Figure 3E) and oxidative stress signaling (Figure 3F) pathways in AST-pretreated macrophages. Therefore, AST pretreatment rescued the pathogen clearance defect of macrophages in an immunosuppression status.
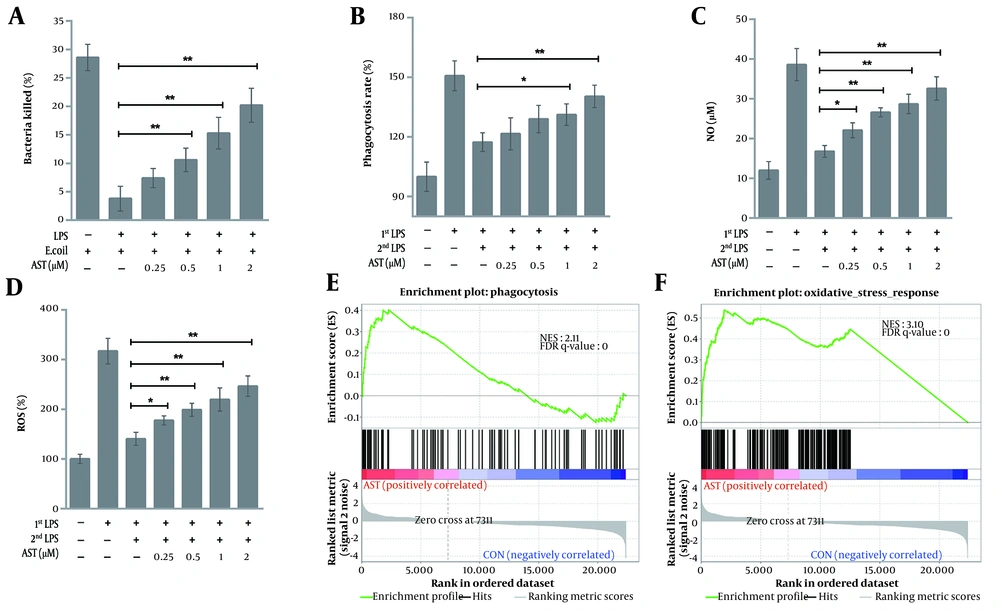
Figure 3.
RAW264.7 cells were pretreated with astaxanthin (AST) (0.25 - 2 μM) for 24 h before 100 ng/mL lipopolysaccharide (LPS) stimulation (LPS1st) and restimulation (LPS2nd) as previously described. A, the bactericidal activity of macrophages (after LPS1st) against Escherichia coli; and B, phagocytic activity were determined by MTT and neutral red uptake assays, respectively. Data were shown as the mean ± SD of three independent experiments; *P < 0.05 and **P < 0.01; C, nitric oxide (NO); and D, reactive oxygen species (ROS) levels were measured using a colorimetric assay and H2DCFDA staining, respectively. Data were presented as the mean ± SD of three independent experiments; *P < 0.05 and **P < 0.01. Gene set enrichment analysis (GSEA) validated the enhanced activity of E, phagocytosis; and F, oxidative stress in AST-pretreated macrophages.
4.4. Regulatory Effects of Astaxanthin on Several Biological Processes in Lipopolysaccharide-Restimulated Macrophages
In a subsequent study, we analyzed the transcriptional changes induced by AST in LPS-restimulated macrophages. Following the specified treatments, we prepared and subjected the total mRNAs to RNA-Seq. As shown in Figure 4A, the principal component analysis (PCA) plot displayed a clear separation of transcriptomes between AST-pretreated and AST-untreated macrophages. To identify the differentially expressed genes (DEG), we used the cutoff criteria of P < 0.05 and fold change (FC) > 2. We found that, as shown in Figure 4B, AST pretreatment resulted in 726 DEG (333 upregulated and 393 downregulated genes). The top 30 upregulated and downregulated genes are reported in Figure 4C and D, respectively. We then performed GO and KEGG analysis to investigate the biological function of the DEG. In addition to inducing inflammatory responses, oxidative stress, and phagocytic activity, differentially regulated genes in AST-pretreated macrophages participated in Hif1α signaling, autophagy pathway, cytokine-mediated signaling pathway, and especially, the activation of various immune responses (Figure 4E and F). We finally further explored the enrichment scores of the immune-associated gene sets via GSVA. Figure 4G shows that innate immune responses, lymphocyte-mediated immune responses, NK cell-mediated immune responses, and other pathways were enriched in AST-pretreated macrophages. These results suggested that AST pretreatment could trigger various cellular responses in macrophages that might contribute to its anti-immunosuppressive effects.
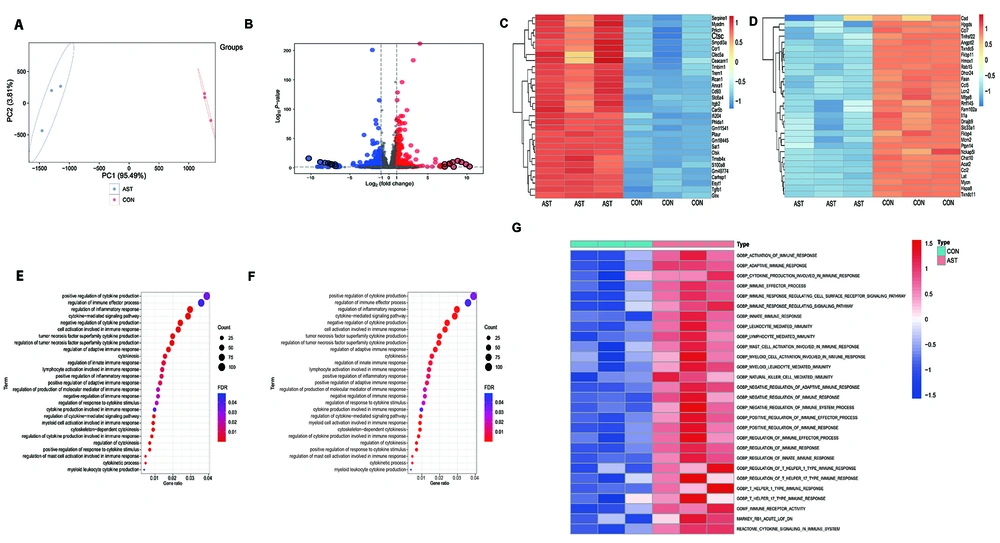
Figure 4.
RAW264.7 cells were pretreated with astaxanthin (AST) (2 μM) for 24 h before 100 ng/mL lipopolysaccharide (LPS) stimulation (LPS1st) and restimulation (LPS2nd) as previously described. After treatment, total RNA was extracted for RNA-seq and subsequent analysis. A, Principal component analysis (PCA) based on normalized RNA-seq data transcripts per million (TPM). X-axis, first principal component (PC1); Y-axis, second principal component (PC2). AST-pretreated macrophages, red; AST-untreated macrophages, blue; B, volcano plot showing the log2 fold change (FC) and the adjusted P-value for all the transcriptomes in AST-pretreated macrophages compared with that of untreated macrophages. Dotted lines represent the threshold value of significance (horizontal, -log10 adjusted P = 0) and FC (vertical, log2 (|FC| > 1). Red dots represent the significantly upregulated transcripts, and blue dots represent significantly downregulated transcripts. C, heatmap showing the top 30 upregulated genes; and D, the top 30 downregulated genes in AST-pretreated macrophages compared with that of untreated macrophages; Bubble plots of E, gene ontology (GO) biological process (BP) analysis; and F, Kyoto encyclopedia of genes and genomes (KEGG) pathway enrichment analysis of the differentially expressed genes. The size and color of the bubble denote the number of genes and the magnitude of enrichment in this term, respectively; G, heatmap depicting the hierarchical clustering of enrichment scores for immune-related gene sets through GSVA between AST-pretreated macrophages and AST-untreated groups.
5. Discussion
Sepsis remains a leading cause of mortality in intensive care units worldwide, predominantly due to the intricate balance between hyperinflammatory responses and subsequent immunosuppression (1, 2). Our study elucidates the dual immunomodulatory potential of AST, a marine-derived tetraterpene, in mitigating both inflammatory and immunosuppressive phases of sepsis using an in vitro LPS-treated macrophage model. Anti-inflammatory therapy is an essential therapeutic option in early studies on patients with sepsis. However, this treatment is ineffective in improving the performance of patients with sepsis (28, 29). Treatment failure in clinical trials may be partially attributed to complicated clinical courses and patient heterogeneity. Sepsis has two phases: Inflammatory and immunosuppressive phases (30). Hyperinflammation and immunosuppression can be present in different subsets of patients with sepsis. Because of the diametrically opposite characteristics of these two phases, treatment becomes extremely difficult. Consequently, an agent that can simultaneously inhibit inflammation and immunosuppression is attractive for sepsis treatment.
As a component of the innate and adaptive immune systems, macrophages play various roles in infection control and pathogen clearance (31). Available research suggests that macrophages perform various immune functions at different sepsis stages, thereby profoundly affecting sepsis development and outcome (32). Thus, the effect on the immune function of macrophages is an important index for evaluating the anti-sepsis potential of AST. Our findings demonstrate how AST counteracts key aspects of LPS-induced macrophage immunosuppression at clinically relevant concentrations (23, 24). Specifically, we observed that AST pretreatment restored the capacity of LPS-restimulated macrophages to produce inflammatory cytokines (TNF-α and IL-6), suggesting a reinvigoration of the innate immune response. This was accompanied by a marked increase in NF-κB activity, a central regulator of inflammation (33), and further supported by GSEA revealing enrichment of inflammation-related and NF-κB pathways. These results indicate that AST can modulate the inflammatory response even during a state of immune hyporesponsiveness, a critical finding with implications for late-stage sepsis treatment.
Deaths during sepsis' immunosuppressive phase are mainly due to the inability to control secondary acquired infections (3, 4). There is evidence that AST plays a role in anti-inflammatory and antiphagocytic functions in hyperinflammatory states (34). However, considering the balance between exacerbating tissue injury and pathogen clearance, an ideal treatment for sepsis should effectively reduce inflammatory injury while maintaining activity against pathogens. Another important immune function of macrophages is pathogen engulfment and removal, which mainly depends on their phagocytic activity and oxidative stress-inducing capability (35, 36). In our study, beyond the restoration of inflammatory signaling, we reveal a crucial role for AST in rescuing the impaired pathogen clearance capacity of immunosuppressed macrophages. The LPS2nd significantly reduced the bactericidal and phagocytic activities of macrophages, consistent with the immunosuppressive phenotype observed in sepsis (37, 38). However, AST pretreatment effectively reversed these deficits. This enhanced clearance capacity was linked to increased production of ROS and NO, key mediators of microbial killing (39, 40). Furthermore, GSEA highlighted the enrichment of oxidative stress and phagocytosis pathways in AST-treated macrophages, providing mechanistic insight into AST’s ability to restore macrophage function.
The RNA-Seq analysis provided a comprehensive view of AST’s impact on macrophage biology. The differential expression of genes involved in Hif1α signaling, autophagy, and various immune response pathways underscores the multifaceted roles of AST in immune regulation. Notably, the enrichment of innate and lymphocyte-mediated immune responses indicates that AST may exert its effects beyond macrophages, potentially influencing adaptive immunity and enhancing overall immune competence during sepsis.
The AST has been extensively recognized for its antioxidant and anti-inflammatory properties (8, 9). However, its role in modulating immunosuppression, particularly in the context of sepsis, has been less explored. Our study bridges this gap by demonstrating AST’s capability to counteract LPS-induced immunosuppressive markers and restore macrophage functionality. These findings are consistent with prior reports on AST’s ability to modulate immune responses in other pathological contexts (10), thereby reinforcing its potential as a versatile immunomodulator.
The ability of AST to attenuate immunosuppression while maintaining essential inflammatory responses presents a therapeutic advantage in sepsis management. By targeting the immunosuppressive phase, AST could reduce the incidence of secondary infections and improve survival rates. Future studies should extend these findings to in vivo models of sepsis to validate AST’s efficacy and safety in a more complex physiological environment. Additionally, exploring the synergistic effects of AST with existing sepsis treatments could pave the way for combination therapies that leverage multiple immunomodulatory mechanisms.
While our in vitro model provides valuable mechanistic insights, it does not fully capture the systemic complexities of sepsis in vivo, including interactions among various immune cells and organ systems. Furthermore, the precise molecular targets of AST within the NF-κB pathway and other signaling cascades warrant further investigation. Addressing these limitations in future studies will be crucial for translating our findings into clinical applications.
5.1. Conclusions
This study highlights AST’s potential as a dual-function immunomodulator that can both mitigate excessive inflammation and reverse immunosuppression in sepsis. By enhancing NF-κB activity and restoring macrophage bactericidal functions, AST emerges as a promising candidate for therapeutic intervention aimed at improving sepsis outcomes. Continued exploration of AST’s immunological impacts in vivo and its integration into sepsis management protocols could significantly advance the treatment landscape for this devastating condition.