
1. Background
Type 2 diabetes mellitus (T2DM) is a major global health challenge, affecting glucose and lipid metabolism (1, 2). Glycated hemoglobin )HbA1c) serves as the gold standard for long-term glycemic control (3, 4). However, the accuracy of HbA1c measurements can be affected by several factors, among which lipemia (elevated blood lipids) and the presence of hemoglobin variants are particularly significant (5, 6). Numerous studies have shown that lipemia, by interfering with laboratory methods, may lead to false results in HbA1c measurements (7-9). Similarly, the presence of hemoglobin variants such as HbS and HbE can also influence test outcomes, although the extent of this impact depends on the specific method used for measurement (10, 11).
HbA1c can be measured using various techniques (12). Among these, the enzymatic method and capillary electrophoresis (CE) are of particular importance. The enzymatic method, which relies on specific enzymatic reactions, is widely used in clinical laboratories due to its speed and relatively low cost. However, this method may be prone to inaccuracies in the presence of severe lipemia or hemoglobin variants (13). In contrast, CE, which separates hemoglobin types based on their physicochemical properties, offers higher analytical precision. Several studies have demonstrated that this method provides more reliable results under conditions of interference such as lipemia or hemoglobin variants (14).
2. Objectives
Given the conflicting reports on the impact of lipemia on various HbA1c measurement methods and its clinical relevance in diabetes management (15), the present study aimed to systematically compare enzymatic and CE methods under controlled lipemic conditions and in the presence of hemoglobin variants. These findings offer insights into the strengths and limitations of each method, supporting evidence-based selection of appropriate techniques for diverse patient populations. Of the 30 participants, 25 had normal hemoglobin and 5 carried the HbS variant, allowing direct comparison across both groups. The study focused on evaluating analytical interferences in a controlled laboratory setting. Since the aim was to assess methodological performance rather than estimate population-level outcomes, the sample size does not compromise the study’s validity.
3. Methods
3.1. Sample Collection and Preparation
The study followed the ethical principles outlined in the Declaration of Helsinki and was approved by the Ethics Committee of Payam Noor University (IR.PNU.REC.1403.011). Written informed consent was obtained from all participants. The study aimed to compare HbA1c measurement methods in samples with varying lipemia and the HbS variant. Thirty patients with type 2 diabetes (16 women, 14 men, aged 30 - 50 years) were enrolled from Imam Reza Hospital in Omidiyeh (9). Inclusion criteria were triglyceride levels of 50 - 150 mg/dL, no recent lipid-lowering medications, and normal liver and kidney function. Exclusion criteria included anemia (Hb < 10 g/dL), recent transfusions, and hemolyzed samples (plasma hemoglobin > 0.5 g/L). Fasting EDTA blood samples (BD Vacutainer, USA) (16) were centrifuged (Hettich Rotina 380, Germany), and lipemia was induced by adding 5 or 20 g/L of Intralipid 20% (Fresenius Kabi, Germany), corresponding to triglyceride levels of approximately 443 and 1772 mg/dL (measured enzymatically, Pars Azmun kit, Iran). Samples were washed twice with 0.9% saline (Samen Pharmaceutical Co., Iran; pH 7.4) using the same centrifugation conditions (3000 rpm, 10 min). After each wash, samples were gently resuspended, and the final volume was restored with saline to match the original, ensuring consistency for HbA1c measurement. Each of the 30 patients contributed one sample, which was aliquoted for four experimental conditions: Baseline, mild lipemia, severe lipemia, and post-washing. This within-subject design minimized biological variability. Patients were grouped by hemoglobin type: Twenty-five with normal hemoglobin and 5 with the HbS variant. Each underwent testing under all four conditions, yielding eight subgroups (2 hemoglobin types × 4 conditions) for analysis.
3.2. Glycated Hemoglobin Measurement Methods
The HbA1c levels were measured using CE with the Capillarys 3 Tera system (Sebia, France) and the enzymatic method with the Mindray BS480 device and Diazyme kit (USA), which offers a coefficient of variation (CV) of < 2%. The presence of the HbS variant was confirmed using alkaline pH electrophoresis (Hydrasys, Sebia, France). All procedures followed a quality control protocol using standard NIST reference samples.
3.3. Statistical Analysis
Normality of data distribution was assessed using the Shapiro-Wilk test. Group comparisons were performed using the Friedman and Wilcoxon tests (17), with Bonferroni correction (18), and correlations were evaluated using the Spearman test. Statistical significance was set at P < 0.05. The allowable total analytical error (TEa) was based on SEQC standards (± 4.4%). Analyses were conducted using SPSS version 26 (IBM, USA) (19).
4. Results
Among the 30 patients, 25 (83.3%) had no hemoglobin variants, and 5 (16.7%) had the HbS variant. This distribution aligns with the general population’s prevalence of hemoglobin variants (20). Non-parametric tests, such as the Wilcoxon test with Bonferroni correction, were used for analyses involving the HbS variant group (17).
4.1. Glycated Hemoglobin Levels Under Baseline Conditions (Non-lipemic Samples)
Under baseline conditions, both methods showed acceptable accuracy without significant differences between samples with and without the HbS variant (P > 0.05).
4.2. Effect of Lipid Addition on Glycated Hemoglobin Measurements
Under low lipemia (5 g/L), both methods showed stable HbA1c values without significant differences (P > 0.05). This stability may reflect their relative resistance to interference from mild lipemia. However, under high lipemia conditions (20 g/L), the CE method measured HbA1c at 6.1 ± 0.5 mmol/mol for samples with the HbS variant and 5.3 ± 0.5 mmol/mol for those without, with no statistically significant differences (P > 0.05). In contrast, the enzymatic method reported values of 6.7 ± 0.4 mmol/mol and 6.3 ± 0.3 mmol/mol for samples with and without hemoglobin variants, respectively, showing a significant increase from baseline (P < 0.001; Table 1).
Table 1.
Glycated Hemoglobin Levels in Patients Based on Wilcoxon Test Results a
| Variant Types | CE Method (mmol/mol) | Enzymatic Method (mmol/mol) | ||
|---|---|---|---|---|
| Patients with HbS Variant (n = 5) | Patients Without Hemoglobin Variant (n = 25) | Patients with HbS Variant (n = 5) | Patients Without Hemoglobin Variant (n = 25) | |
| Baseline (non-lipemic) | 6.1 ± 0.3 | 5.3 ± 0.4 | 5.8 ± 0.5 | 6.1 ± 0.4 |
| Low lipemia (5 g/L) | 6.1 ± 0.4 | 5.3 ± 0.3 | 5.9 ± 0.6 | 5.9 ± 0.5 |
| High lipemia (20 g/L) | 6.1 ± 0.5 | 5.3 ± 0.5 | 6.7 ± 0.4 b | 6.3 ± 0.3 b |
| Washed with 0.9% saline | 4.1 ± 0.6 b | 5.3 ± 0.4 | 6.9 ± 0.5 b | 6.8 ± 0.4 b |
Abbreviation: CE, capillary electrophoresis.
a Values are expressed as mean ± SD.
b Indicates a statistically significant difference compared to baseline (P < 0.05).
4.3. Results After Washing Samples with 0.9% Normal Saline
Remarkable results were observed following washing with 0.9% normal saline. The Wilcoxon test showed a significant decrease in HbA1c measured by CE for samples with the HbS variant (from 6.1 ± 0.3 to 4.0 ± 1.6 mmol/mol; P = 0.02) and a significant increase in the enzymatic method (from 5.8 ± 0.5 to 6.9 ± 0.5 mmol/mol; P < 0.001) (Table 1). These findings indicate that saline washing can differentially affect HbA1c measurements depending on the detection method and the presence of the HbS variant.
According to SEQC standards (± 4.4%), the TEa was 1.57% for CE and 1.24% for the enzymatic method, both within acceptable limits. Despite this, the two methods showed statistically significant (P < 0.05) and clinically relevant differences, with a mean HbA1c difference exceeding 0.5%.
The results of this study demonstrate the significant impact of varying levels of lipemia and the presence of the HbS variant on the accuracy of HbA1c measurement. Under baseline conditions (absence of lipemia), both groups — patients with and without hemoglobin variants — showed a very strong correlation between the two measurement methods (correlation coefficient of 0.977 for the group without variants and 0.741 for the group with the HbS variant, P < 0.001). Upon induction of lipemia at a concentration of 20 grams per liter, a significant decline in correlation between the two methods was observed. In the group without hemoglobin variants, the correlation coefficient dropped from 0.977 to 0.716 (a 26.1% decrease), while in the HbS variant group, it decreased from 0.741 to 0.714 (a 2.7% reduction). Following the implementation of the 0.9% saline wash protocol, the correlation in the group without variants was restored to 0.962 (98.5% recovery), and in the HbS variant group, it returned to its original level of 0.741 (100% recovery) (Table 2).
Table 2.
Spearman Correlation Coefficients Between the Two HbA1c Measurement Methods Under Various Laboratory Conditions
| Laboratory Condition | With HbS Variant (r) a | Without Variant (r) a | All Patients (r) a |
|---|---|---|---|
| Baseline (no lipemia) | 0.741 | 0.977 | 0.931 |
| Low lipemia (5 g/L) | 0.912 | 0.961 | 0.923 |
| High lipemia (20 g/L) | 0.714 | 0.716 | 0.742 |
| Post-washing with 0.9% saline | 0.741 | 0.962 | 0.821 |
a Correlation is significant at the 0.01 level (two-tailed).
Furthermore, the results of the Friedman test indicated statistically significant within-group changes across different laboratory conditions (χ2 = 22.51, P < 0.0001). These findings suggest that the CE method demonstrates greater stability in the presence of the HbS variant. Additionally, washing with saline can significantly improve measurement accuracy, particularly in samples without hemoglobin variants.
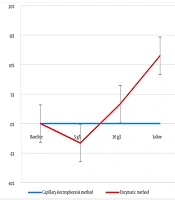
The percentage differences (%) were calculated based on the difference between the HbA1c results in treated samples compared to baseline values (12). As shown in Figure 1, the CE method demonstrated excellent stability in samples without hemoglobin variants across all conditions, with changes not exceeding 1% at any stage of treatment. In contrast, the enzymatic method experienced significant fluctuations, with a 3.3% decrease under mild lipemia (5 g/L), a 3.3% increase under severe lipemia (20 g/L), and a notable 11.5% increase after washing with saline solution compared to baseline values (all differences were statistically significant with P < 0.05). The purpose of washing with saline was to reduce lipemia interference in the enzymatic method; however, this action not only failed to correct the results but also led to a further increase in HbA1c values (from a 3.3% change to an 11.5% increase; P < 0.01), indicating the persistence and even exacerbation of matrix interference effects in this method. In contrast, the results from the CE method remained completely stable when exposed to lipemia and after washing, with no change in HbA1c values (zero percent change). These findings emphasize the superiority of methods based on physical separation over enzymatic methods in handling complex matrix conditions.
![Percentage difference (%) between sequential glycated hemoglobin (HbA1c) measurements using capillary electrophoresis (CE) and enzymatic methods in samples without variants. Percentage difference (%) calculation = [(HbA1c value of treated sample HbA1c value of baseline sample)/HbA1c value of baseline sample] × 100.](https://brieflands.com/journals/jjcmb/articles/162424/figures/jjcmb-16-3-162424-i001-preview.webp "Percentage difference (%) between sequential glycated hemoglobin (HbA1c) measurements using capillary electrophoresis (CE) and enzymatic methods in samples without variants. Percentage difference (%) calculation = [(HbA1c value of treated sample HbA1c value of baseline sample)/HbA1c value of baseline sample] × 100.")
Figure 1.
Percentage difference (%) between sequential glycated hemoglobin (HbA1c) measurements using capillary electrophoresis (CE) and enzymatic methods in samples without variants. Percentage difference (%) calculation = [(HbA1c value of treated sample HbA1c value of baseline sample)/HbA1c value of baseline sample] × 100.
5. Discussion
Glycated hemoglobin is a key marker for monitoring glycemic control, but its accuracy can be affected by lipemia and hemoglobin variants (21). This study found that CE outperforms enzymatic methods under such conditions. Both methods showed strong correlation under baseline and mild lipemia (r = 0.977), but the enzymatic method exhibited a significant HbA1c increase under severe lipemia (20 g/L; P < 0.001), likely due to lipid interference (7). The CE proved more resistant to HbS-related interference, consistent with prior reports indicating that hemoglobin variants affect enzymatic methods more than electrophoretic ones (22-24). The performance gap between methods widened under severe hyperlipidemia. Prior studies confirm that hyperlipidemia combined with hemoglobin variants impairs enzymatic accuracy, while CE remains reliable (24, 25).
Saline washing affected the methods differently: Enzymatic readings falsely increased (P < 0.001), while CE showed a slight but significant HbA1c decrease in HbS samples (P = 0.02), likely due to its resistance to matrix changes and the ionic sensitivity of enzymatic reactions (13, 22, 26). Although the 2 mmol/mol decrease in CE is numerically small, it is clinically meaningful, as it may mislead glycemic control interpretation. This aligns with American Diabetes Association guidelines defining ± 5 mmol/mol as the acceptable error range (27).
Under severe lipemia, the correlation between methods dropped significantly (-1.26% in the non-variant group, -2.7% in the HbS group; P < 0.001). However, the optimized saline washing protocol (pH 7.4, 5000 g, 5 min, 20°C) largely restored correlation (98.5% non-variant, 100% HbS). Post-washing, CE showed clear superiority in the HbS group (r = 0.962 vs. 0.741 for enzymatic). This supports previous findings and highlights the role of CE’s physical separation in minimizing matrix interference (9).
The enzymatic method (Diazyme, Mindray BS480) showed greater lipemia sensitivity than previously reported for other platforms (e.g., Siemens), with residual deviation (+11.5%) despite washing (8). The CE (Capillarys 3 Tera) remained stable (< 1% variation). Although manufacturers report lipid tolerance up to 4000 mg/dL, our data show that severe lipemia can still impair enzymatic accuracy through turbidity, pH shifts, optical effects, and ionic strength changes (27, 28). These findings support previous recommendations for using interference-resistant methods and standardized preparation. Overall, CE demonstrates clear analytical advantages under complex sample conditions (28).
One limitation of this study is the small number of patients with the HbS variant (n = 5), which limits statistical power and generalizability. However, the primary goal was not to estimate population-level prevalence but to assess the analytical performance of two HbA1c methods under controlled conditions, including lipemia and hemoglobin variants. Despite the limited sample size, consistent and reproducible interference patterns were observed — particularly under severe lipemia — supporting the analytical conclusions. To reduce biological variability and improve precision, we used a within-subject experimental design in which each patient’s sample was tested across all conditions. This design, commonly recommended for analytical interference evaluations, enhances internal validity by allowing direct comparison within the same biological background. Future studies with larger, stratified populations are warranted to validate and extend these findings in broader clinical settings.
5.1. Conclusions
The CE provides higher accuracy for HbA1c measurement in samples affected by severe lipemia and the HbS variant compared to enzymatic assays. Normal saline washing did not fully eliminate enzymatic interference. These findings highlight the need for appropriate method selection and warrant further research with larger sample sizes.