


1. Background
2. Objectives
3. Methods
3.1. Population of the Study
3.2. DNA Extraction and Genotyping
3.3. Statistical Analysis
4. Results
4.1. Genotyping
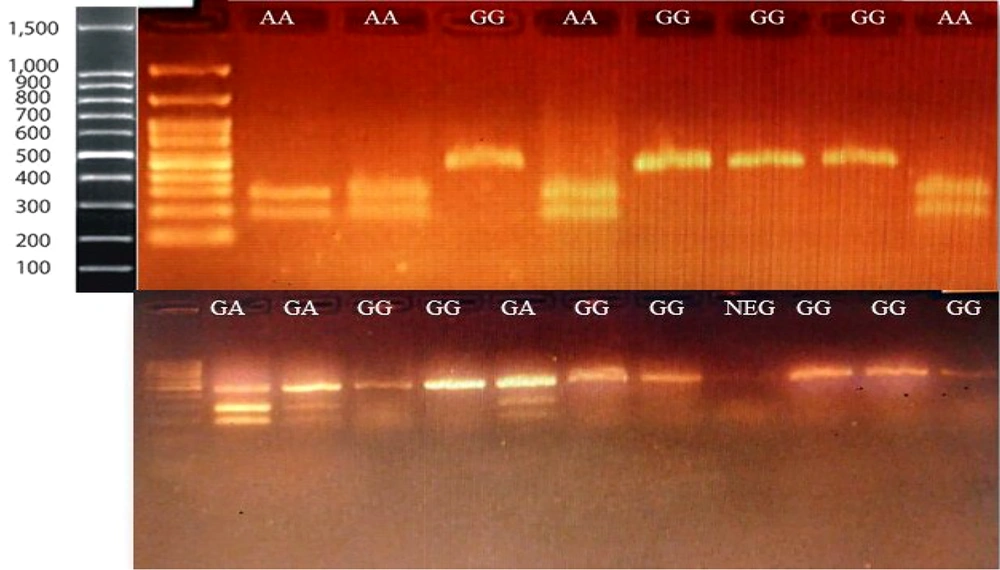
The genotyping of the ACE2 rs2285666 polymorphism was performed using PCR-based restriction fragment length polymorphism (PCR-RFLP). After digestion, fragments of 281 and 185 bp identified the A allele, and a 466 bp band identified the G allele. After electrophoresis, the bands were visualized on Safe-stained agarose gels, and all genotypes were confirmed.
4.2. Characteristics of the Study Population
| Variables | All Samples | Positive Group (n = 201) | Negative Group (n = 171) |
|---|---|---|---|
| Male | 199 (53) | 94 | 99 |
| Female | 173 (46) | 96 | 77 |
| Mean age (y) | 51 (13) | 56 | 46 |
| Lur | 198 (53) | 100 (50) | 98 (57) |
| Fars | 105 (28) | 76 (38) | 29 (17) |
| Turkmen | 56 (15) | 21 (10) | 35 (21) |
| Balooch | 12 (3) | 4 (2) | 8 (5) |
a Values are expressed as No. or No. (%).
b Participants comprised of 201 patients and 171 controls from different ethnicities.
4.3. Distribution of rs2285666 Genotypes
| Ethnicity and Genotypes | Negative Group | Positive Group | P-Value c |
|---|---|---|---|
| Female | |||
| Lur | 0.933 | ||
| GG | 22 ( 56.4) | 30 (55.6) | |
| GA | 15 (38.5) | 22 (40.7) | |
| AA | 2 (5.1) | 2 (3.7) | |
| Fars | 0.050 | ||
| GG | 11 (73.3) | 17 (54.8) | |
| GA | 4 (28.6) | 3 (9.3) | |
| AA | 0 (0.0) | 11 (34.4) | |
| Turkmen | 0.186 | ||
| GG | 11 (68.8) | 7 (63.6) | |
| GA | 5 (31.3) | 2 (18.2) | |
| AA | 0 (0.0) | 2 (18.2) | |
| Balooch | - | ||
| GG | 3 (42.9) | - | |
| GA | 4 (57.1) | ||
| AA | - | ||
| Total | 0.050 | ||
| GG | 47 (61) | 54 (56.2) | |
| GA | 27 (35.1) | 28 (29.2) | |
| AA | 3 (3.9) | 14 (14.6) | |
| Male | |||
| Lur | 0.594 | ||
| G | 50 (84.7) | 37 (80.4) | |
| A | 9 (15.3) | 9 (19.6) | |
| Fars | 0.029 | ||
| G | 23 (100.0) | 25 (69.4) | |
| A | 0 (0.0) | 11 (30.6) | |
| Turkmen | 0.578 | ||
| G | 17 (89.5) | 8 (72.7) | |
| A | 2 (12.5) | 3 (27.3) | |
| Balooch | 0.250 | ||
| G | 4 (100) | 0 (0.0) | |
| A | 0 (0.0) | 1 (100.0) | |
| Total | 0.025 | ||
| G | 94 (89.5) | 70 (74.5) | |
| A | 11 (10.5) | 24 (25.5) |
a Values are expressed as No. (%).
b A significant difference in genotype frequencies between the patient and control groups was found among Fars participants and across the entire population for both male and female groups.
cP ≤ 0.05 was considered statistically significant.
| Alleles | Frequency | Hardy-Weinberg (P-Value) | ||||
|---|---|---|---|---|---|---|
| Control | Patient | Total | Control | Patient | Total | |
| G | 0.83 | 0.72 | 0.77 | 1 | 0.0057 | 0.029 |
| A | 0.17 | 0.28 | 0.23 | |||
a Hardy-Weinberg equilibrium was assessed using the female population, which showed that the population was not in equilibrium.
| Model and Genotypes | SNP Association with Response Group (n = 173, Crude Analysis) | |||||
|---|---|---|---|---|---|---|
| Control Group | Patient Group | OR (95% CI) | P-Value | AIC | BIC | |
| Co-dominant | 0.046 | 237.6 | 247.1 | |||
| G/G | 47 (61) | 54 (56.2) | 1.00 | |||
| G/A | 27 (35.1) | 28 (29.2) | 0.90 (0.47 - 1.74) | |||
| A/A | 3 (3.9) | 14 (14.6) | 4.06 (1.10 - 15.00) | |||
| Dominant | 0.52 | 241.3 | 247.6 | |||
| G/G | 47 (61) | 54 (56.2) | 1.00 | |||
| G/A-A/A | 30 (39) | 42 (43.8) | 1.22 (0.66 - 2.24) | |||
| Recessive | 0.014 | 235.7 | 242 | |||
| G/G-G/A | 74 (96.1) | 82 (85.4) | 1.00 | |||
| A/A | 3 (3.9) | 14 (14.6) | 4.21 (1.16 - 15.24) | |||
| Overdominant | 0.41 | 241.1 | 247.4 | |||
| G/G-A/A | 50 (64.9) | 68 (70.8) | 1.00 | |||
| G/A | 27 (35.1) | 28 (29.2) | 0.76 (0.40 - 1.45) | |||
| Log-additive | 0.13 | 239.4 | 245.7 | |||
| - | - | - | 1.43 (0.90 - 2.27) | |||
a Values are expressed as No. (%).
b In both co-dominant and recessive inheritance types, there was a significantly higher chance for the AA genotype to be infected with COVID-19, with OR = 4.06 (1.10 - 15.00) and OR = 4.21 (1.16 - 15.24), respectively.
4.4. Association of the rs2285666 Polymorphism with Clinical Symptoms and Laboratory variables
| Variables | Fever | Cough | Muscle pain | Respiratory Distress | Diabetes | Heart Disease | Blood Pressure | |||||||
|---|---|---|---|---|---|---|---|---|---|---|---|---|---|---|
| ACE2 G8790A | No | Yes | No | Yes | No | Yes | No | Yes | No | Yes | No | Yes | No | Yes |
| Female | ||||||||||||||
| GG | ||||||||||||||
| Control | 32 (68.1) | 15 (31.9) | 31 (65.9) | 16 (34.1) | 40 (85.1) | 7 (14.9) | 32 (68.1) | 15 (31.9) | 41 (87.2) | 6 (12.8) | 44 (93.6) | 3 (6.4) | 47 (100.0) | 0 (0.0) |
| Case | 26 (48.1) | 28 (51.9) | 32 (59.2) | 22 (40.8) | 42 (77.8) | 12 (22.2) | 24 (44.4) | 30 (55.6) | 46 (85.2) | 8 (14.8) | 48 (88.9) | 6 (11.1) | 48 (88.9) | 6 (11.1) |
| P- value c | 0.041 | 0.532 | 0.316 | 0.015 | 1.000 | 0.511 | 0.037 | |||||||
| GA | ||||||||||||||
| Control | 15 (55.6) | 12 (44.4) | 17 (62.9) | 10 (37.1) | 26 (96.3) | 1 (3.7) | 20 (74.1) | 7 (25.9) | 26 (96.3) | 1 (3.7) | 25 (92.6) | 2 (7.4) | 25 (92.6) | 2 (7.4) |
| Case | 16 (57.1) | 12 (42.9) | 16 (57.1) | 12 (42.9) | 23 (82.1) | 5 (17.9) | 17 (60.7) | 11 (39.3) | 22 (78.6) | 6 (21.4) | 26 (92.9) | 2 (7.1) | 26 (92.9) | 2 (7.1) |
| P- value c | 1.000 | 0.779 | 0.192 | 0.372 | 0.100 | 1.000 | 1.000 | |||||||
| AA | ||||||||||||||
| Control | 2 (66.6) | 1 (43.4) | 2 (66.6) | 1 (43.4) | 1 (43.4) | 2 (66.6) | 1 (43.4) | 2 (66.6) | 3 (100) | 0 (0.0) | 3 (100.0) | 0 (0.0) | 3 (100.0) | 0 (0.0) |
| Case | 5 (35.7) | 9 (64.3) | 8 (57.1) | 6 (42.9) | 12 (85.7) | 2 (14.3) | 5 (35.7) | 9 (64.3) | 11 (78.6) | 3 (21.4) | 13 (92.9) | 1 (17.1) | 13 (92.9) | 1 (17.1) |
| P- value c | 1.000 | 1.000 | 0.331 | 1.000 | 1.000 | 1.000 | 1.000 | |||||||
| Total | ||||||||||||||
| Control | 49 (63.6) | 28 (36.4) | 50 (64.9) | 27 (35.1) | 67 (87.1) | 10 (11.9) | 53 (68.8) | 24 (31.2) | 70 (90.9) | 7 (9.1) | 72 (93.5) | 5 (6.5) | 75 (97.4) | 2 (2.6) |
| Case | 47 (48.9) | 49 (51.1) | 56 (58.3) | 40 (41.7) | 77 (80.2) | 19 (19.8) | 46 (47.9) | 50 (52.1) | 79 (82.3) | 17 (17.7) | 87 (90.6) | 9 (9.4) | 87 (90.6) | 9 (9.4) |
| P- value c | 0.059 | 0.519 | 0.206 | 0.003 | 0.170 | 0.593 | 0.203 | |||||||
| Male | ||||||||||||||
| G | ||||||||||||||
| Control | 67 (71.3) | 27 (28.7) | 62 (65.9) | 32 (44.1) | 81 (86.2) | 13 (13.8) | 63 (67.1) | 31 (32.9) | 93 (98.9) | 1 (1.1) | 86 (91.5) | 8 (8.5) | 88 (93.6) | 6 (6.4) |
| Case | 34 (48.6) | 36 (51.4) | 42 (60) | 28 (40) | 57 (81.4) | 13 (18.6) | 29 (41.4) | 41 (58.6) | 64 (91.4) | 6 (8.6) | 65 (92.9) | 5 (7.1) | 66 (94.3) | 4 (5.7) |
| P- value c | 0.008 | 0.594 | 0.486 | 0.003 | 0.115 | 0.764 | 1.000 | |||||||
| A | ||||||||||||||
| Control | 8 (72.7) | 3 (17.3) | 4 (36.4) | 7 (63.6) | 11 (100.0) | 0 (0.0) | 9 (81.8) | 2 (18.2 | 10 (90.9) | 1 (9.1) | 11 (100.0) | 0 (0.0) | 11 (100.0) | 0 (0.0) |
| Case | 12 (50.0) | 12 (50.0) | 7 (29.2) | 17 (70.8) | 21 (87.5) | 3 (12.5) | 10 (41.7) | 14 (58.3) | 21 (87.5) | 3 (12.5) | 21 (87.5) | 3 (12.5) | 24 (100.0) | 0 (0.0) |
| P- value c | 0.446 | 0.683 | 0.534 | 0.060 | 1.000 | 0.534 | - | |||||||
| Total | ||||||||||||||
| Control | 75 (71.4) | 30 (28.6) | 66 (62.9) | 39 (37.1) | 92 (87.6) | 13 (12.4) | 73 (69.5) | 32 (30.5) | 103 (98.1) | 2 (1.9) | 97 (92.4) | 8 (7.6) | 99 (94.3) | 6 (5.7) |
| Case | 46 (48.9) | 48 (51.1) | 49 (52.1) | 45 (47.9) | 78 (82.9) | 16 (17.1) | 39 (41.5) | 55 (58.5) | 85 (90.4) | 9 (9.6) | 86 (91.5) | 8 (8.5) | 90 (95.7) | 4 (4.3) |
| P-value c | 0.004 | 0.212 | 0.287 | < 0.001 | 0.065 | 1.000 | 1.000 | |||||||
a Values are expressed as No. (%).
b The results showed that female patients with the GG genotype had significantly higher frequencies of fever, respiratory distress, and high blood pressure. There were also significantly higher frequencies of respiratory distress among all female participants. Among males with the G genotype and all male participants, the patient group showed significantly higher frequencies of fever and respiratory distress.
c Fisher’s exact test.
| ACE2 Polymorphism | ESR | WBC | RBC | Hb | Hematocrit | Platelet | Neutrophil | Lymphocytes |
|---|---|---|---|---|---|---|---|---|
| Female | ||||||||
| GG | ||||||||
| Control | 20.923 (20.2791) | 7.927 (4.8733) | 4.573 (1.1016) | 13.277 (2.9285) | 38.650 (7.9791) | 191.23 (77.563) | 60.43 (23.714) | 28.29 (12.669) |
| Case | 39.385 (23.3685) | 8.865 (4.4673) | 4.177 (.7337) | 12.437 (2.3279) | 36.223 (6.0680) | 203.58 (85.313) | 68.21 (28.567) | 16.77 (10.685) |
| P-value c | 0.020 | 0.447 | 0.146 | 0.220 | 0.199 | 0.576 | 0.292 | < 0.001 |
| GA | ||||||||
| Control | 33.889 (21.7913) | 7.433 (3.7397) | 4.533 (.4850) | 12.913 (2.9895) | 38.853 (4.3536) | 214.40 (83.494) | 53.93 (30.115) | 26.80 (10.605) |
| Case | 44.769 (32.2727) | 6.446 (1.9509) | 4.375 (.5252) | 13.546 (1.2079) | 38.058 (3.9715) | 212.46 (56.971) | 65.33 (19.482) | 25.42 (13.571) |
| P-value c | 0.390 | 0.356 | 0.352 | 0.446 | 0.561 | 0.932 | 0.158 | 0.739 |
| AA | ||||||||
| Control | 33.500 (41.7193) | 7.950 (2.6163) | 3.750 (.7778) | 11.100 (3.8184) | 31.350 (6.7175) | 285.50 (122.329) | 62.00 (15.556) | 25.50 (9.192) |
| Case | 37.000 (27.8388) | 6.120 (2.8700) | 4.38 (.3962) | 13.340 (2.0428) | 38.500 (4.6707) | 154.20 (92.356) | 68.40 (23.681) | 25.60 (21.102) |
| P-value c | 0.915 | 0.473 | 0.190 | 0.333 | 0.158 | 0.174 | 0.703 | 0.993 |
| Total | ||||||||
| Control | 26.833 (22.3270) | 7.738 (4.3031) | 4.515 (.8978) | 13.026 (2.9415) | 38.354 (6.7886) | 204.97 (82.296) | 57.95 (25.780) | 27.55 (11.505) |
| Case | 40.881 (26.1331) | 7.825 (3.8392) | 4.267 (.6412) | 12.888 (2.0333) | 37.089 (5.2866) | 203.09 (77.335) | 67.21 (25.071) | 20.42 (13.137) |
| P-value c | 0.031 | 0.915 | 0.137 | 0.797 | 0.294 | 0.905 | 0.074 | 0.006 |
| Male | ||||||||
| G | ||||||||
| Control | 27.893 (21.1351) | 9.649 (11.8762) | 4.772 (.8821) | 15.026 (2.9615) | 41.681 (7.2753) | 205.70 (83.349) | 66.46 (23.240) | 21.83 (13.124) |
| Case | 37.906 (24.1546) | 7.769 (4.3846) | 4.533 (.6895) | 13.758 (1.8831) | 39.079 (5.2343) | 195.53 (94.043) | 74.09 (13.042) | 20.04 (11.404) |
| P-value c | 0.095 | 0.321 | 0.162 | 0.016 | 0.057 | 0.588 | 0.057 | 0.492 |
| A | ||||||||
| Control | 18.400 (24.2961) | 6.188 (2.1490) | 5.150 (.7597) | 15.013 (2.1735) | 41.725 (4.6879) | 232.88 (50.309) | 55.13 (23.314) | 29.25 (8.763) |
| Case | 52.000 (40.3044) | 9.500 (5.4299) | 4.442 (.7821) | 13.250 (2.2857) | 37.950 (5.6843) | 227.92 (131.524) | 77.58 (8.878) | 16.50 (8.274) |
| P-value c | 0.113 | 0.120 | 0.060 | 0.102 | 0.137 | 0.921 | 0.007 | 0.004 |
| Total | ||||||||
| Control | 25.730 (21.3758) | 9.200 (10.6388) | 4.835 (.8433) | 15.070 (2.7676) | 41.845 (6.7401) | 210.15 (76.883) | 65.44 (22.684) | 22.56 (12.735) |
| Case | 41.511 (29.1194) | 8.636 (5.1439) | 4.514 (.7103) | 13.568 (2.0372) | 38.278 (6.3821) | 206.14 (101.863) | 74.18 (14.051) | 20.10 (12.899) |
| P-value c | 0.008 | 0.710 | 0.029 | 0.001 | 0.004 | 0.808 | 0.013 | 0.295 |
Abbreviations: ESR, erythrocyte sedimentation rate; Hb, hemoglobin; WBC, white blood cell; RBC, red blood cell.
a Values are expressed as No. (%).
b In female patients, there was a significant increase in ESR and a significant decrease in lymphocyte levels among both GG genotype females and all females. In male patients with the A genotype, there was a significant increase in neutrophils and a significant decrease in lymphocyte levels. In male patients with the G genotype, the Hb level was significantly decreased. Among all male cases, there was a significant increase in ESR and neutrophils, and a significant decrease in RBC count, Hb, and HCT.
c Independent t-test.


