1. Background
Shielding is used to protect underlying sensitive tissues in the treatment of superficial tumors using electron beams. It is most commonly applied when electromagnetic fields are used to treat the lip, buccal mucosa, and eyelid lesions (1).
Lead is widely used for internal shielding to protect non-target tissues in electron therapy (2, 3). Lead is recognized as a toxic element. It is not flexible enough to be easily shaped and thus, it would bring discomfort to the patient (4). Many studies have reported new substitute alloys to replace lead for internal or external shielding (5-8).
Many studies have investigated some new materials to decrease both shielding thickness and dose enhancement due to backscattering in electron therapy. Dia Chemical Co. developed a hard plate and a flexible shielding material called Rad-block and X-sheet, respectively. Rad-block is a hard plate while X-sheet provides flexible shielding; the latter is easily cut and fabricated. However, it has been reported that when these materials are used for internal shielding, backscattering might be a noticeable problem (5, 9).
When electrons pass through a target and meet a high atomic number material, they produce dose enhancement at the interface, as well as in the upstream direction. This dose enhancement is caused by electron backscattering from the interface. Many studies have measured or calculated the dose enhancement using Monte Carlo simulation (10-15).
To reduce dose enhancement, a material with a lower atomic number can be placed between the lead shield and the tissue, which is known as an absorber. The absorber creates less scatter than the higher atomic number shielding material. However, the absorber makes not only the shield thicker but also the prediction of the upstream dose difficult in treatment planning system (TPS) algorithms (16).
Because of the above reasons, in this study, a putty metal was investigated for internal shielding due to its lower electron backscattering, more flexibility, and nontoxic nature compared to lead. The acronym LFN was used to illustrate these three qualities.
2. Objectives
This study utilized a Monte Carlo simulation of a new kind of nontoxic material, which can be used for the protection against electron beams inside a human body.
3. Methods
3.1. Chemical Analysis
For simulating this material by MCNPX6 code, the elemental composition and the weight percentage of elements in LFN needed to be known. To determine the elements and weight percentage, energy-dispersive X-ray (EDX) spectroscopy and chemical analyses were run. The results of the EDX technique and chemical analysis are shown in Table 1.
Table 1.
Elements and Weight Percentages of LFN Obtained by EDX Technique
| Elements of LFN | Weight Percentage in LFN |
|---|---|
| W | 70 |
| C | 11.39 |
| Ni | 18.61 |
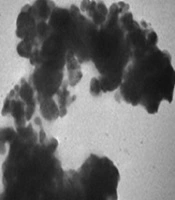
The analysis of LFN by an electron microscope showed that the LFN was made of tungsten powder based on the polymer.
3.2. Measurements
To acquire the percentage depth dose (PDD) and dose profile, a 50 × 50 × 50 cm3 Scanditronix water phantom was set up. The PDD and dose profile were measured by a CC13 ionization chamber (volume 0.13 cm3, total active length 5.8 mm, cylinder length 2.8 mm, the inner diameter of cylinder 6.0 mm, wall thickness 0.4 mm, diameter of inner electrode 1.0 mm, and length of inner electrode 3.3 mm). The PDD and dose profile were measured and drawn by Omnipro-accept and Excel.
3.3. Simulations
In Monte Carlo simulations, MCNPX version 2.6.0. was used on a PC with a 3-GHz Intel Core Duo CPU running under Windows 7. Simulations were performed in the coupled electron-photon mode.
Varian 2100 C/D was modeled for 6 and 9 MeV electron energies. The treatment head configuration consisted of a primary collimator, exit window, primary scattering foil, secondary scattering foil, monitor chamber, mirror, upper and lower jaws, and applicator. The manufacturer provided information about the geometry, material composition, and dimension of the components.
In this study, we assumed that the spectral distribution of the beam after the bending magnet (before electrons strike to the primary scattering foil) simulated an asymmetric Gaussian spectral distribution since the asymmetric Gaussian included unequal right FWHM (full-width-half-maximum) and left FWHM; thus, by using Equation 1, the spectral distribution of the initial electron was calculated, as follow (17):
where Ep is the probable energy and r denotes the
Spatial spread or spot size was shown as the full width at half of the maximum (18). The parameters of the energy distribution for incident electrons are listed in Table 2 for each energy level. The number of particles was determined such that the statistical uncertainty would be within ± 1%.
Table 2.
Parameters of Incident Electrons in Monte Carlo Simulations
| Variables | Values | |
|---|---|---|
| Energy, MeV | 6 | 9 |
| Spot Size, cm | 0.2 | 0.2 |
| Mean energy, MeV | 6.05 | 9.02 |
| Probable energy, MeV | 6.4 | 9.1 |
| Right FWHM of the energy spectrum, MeV | 2.5 | 2.2 |
| Left FWHM of the energy spectrum, MeV | 1.5 | 2 |
Abbreviation: FWHM, full width half of maximum.
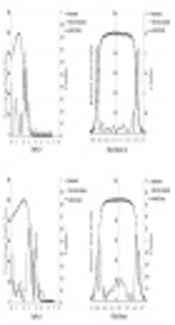
The calculated PDD and dose profile for two energies were verified against physical measurements within an accuracy of 3% and 3 mm for the 10 × 10 cm2 applicator (Figure 1). The source-to-surface distance was 100 cm. In this study, the differences between the calculated and measured values for 6 and 9 MeV electron beams were analyzed by gamma index (19).

Figure 1.
A, Calculated and measured 6 MeV electron beam central axis depth dose distribution and beam profile of Varian 2100 C/D for a 10 × 10 cm2 applicator; B, calculated and measured 9 MeV electron beam central axis depth dose distribution and beam profile of Varian 2100 C/D for a 10 × 10 cm2 applicator
The internal shields were placed in a 25 × 25 × 25 cm3 water phantom and at two useful treatment depths for two energies. The dimensions of internal shields were 5 × 5 cm2 and three thicknesses were investigated.
First, the thickness of LFN was calculated at two depths intending to reduce the dose to 5% of the maximum dose of the open beam.
Second, the thickness of the lead shield was calculated at two depths for each energy level (minimum thickness (in millimeters) of lead required for blocking was given by electron energy in MeV divided by 2).
Third, the thickness of LFN was investigated with the same transmissions as the lead shied required.
Another parameter of internal shielding investigated was the backscatter factor (BSF, defined as the proportion of the dose at the shield interface with and without shielding) of each thickness of LFN that was determined and compared with that of lead.
4. Results
4.1. Chemical Analysis
Table 1 shows the result of the EDX technique and chemical analysis to find the elements and weight percentages of LFN.
4.2. Parameters of Incident Electrons in Monte Carlo Simulation
The parameters of the energy distribution of incident electrons are listed in Table 2 for energy levels of 6 and 9 MeV in the electron mode.
To compare the LFN with lead, many thicknesses were investigated to decrease transmission below 5% at the two most useful treatment depths for each energy level: 1.3 and 2 cm for 6 MeV and 2 and 3 cm for 9 MeV (1).
Subsequently, the required minimum thickness of lead was calculated at the two depths for each energy and finally, the thickness of LFN was investigated with the same transmission as the lead shied required. The thicknesses are shown in Tables 3 and 4.
Table 3.
The Thickness of Lead Required, the Thickness of LFN to Reduce the Dose to 5% of the Maximum Dose of the Open Beam, the Thickness of LFN with the Same Transmission as Lead Required, and EBF at Two Depths in the Water Phantom Using the 6 MeV Electron Beam
| Variables | Depth1 = 1.3 cm | Depth2 = 2 cm | ||
|---|---|---|---|---|
| Thickness, mm | EBF | Thickness, mm | EBF | |
| Lead | 1.678 | 1.59 | 1 | 1.53 |
| LFN (reduced transmission below 5%) | 1.65 | 1.49 | 0.9 | 1.44 |
| LFN (with the same transmission as lead) | 2.1 | 1.51 | 1.25 | 1.45 |
Abbreviations: EBF, backscatter factor; LFN, putty metal (low backscattering - flexible - nontoxic)
Table 4.
The Thickness of Lead Required, the Reasonable Thickness of LFN to Reduce the Dose to 5% of the Maximum Dose of the Open Beam, the Thickness of LFN with the Same Transmission as Lead Required, and EBF at Two Depths in the Water Phantom Using the 9 MeV Electron Beam
| Variables | Depth1 = 2 cm | Depth2 = 3 cm | ||
|---|---|---|---|---|
| Thickness, mm | EBF | Thickness, mm | EBF | |
| Lead | 2.44 | 1.58 | 1.5 | 1.54 |
| LFN (reduced transmission below 5%) | 2.44 | 1.47 | 1.4 | 1.5 |
| LFN (with the same transmission as lead) | 2.96 | 1.47 | 1.82 | 1.45 |
Abbreviations: EBF, backscatter factor; LFN, putty metal (low backscattering - flexible - nontoxic)
5. Discussion
In order to validate the model employed for numerical simulations, the agreement between the simulated and measured PDD and beam profile should be provided.
As seen in Figure 1, the gamma index of PDD and dose profile are less than unity and within the accuracy of 3% and 3 mm, except for the dose profile of 6 and 9 MeV. There is a sharp increase in the gamma index near the edge of the field size. These errors were out of the field size and did not make serious problems because, in this investigation, the dose on the central axis was more important. Using an ion chamber as a dosimeter and happening multiple scattering in low energies could be the reasons for sharp increases in gamma index curves in the dose profiles of 6 and 9 MeV, as seen in Figure 1. The error near the field edge for 9 MeV is less than that of 6 MeV that may be due to less multiple scattering at 9 MeV compared to 6 MeV (20, 21).
In this study, another thickness of LFN was investigated, a thickness with the same transmission as the lead shield had. The results showed that the thickness of LFN was 1.2 times higher than that of lead, which still could be used in clinical conditions. This thickness of LFN is equal to the thickness reported by Lipowitz (22). The data of thicknesses are shown in Tables 3 and 4. Many studies have introduced different materials to replace lead and reported the thickness required for shielding. Tajiri et al. reported that the thickness required for shielding by Rad-block (hard plates) was slightly higher than that of lead, and the thickness of X-sheet (flexible shields) was 1.1 times higher than that required by lead (5).
The EBF values of LFN, shown in Tables 3 and 4, appear to be approximately 5% - 7% less than those of lead are. It was shown that electron backscattering and dose enhancement of LFN were less than those of lead were, and it needed a thinner thickness of the absorber to reduce dose enhancement due to electron backscattering.
LFN, a putty metal with 70% W, 18.61% Ni, and 11.39% C could be appropriate for internal shielding. It well fits the internal surfaces of the patient’s body. Moreover, unlike lead shields, it has no toxic material in composition, which reduces environmental pollution. Furthermore, when LFN is used for internal shielding, electron backscattering is less when compared to lead; at the same time, the required thickness of LFN is acceptable clinically.
Internal shielding is used to protect underlying tissues in electron therapy. Lead is widely used for internal shielding but it is a toxic environmental pollutant. It is also inflexible and does not well fit the patient’s body. This study investigated a lead-free and flexible material for internal shielding by Monte Carlo study.
Monte Carlo simulation played an important role in this study. The results of this study suggest a specific combination of W (70%), C (11.39%), and Ni (18.61%) for internal shielding in electron therapy. This material is flexible and much safer for the environment and the human body compared to lead. It well fits the internal surfaces of the patient’s body and can be easily customized to arbitrary shapes. Backscattering due to shielding reduces compared to when the lead shield is used and at the same time, it needs a thinner absorber to reduce dose enhancement due to backscattering. From this study, it can be concluded that lead can be replaced by LFN for internal shielding.