4.3. Data Analysis Using Design Expert Software
After designing the experiment, conducting tests under specified levels of each variable, and determining the response of each to predict the system's behavior even at untested points between the maximum and minimum levels of the variables, selecting a suitable model for data analysis is essential. Among linear, quadratic, and cubic models, the one most compatible with the data and variance analysis should be applied.
Table 6 presents the models used to determine the extraction yield based on mangiferin and the variables.
| Source | Sum of Squares | Degree of Freedom | Mean Square | F-Value | P-Value |
|---|
| Mean vs. total | 55712.75 | 1 | 55712.75 | | |
| Linear vs. mean | 754.43 | 4 | 188.61 | 24.55 | < 0.0001 |
| 2FI vs. linear | 12.84 | 6 | 2.14 | 0.22 | 0.9635 |
| Quadratic vs. 2FI | 159.5 | 4 | 39.88 | 46.39 | < 0.0001 |
| Cubic vs. quadratic | 5.39 | 8 | 0.67 | 0.61 | 0.748 |
| Residual | 6.64 | 6 | 1.11 | N/A | N/A |
| Total | 56651.56 | 29 | 1953.50 | N/A | N/A |
F-value and P-value were utilized to determine the correlation and compatibility of data with the suggested models. In ANOVA, F-value and P-value are calculated for quadratic and cubic equations. A higher F-value and a lower P-value indicate better data compatibility with the proposed model. As shown in
Table 6, the quadratic equation, with an F-value of 46.39 and a P-value of < 0.0001, respectively, had the most compatibility with data, and this equation was chosen as the proper model.
In addition, a lack of fit (LOF) test was applied to determine the validation of the proposed model. In this test, P-values show that the LOF with data is insignificant. Based on the results exhibited in
Table 7, the quadratic equation had an insignificant LOF with data. This showed that the selected model (quadratic model) is the most desired for data analysis in ANOVA.
| Source | Sum of Squares | Degree of Freedom | Mean Square | F-Value | P-Value |
|---|
| Linear | 182.27 | 20 | 9.11 | 17.30 | 0.0067 |
| 2FI | 169.43 | 14 | 12.1 | 22.98 | 0.004 |
| Quadratic | 9.93 | 10 | 0.99 | 1.88 | 0.2835 |
| Cubic | 4.54 | 2 | 2.27 | 4.31 | 0.1006 |
| Pure error | 2.11 | 4 | 0.53 | - | - |
The quadratic equation also showed the main effects of each variable and the interactions of the effects on each other. This exhibited more fitness and compatibility with the suggested model.
Table 8 shows the properly designed model.
| Sources | Sum of Squares | Degree of Freedom | Mean Square | F-Value | P-Value Prob > F |
|---|
| Model | 920.29 | 8 | 115.04 | 124.22 | < 0.0001 |
| X2 (min) | 8.3 | 1 | 8.30 | 8.96 | 0.0072 |
| X3 [solvent concentration (v/v%)] | 57.9 | 1 | 57.90 | 62.53 | < 0.0001 |
| X4 [solvent-to-powder ratio (mL/g)] | 686.9 | 1 | 686.90 | 741.73 | < 0.0001 |
| X1X4 | 2.91 | 1 | 2.91 | 3.14 | 0.0917 |
| X2X3 | 6.25 | 1 | 6.25 | 6.75 | 0.0172 |
| (temperature, °C) | 16.08 | 1 | 16.08 | 17.36 | 0.0005 |
| 20.53 | 1 | 20.53 | 22.17 | 0.0001 |
| 148.03 | 1 | 148.03 | 159.84 | < 0.0001 |
| Residual | 18.52 | 20 | 0.93 | | |
| LOF | 16.41 | 16 | 1.03 | 1.95 | 0.2731 |
| Pure error | 2.11 | 4 | 0.53 | N/A | N/A |
| Correlation total | 938.81 | 28 | N/A | N/A | N/A |
| R-squared | 0.9803 | - | - | - | - |
| Adj R-squared | 0.9724 | - | - | - | - |
| Pred R-squared | 0.9506 | - | - | - | - |
To achieve better fitness and compatibility, improper terms were removed. Accordingly, all terms with insignificant P-values (P-value > 0.1) were excluded from the final equation. The terms X
1, X
1X
2, X
1X
3, X
2X
4, X
3X
4 and
were deleted (
Table 8). Based on the final equation, the P-value and F-value are 0.0001 and 124.22, respectively, indicating that the model is well-defined for the data. The LOF P-value was 0.273, demonstrating that the LOF of the final model with the data was insignificant.
The correlation coefficient R2 and adjusted correlation (Adjusted R2) were 0.98 and 0.972, respectively, indicating that the proposed model accounts for more than 97% of the response variables. The predicted correlation (Predicted R2) of the model was 0.95, showing a strong correlation between predicted and actual values.
The final equation is as follows:
Where Y is the amount of extracted mangiferin from 1 gram of powdered mango leaves, X2 is time, X3 is the ethanol concentration as a solvent, and X4 is the solvent (mL) ratio to powdered mango leaves (g).
Using Design Expert software, a three-dimensional response surface graph was drawn. This plot examines the effects of two variables simultaneously and provides insight into the correlation between variables and response. The simultaneous relationship between two variables and the amount of mangiferin or extraction yield based on the amount of mangiferin is depicted, while the other two variables are at their median level.
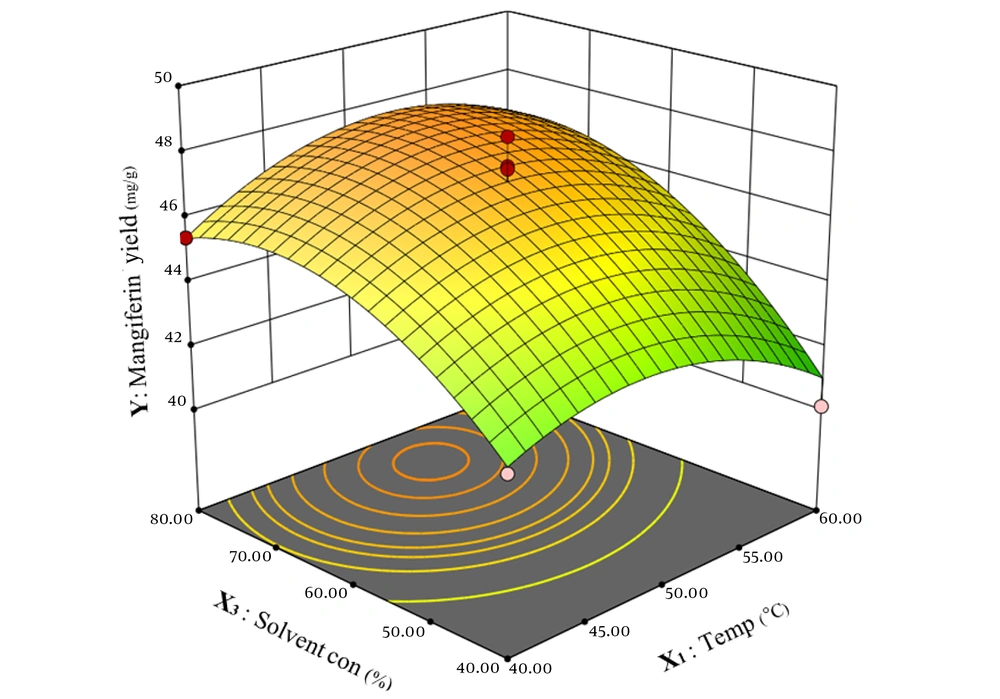
Figure 3 illustrates the simultaneous correlation of temperature and solvent concentration on mangiferin yield in the extraction process. As depicted in the figure, the effects of the two variables — temperature and solvent concentration — on the response are linear. Increasing the temperature from 40°C to approximately 50°C enhances the amount of mangiferin extracted. However, temperatures above 60°C lead to a reduction in the total extract and mangiferin content.
Similarly, solvent concentration exerts a comparable effect on mangiferin yield. As the ethanol concentration increases from 40% to about 70%, the amount of mangiferin improves non-linearly. Conversely, increasing ethanol concentration from 70% to 80% results in a reduction in mangiferin extraction.
Response surface graph for the effect of temperature and solvent concentration on the response (mangiferin amount in the extract); two other variables (extraction time and ratio of solvent to powdered leaves of mango) are constant
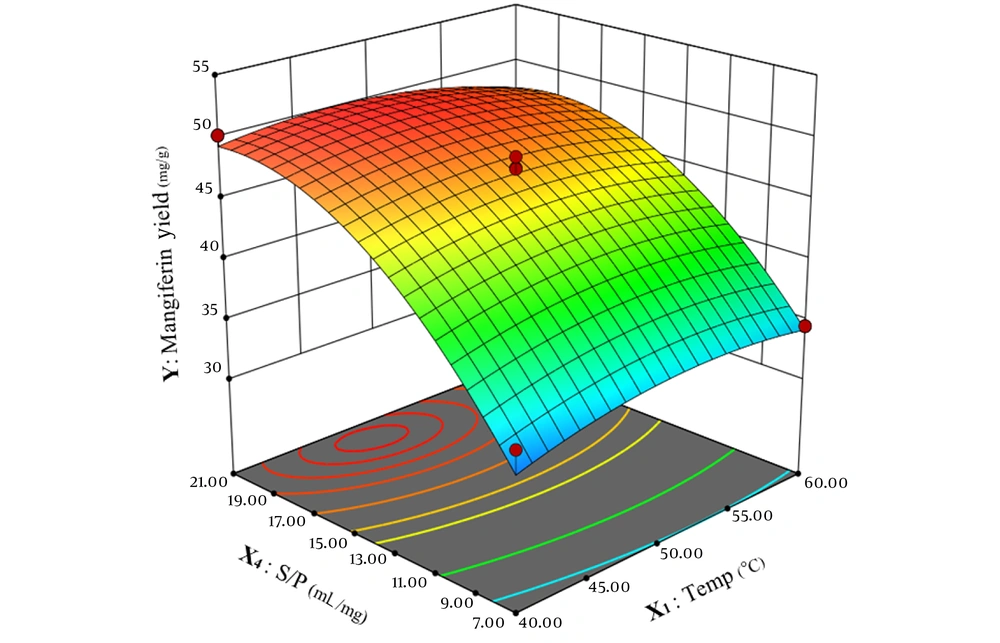
Figure 4 illustrates the simultaneous effects of temperature and the solvent-to-powdered leaves ratio on mangiferin yield. The plot indicates that increasing the ratio of solvent to powdered leaves from 7 to 19 results in an increase in both the total extract and the amount of mangiferin. However, further increasing this ratio beyond 19 shows no additional effect on the extraction process, with the total extract and mangiferin remaining constant. The temperature exhibits the same effect on the extraction process, and raising the temperature from 40°C to 45°C enhances the extraction process, and the amount of mangiferin increases in the extract. However, the temperature between 50°C to 60°C reduces the extraction yield, and as a result, the extracted mangiferin declines.
Response surface graph for the effect of temperature and solvent-to-powdered leaves ratio on the response (amount of mangiferin in the extract); two other variables (extraction time and solvent concentration) are constant
As shown in
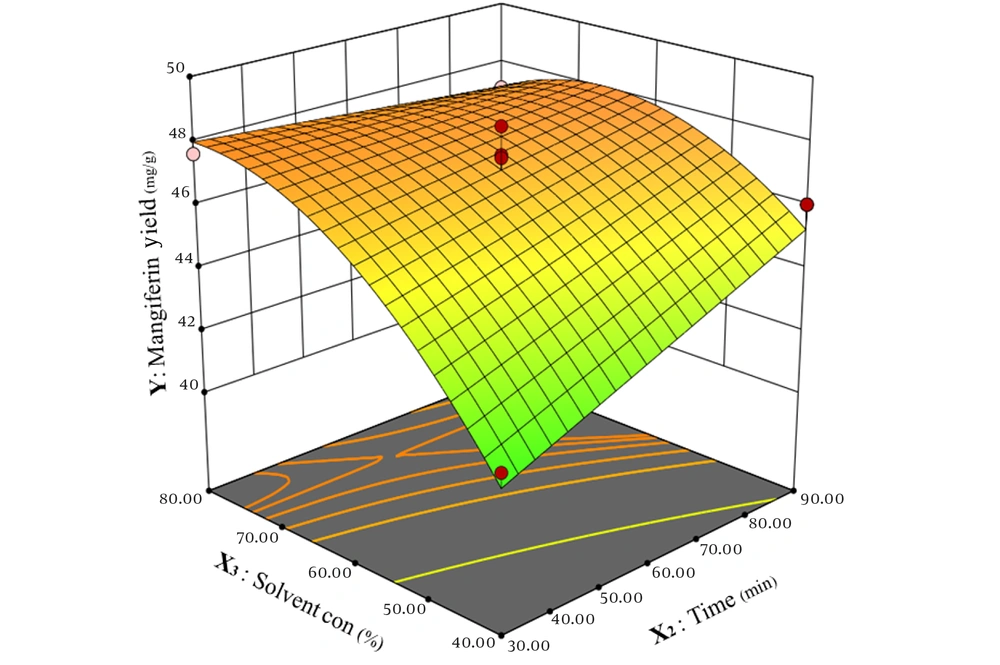
Figure 5, time exhibits a linear effect on mangiferin extraction. Increasing the extraction time from 30 minutes to 90 minutes results in a rise in the amount of extracted mangiferin. Solvent concentration, as another variable, demonstrates a non-linear effect on mangiferin extraction. Increasing the ethanol concentration from 40% to 80% enhances the amount of extracted mangiferin. However, at temperatures above 70°C, the extraction of mangiferin reaches its peak when using ethanol with a lower concentration.
Response surface graph for the effect of solvent and time on the response (amount of mangiferin in the extract); two other variables (temperature and solvent-to-powdered leaves ratio) are constant
According to
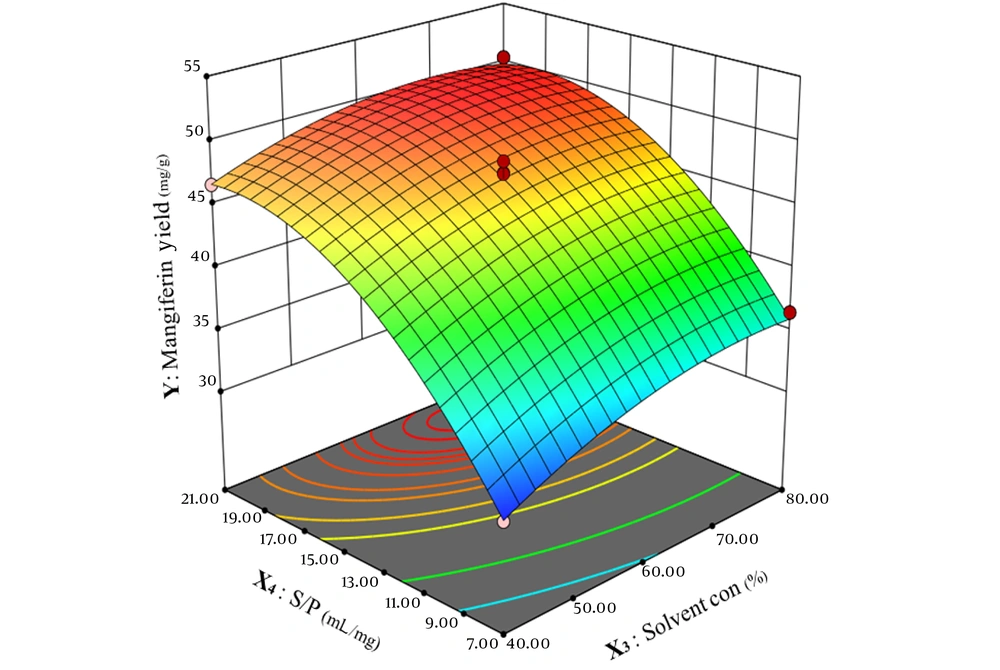
Figure 6, the effect of solvent concentration and solvent-to-powdered mango leaves is non-linear. The amount of extracted mangiferin reaches its peak when methanol concentration is 65% to 75%, and the ratio of solvent-to-powder is 18 to 21.
Response surface graph for the effect of solvent concentration and solvent-to-powdered leaves ratio on the response (amount of mangiferin in the extract); two other variables (temperature and time) are constant
As depicted in
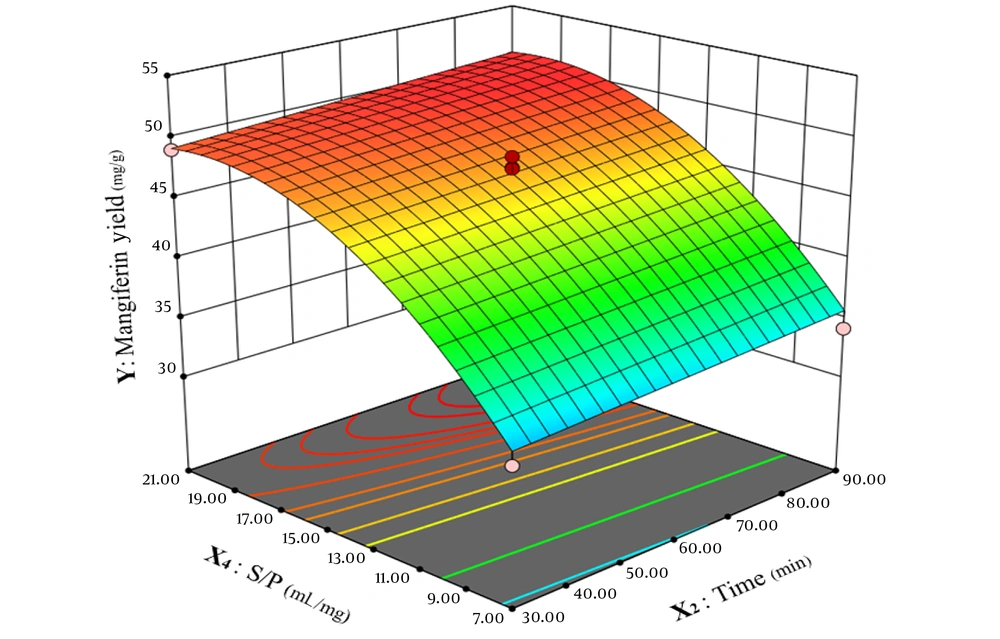
Figure 7, time shows the linear correlation to mangiferin extraction and enhancing time from 30 minutes to 90 minutes, improving the extraction process of mangiferin and the amount of mangiferin raised on a constant base. On the other hand, the correlation between solvent-to-powdered leaves of mango and mangiferin extract is non-linear, and elevating this ratio from 7 to 20 increases mangiferin extraction yield while raising the ratio of solvent-to-powdered leaves from 20 to 21 has no significant effect on mangiferin amount in the extract.
Response surface graph for the effect of time and solvent-to-powdered leaves ratio on the response (amount of mangiferin in the extract); two other variables (solvent concentration and temperature) are constant
As illustrated in
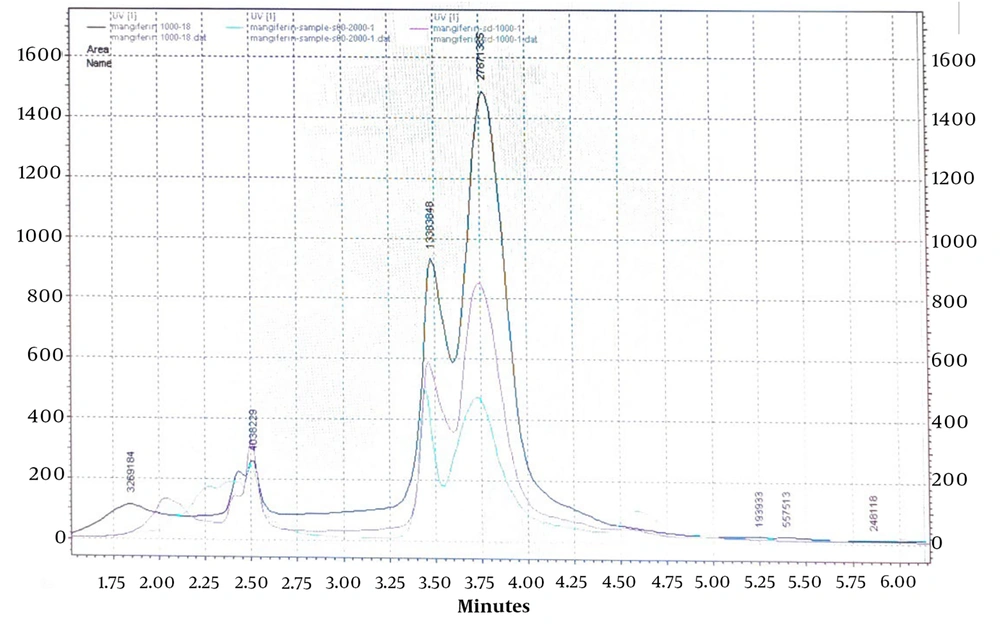
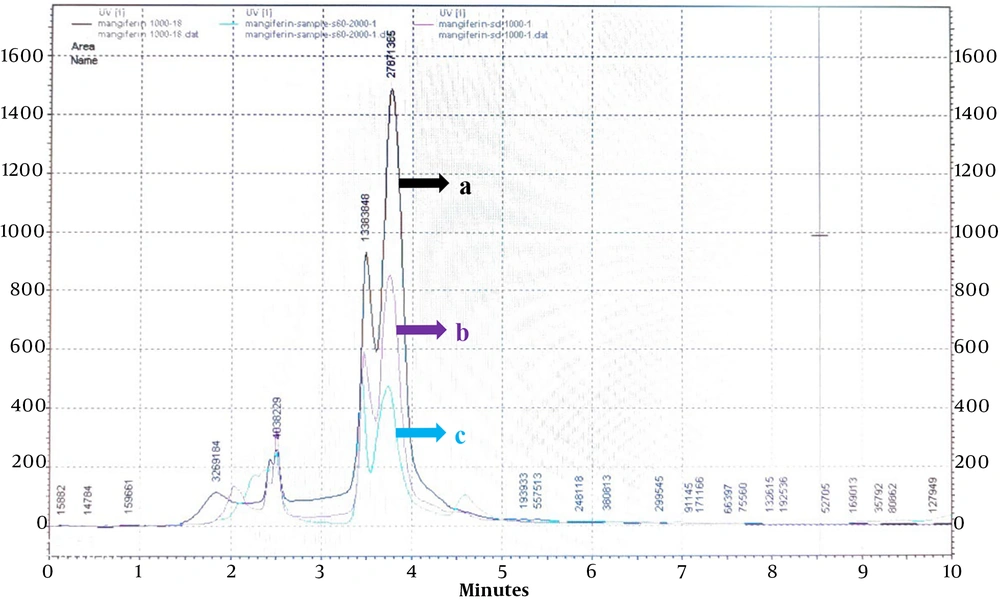
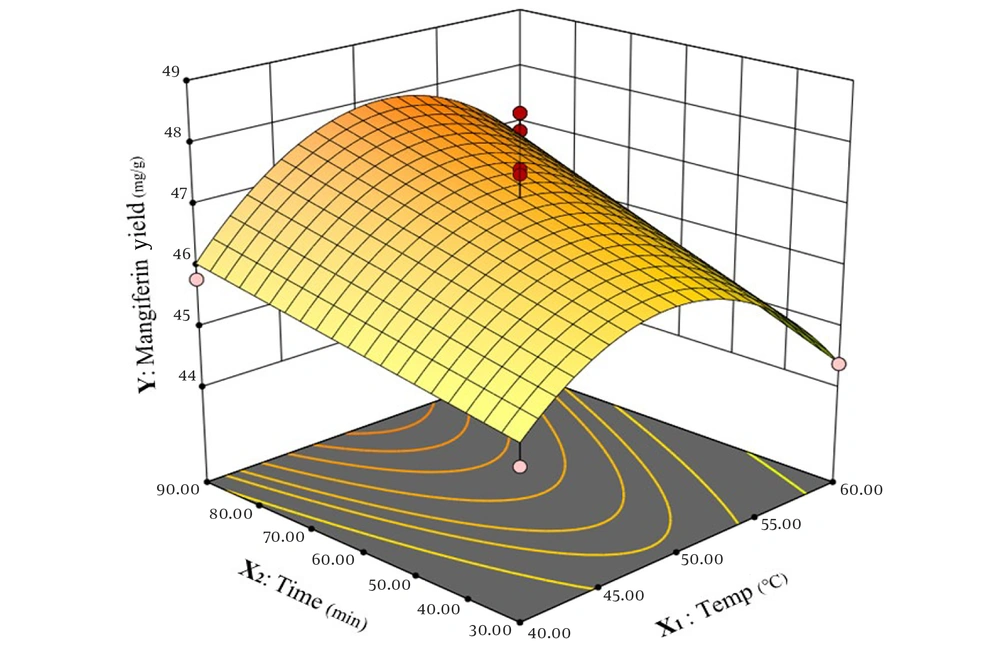
Figure 8, temperature has a non-linear effect on the extraction of mangiferin. The relationship between temperature and the extraction process of mangiferin does not follow a constant rate, with the highest yield of mangiferin obtained at 50°C. Additionally, there is a linear correlation between extraction time and the amount of mangiferin extracted, reaching a peak after 90 minutes. To determine the optimal points from the resulting equation for each variable, the derivative of each equation was computed. This process resulted in four equations with four unknown parameters, and the optimal points were obtained by solving these equations. Based on these points, the relationship and fit between the predicted and experimental amounts of mangiferin were investigated using the point with the highest yield to evaluate the model experimentally. According to the proposed model, the maximum amount of mangiferin extracted from 1 gram of powdered mango leaves was achieved under the following conditions: Temperature of 54°C, extraction time of 88 minutes, a solvent-to-powdered leaves ratio of 19:1, and a solvent concentration of 66% ethanol. It is predicted that under these conditions, 50.4 mg of mangiferin can be extracted from 1 gram of powdered leaves. The extraction of mangiferin was conducted based on the conditions described in section 3.3 to validate the experimental model. The obtained extract was then analyzed by HPLC, and the results are presented in
Table 9.
Response surface graph for the effect of time and temperature on the response (amount of mangiferin in the extract); two other variables (solvent concentration and solvent-to-powdered leaves ratio) are constant
| Std | Factor 1 (Temp) | Factor 2 (Time) | Factor 3 (S Con) | Factor 4 (S/P) | Extract (mg) | AUC (× 100000) | Mangiferin Con (mg/mL) | Yield (Mg-g) | Predicted Yield (Mg-g) | SD |
|---|
| 1 | 54 | 88 | 66 | 19 | 267 | 139.71 | 0.379 | 50.68 | 50.40 | 0.65 |
As shown in
Table 9, the experimental yield (50.68 mg) and predicted yield (50.4 mg) are remarkably close, validating the suggested model through experimental responses. This study successfully optimized the extraction of mangiferin from
M. indica (mango) leaves using the dynamic maceration method, providing significant insights into the variables affecting extraction efficiency. Utilizing RSM, the research identified optimal conditions for maximizing mangiferin yield: A temperature of 54°C, extraction time of 88 minutes, 66% ethanol concentration, and a solvent-to-leaf powder ratio of 1:19. Under these conditions, an impressive yield of 50.68 mg of mangiferin per gram of powdered leaves was achieved. The findings underscore that temperature, time, solvent concentration, and the ratio of solvent to powdered leaves influence extraction efficiency. Previous studies confirmed these results, suggesting that increased temperature enhances diffusion and solubility, thereby improving extraction rates. However, it is essential to note that excessively high temperatures may lead to solvent evaporation and potential degradation of mangiferin, which can diminish yield.
This study employed the dynamic maceration method to obtain an extract with the highest amount of mangiferin from M. indica (mango) leaves. The response surface statistical method was used to identify the variables involved in the extraction process that result in the highest amount of mangiferin extracted from the plant leaves. The response surface method efficiently investigates the simultaneous effects of several variables on the response and detects the interaction between the variables. Furthermore, it provides a model of the relationship between the different factors and their response, expressed as a function of the variables. The design of the experiment using the response surface method allows for the prediction of variables' effects on the response across the range of variable values, determining the levels of the variables that cause the maximum or minimum response by predicting the response value.
In this study, the response method was used to find the maximum response, applying the four variables of temperature, time, solvent concentration, and solvent-to-powdered leaves ratio, which significantly affected mangiferin extraction. The results showed that the optimal conditions to obtain the maximum amount of mangiferin from ethanol extract of mango leaves are as follows: Temperature, 54°C; time, 88 minutes; 66% ethanol; and solvent-to-powdered leaves ratio, 1:19. Under these conditions, 50.68 mg of mangiferin was extracted from 1 gram of powdered leaves, indicating that mangiferin comprises almost 5% of dried leaves and 19% of the total mango extract. Depending on extraction conditions, the maximum amount of mangiferin ranges from 30 to 60 mg. Factors such as the type of mango plant, climate conditions, soil, cultivation season, and extraction methods and conditions, including solvent and its concentration, extraction time, temperature, and pH, are essential in mangiferin extraction.
In optimizing mangiferin extraction from mango leaves using RSM and the Box-Behnken design method, four variables — ethanol concentration as the solvent, the ratio of solvent to mango leaf powder, temperature, and time of the extraction process utilizing ultrasonic waves — were investigated and optimized to obtain the maximum amount of mangiferin from mango leaves. The study showed that the optimal conditions were 44% ethanol, a solvent-to-powder ratio of 1:38, time of 19.2 minutes, and a temperature of 60°C. Under these conditions, the extraction efficiency of mangiferin was 58.46 ± 1.27 mg per gram of dry mango leaf powder (
25). Ultrasound-assisted extraction of mangiferin from
M. indica L. leaves by RSM demonstrated that the optimal extraction conditions were 44% ethanol, a liquid-to-solid ratio of 38:1, and extraction for 19.2 minutes at 60°C under ultrasound irradiation of 200 W. Under optimal conditions, the yield of mangiferin was 58.46 ± 1.27 mg/g (
32).
Using ultrasonic waves, two variables — temperature and time — were investigated and optimized to enhance the extraction of mangiferin and phenolic compounds from mango fruit peel. The optimal conditions for these variables were determined to be 54°C and 10 minutes, respectively, resulting in an extracted mangiferin amount of 3.2 mg per gram of dry powder (
33). In a study aimed at optimizing the variables involved in harvesting and extracting mangiferin from the leaves of
Swertia chirata of the Gentianaceae family, a complete factorial experiment design method was employed. The highest amount of mangiferin was obtained using an ultrasound extraction method with 50% ethanol solvent and a duration of 30 minutes, while variables such as temperature (40°C) and device power (200 W) remained constant. Under these conditions, the efficiency of mangiferin was 4.86% ± 0.19 of the plant's total dry leaf weight.
To optimize the extraction of mangiferin from
Phaleria macrocarpa fruits using a water system below the critical temperature and response surface method, temperature and extraction duration were investigated and optimized. The results indicated that the optimum temperature and extraction time were 105°C and 6 hours, respectively (
34). Under these conditions, the amount of mangiferin extracted was 38.7 mg per gram of dry powder (
35). In the dynamic maceration extraction method, the duration of extraction and solvent exposure to heat is much longer than in ultrasonic wave extraction. In this study, the solvent temperature first reached the desired level in the experiment design before adding the mango leaf powder to initiate the extraction process. Therefore, the results obtained in this study confirm previous findings on the effect of temperature on mangiferin extraction. Temperature influences diffusion, solubility, surface tension, and viscosity, providing the necessary energy to break the bonds between raw material components and making them available to the solvent. Thus, increasing the extraction temperature enhances the diffusion of compounds in the solvent and increases the extraction rate. However, this relationship is not necessarily linear, as solvent evaporation and potential oxidation and degradation of mangiferin at temperatures above 55 - 60°C may decrease the amount of mangiferin in the extract (
26,
36-
39).
Based on the obtained results, the relationship between extraction time and the amount of extracted mangiferin is linear. Increasing the extraction time from 30 to 90 minutes increases mangiferin efficiency with a relatively constant slope, as long-term exposure of the sample to the solvent provides sufficient time for the desired compounds to be extracted (
40). Zou et al. compared conventional extraction and microwave extraction methods for mangiferin extraction. In this study, 1 gram of dried mango leaf powder was added to 30 mL of 40% ethanol and mixed for 15 minutes using a stirrer to enhance solvent penetration. The mixture was then left at room temperature for 30, 60, 90, and 120 minutes to investigate mangiferin extraction. The results showed that increasing the extraction time from 30 to 120 minutes enhanced mangiferin extraction, although extending the time from 90 to 120 minutes reduced the amount of extracted mangiferin from mango leaves (
32).
The relationship between the solvent-to-powdered leaves ratio of mango leaves and the amount of extracted mangiferin is non-linear. Increasing this ratio from 7 to 20 elevates the yield of mangiferin non-linearly and then remains almost constant. Generally, a small liquid-to-solid ratio leads to lower extraction efficiency, while a larger ratio increases the solvent’s capacity to dissolve plant compounds, enhancing extraction efficiency. However, increasing this ratio also raises the volume of solvent used, leading to solvent wastage and decreased economic efficiency of extraction. Therefore, selecting an appropriate solvent volume is essential (
41).
Water, ethanol, and methanol are the most common solvents used in extracting plant compounds. Water is less expensive than other solvents, non-toxic to humans and the environment, and capable of dissolving a wide range of compounds. However, a mixture of water with other solvents provides higher extraction efficiency than using water alone (
32). Mangiferin, a molecule with medium polarity, is expected to dissolve in water, methanol, and ethanol (
26). Similar studies have demonstrated that these factors are more significant than others. Kaur et al. and Ramirez-Brewer et al. showed that these variable parameters are more effective than others (
34,
42). Zou et al. investigated that the optimal conditions for mangiferin yield were a 40% ethanol concentration, a 30:1 mL/g liquid-to-solid ratio, and an extraction time of 20 minutes at 60°C (
25). A study in 2019 demonstrated that acetone is more permeable than ethanol for the root of
Salacia chinensis, yielding 92 mg of mangiferin per gram of root (
43).
Before designing the experiment, different percentages of water, ethanol, and methanol solvents were compared regarding the weight of the extract obtained from mango leaves. The results showed that a combination of water and ethanol as a solvent produced the highest amount of extract from mango leaves. Based on the results, the relationship between ethanol concentration and mangiferin extraction efficiency is non-linear. Mangiferin extraction increases significantly with an increase in ethanol concentration from 40% to approximately 70%, while a concentration increase to 80% ethanol causes a slight decrease in efficiency. The statistical robustness indicates a strong correlation between experimental data and model predictions.
In conclusion, optimizing mangiferin extraction from M. indica leaves through dynamic maceration using RSM enhances our understanding of the extraction process and lays a foundation for future research to improve efficiency and yield in phytochemical extractions. Dynamic maceration offers advantages in terms of simplicity and lower initial equipment costs, and this method is preferable to the ultrasonic method due to a lower rate of degradation. This standardization is crucial for pharmaceutical and nutraceutical applications. However, other factors such as pH, plant maturity, and post-harvesting handling should be explored. Additionally, other eco-friendly extraction methods and green solvents may influence the yield of this process. Further investigations into varying environmental conditions and alternative methods could yield even more efficient extraction protocols for this valuable compound.