


1. Background
Bacteriocins are antimicrobial peptides mainly produced by lactic acid bacteria naturally present in food. Because they are easily broken down and digested in the digestive system by proteolytic enzymes, they are considered natural and safe food preservatives (1). They are colorless, odorless, and tasteless compounds and can be used in food without changing its organoleptic characteristics (1-3). Therefore, they satisfy the demand of consumers for high-quality and safe food without using chemical preservatives (3). Nisin is the only bacteriocin licensed as a bio-preservative and has been widely used in related food industries (3). This bacteriocin, which is heat resistant and consists of 34 amino acids, has a molecular weight of 3.5 kDa and is produced by Lactococcus lactis. In 1988, nisin was accepted as GRAS by the FDA. Its usage in its free form as a preservative in food products is limited due to its absorption with food components and its uncontrolled reactions with food compounds (such as fat and protein) and its decomposition (4, 5). In addition, low solubility or uneven distribution of its molecules in food products can also severely affect its antibacterial properties. To solve this problem, other preservation methods are needed to increase nisin’s antibacterial activity (2, 3).
Encapsulation of nisin in nanocarriers can protect nisin from interaction with food components. It is one of the solutions that can preserve and control its release in food products (3, 5). In this regard, some studies have been conducted and reported on the encapsulation and controlled release of nisin in liposomes and biopolymers such as zein, cellulose, chitosan, starch, alginate, and lactic polyacid (6-11). According to the results of a study by Mirhosseini and Dehghan, the biodegradable film of chitosan-cellulose-nisin was able to inhibit the growth of spoilage bacteria in meat for 26 days (7). The results of the study by Hassan et al. showed that nisin encapsulated in alginate and corn starch inhibited the growth of Clostridium thyrobutyricum in cheddar cheese (9). Also, according to the study by de Freitas et al., the biodegradable film of hydroxypropyl methylcellulose containing nisin inhibited the growth of Staphylococcus aureus and Listeria inocula in mozzarella cheese (10).
Niosomes are colloidal particles formed by the accumulation of non-ionic surfactants in the aqueous medium, creating a layered structure with hydrophilic and hydrophobic properties. Their unique structure enables them to encapsulate hydrophobic substances in the lipid part and hydrophilic substances inside their aqueous core. Therefore, they can trap compounds with different solubilities. They are carriers for the release of antibacterial agents with desirable release properties, high half-life, and low toxicity, which improve their effectiveness and have advantages such as chemical stability and low cost (4, 12).
Considering the aforementioned, it is of particular importance to find a practical and efficient method that can improve the biological activity of nisin in food preservation. Despite studies conducted to find methods to improve the activity of nisin, such as encapsulation in liposomes and polymers (7, 9, 10), according to the reviews conducted so far, no study has been conducted on the encapsulation of nisin in niosomes and its characteristics to suggest its use in food products. Therefore, considering the advantages of niosomes, this study aimed to load nisin into a niosomal nanocarrier system and investigate its physicochemical properties to use it as a preservative-containing nanocarrier for use in the food industry.
2. Objectives
The present study aimed to encapsulate nisin in niosomes and investigate its characteristics to achieve an optimal formula based on formulation variables, cholesterol to surfactant ratio, maximum loading percentage, and sustained release pattern for use as a preservative-containing nanocarrier in the food industry.
3. Methods
3.1. Materials Preparation
The chemicals used in this study include sorbitan monostearate (Span 60) and polysorbate 80 (Tween 80) from Quelab, UK; cholesterol, chloroform, and methanol from Merck, Germany; nisin powder (w/w) 2.5% from Arnova, Turkey; a dialysis bag MWCO 12 KD from Sigma Aldrich, USA; and phosphate buffered saline (PBS) from Medicago, Sweden.
3.2. Preparation of Nisin Solution
To prepare a stock solution of nisin with a concentration of 400 μg/mL, 0.8 g of nisin powder (2.5%) was dissolved in 10 mL of 0.02 molar HCl solution. After passing through a 0.22-micron syringe filter, the solution was brought to a volume of 50 mL in a volumetric flask (6).
3.3. Niosomal Formulation
In this study, nanoniosomes containing nisin were prepared by the thin film hydration method of Moghtaderi et al., with a slight modification. In short, non-ionic surfactants with different molar ratios (Table 1) and cholesterol were dissolved in the organic solvent of chloroform and methanol (in a ratio of 2:1). Then, the organic solvents were evaporated under vacuum using a rotary evaporator (Heidolph, Germany) at a temperature of 50ºC and 120 rpm for 20 minutes, forming a thin layer film on the balloon wall. The thin layer film was then hydrated with 10 mL of 200 μg/mL nisin solution (5 mL of 400 μg/mL nisin solution and 5 mL of PBS buffer) using a rotary evaporator at 55ºC for 60 minutes at 120 rpm to obtain a niosome suspension. To reduce the size of niosome particles, the suspension was sonicated using an ultrasonic bath machine (Elma, Germany) for 20 minutes (13).
Table 1.Different Niosome Formulations Synthesized Based on Molar Ratios of Cholesterol and Surfactant
| Formulations | Cholesterol Molar Ratio (Percentage) | Span 60 Molar Ratio (Percentage) | Tween 80 Molar Ratio (Percentage) |
|---|---|---|---|
| F1 | 30 | 15 | 55 |
| F2 | 30 | 35 | 35 |
| F3 | 30 | 55 | 15 |
| F4 | 20 | 20 | 60 |
| F5 | 20 | 40 | 40 |
| F6 | 20 | 60 | 20 |
3.4. Encapsulation Efficiency Determination
Encapsulation efficiency is the ratio of nisin included in the niosome structure to the initial nisin consumed. To determine the amount of encapsulated nisin, the niosome suspension containing nisin was centrifuged (Vision, Korea) at 2ºC and 22,000 rpm for 30 minutes. The optical absorption of free nisin in the supernatant was read and calculated using a UV-Visible spectrophotometer (SHIMADZU, JAPAN) at a wavelength of 220 nm. The amount of nisin entrapment was calculated using Equation 1 (14, 15).
Equation 1.
3.5. Release Behavior
The release pattern of nisin from the niosome nanosystem was investigated using the method of Wang et al. with slight modifications (5). This was done using a dialysis membrane in lab conditions at 25ºC and PBS buffer with pH = 7. For this purpose, after separating the niosomal precipitate from its supernatant, it was diluted with 2 mL of deionized water and placed on the dialysis membrane of the diffusion cell. A certain amount of PBS buffer and a magnet were placed in the cell compartment of the diffusion dialysis chamber, and the entire cell set was placed on a magnetic stirrer. At specific time intervals (1, 2, 3, 4, 8, 24, 48, and 72 hours), 1 mL of the solution was removed from the receiving chamber as a sample and replaced with an equal volume of fresh PBS. The optical absorption of the samples was read by a spectrophotometer at a wavelength of 220 nm, and the nisin concentration was calculated using a standard concentration curve. The standard curve of nisin at different concentrations was previously determined and plotted as a straight line with the equation Y = 0.0182X + 0.0498 and R2 = 0.998, and a graph was drawn showing the cumulative release of nisin over 72 hours (5).
3.6. Size and Dispersity Determination
The size of niosome particles was measured and determined using the dynamic light scattering (DLS) method with the Scattroscope 1 device, and it was measured in three repetitions. The Particle Size Distribution Index was also calculated using Equation 2 (16).
Equation 2.
D(90%) is a value indicating that 90% of the particles are smaller than this size, D(10%) is a value indicating that 10% of the particles have a particle size smaller than this, and D(50%) is the "average size", meaning that 50% of the particles are smaller than this value.
3.7. Morphology Study
Atomic force microscopy (AFM) was used to investigate the shape and appearance of niosomes containing nisin. For this purpose, niosome suspension (1:100) was diluted with deionized water, and some of it was poured on a glass slide. The glass was then placed at room temperature until the samples were dried and a thin layer was formed on the slide. Images were taken using an atomic force microscope (17).
3.8. Fourier Transform Infrared
Nisin samples, niosome suspension without nisin, and niosome suspension encapsulated with nisin were exposed to the infrared spectrum. The samples were mixed with KBr and pressed into tablets, and the samples’ Fourier transform infrared (FTIR) spectra were investigated to analyze the functional groups in the wavelength range of 400 - 4000 cm-1. Finally, FTIR spectra of niosome systems containing nisin and without nisin were compared to investigate the possible chemical interactions between nisin and the nanosystem (18).
3.9. Statistical Analysis
EXCEL and SPSS software were used to draw graphs and analyze data. The data were analyzed using one-way analysis of variance (ANOVA), and the significance of the difference between means was examined using Duncan’s test with a confidence level of 95%.
4. Results
4.1. Nisin Encapsulation and Release Pattern
The results of the encapsulation percentage of nisin extracts in different formulations are given in Table 2. Based on that, the encapsulation efficiency of nisin in different formulas varied from 27.7% to 36.3%. Additionally, the accumulation percentages of released nisin varied from 20.29% to 38.6% over 72 hours, as shown in Figures 1. and 2. The rate of encapsulation and release of nisin over 72 hours for formulas containing 30% cholesterol was higher than for formulas containing 20% cholesterol. The percentage of nisin encapsulation and release increased in formulas containing 30% cholesterol with an increase in the molar ratio of Span 60 to Tween 80 and in formulas containing 20% cholesterol with an increase in the molar ratio of Tween 80 to Span 60.
| Formulation | Encapsulation Efficiency %EE | Mean Size (nm) | Dispersity | % Release (72 hr) |
|---|---|---|---|---|
| F1 | 34.30 ± 2.37 ab | 140.60 ± 19.90 | 0.979 ± 0.08 | 29.54 ± 0.30 d |
| F2 | 36.30 ± 1.05 a | 200.00 ± 12.00 | 0.965 ± 0.06 | 32.00 ± 0.64 c |
| F3 | 27.80 ± 1.55 c | 139.30 ± 14.30 | 0.975 ± 0.01 | 38.60 ± 0.19 a |
| F4 | 27.70 ± 1.95 c | 244.00 ± 10.70 | 0.974 ± 0.03 | 33.83 ± 0.25 b |
| F5 | 32.70 ± 1.14 ab | 255.00 ± 43.00 | 0.98 ± 0.02 | 21.84 ± 0.02 e |
| F6 | 31.30 ± 0.83 bc | 137.00 ± 30.00 | 0.99 ± 0.04 | 20.29 ± 0.51 f |
a Values are expressed as mean ± SD.
b The letters a, b, c, d, e, and f in each column signify statistically significant differences among the means (P < 0.05).
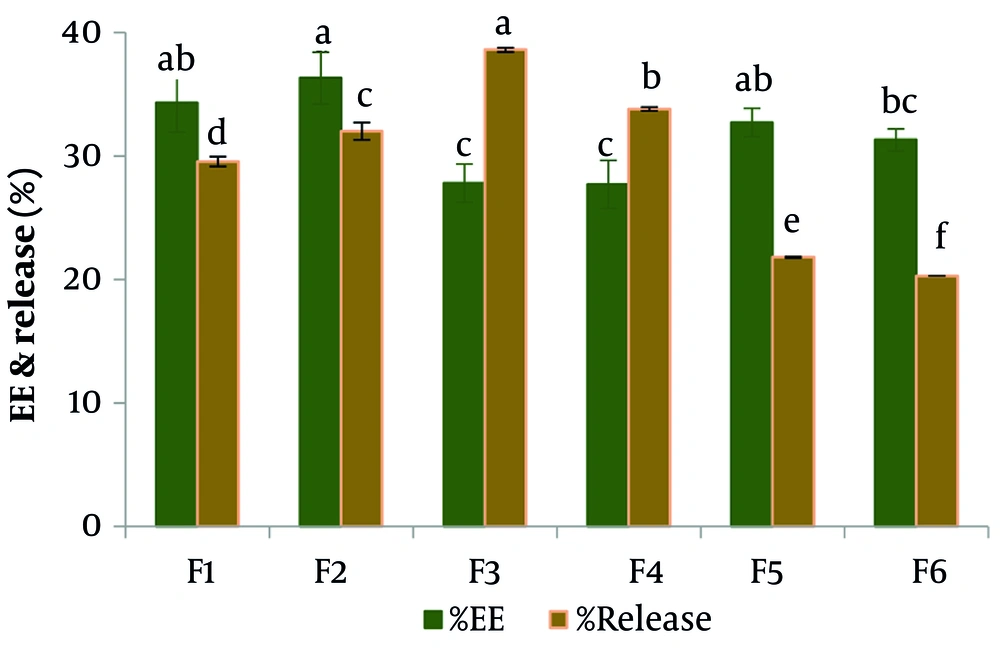
Figure 1.
Comparison between the nisin encapsulation and release in different formulas. Letters a, b, c, d, e, and f in each column are significant differences between the means ( P < 0.05)
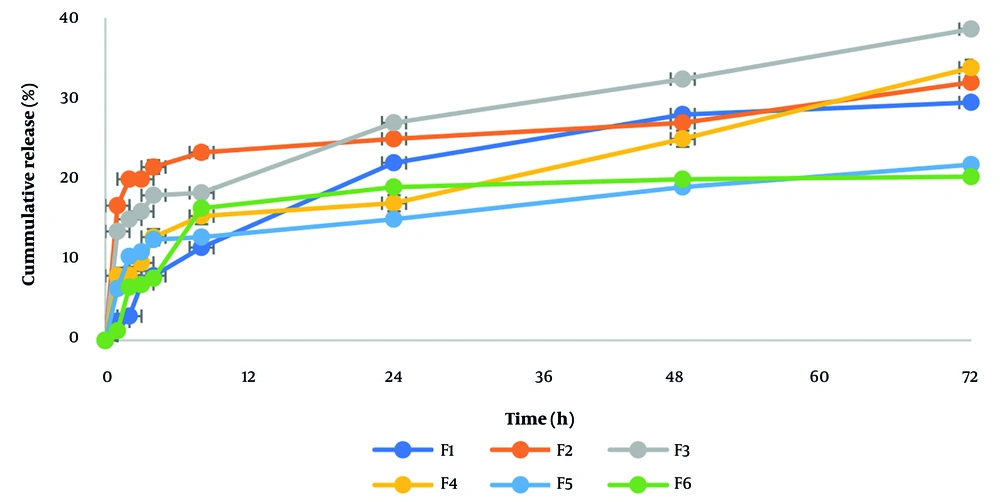
Figure 2.
Comparison between the release patterns of nisin from noisome formulas in 72 hours
4.2. Size and Dispersity
The results of measuring nanoparticles (Table 2) showed that nisin-containing nano-niosomes have an average size of 137.00 - 255.00 nm with a Dispersity Index (DI) of 0.96 to 0.99.
4.3. Infrared Spectroscopy
The FTIR spectroscopy was used to determine any possible chemical interaction between nisin and the niosome nanocarrier. Figure 3 shows the FTIR spectrum of nisin, empty niosomes, and the niosomes containing nisin. In the spectrum of nisin, which is an amino acid compound with -NH2 and -COOH functional groups, the stretching vibrations related to -COOH and -NH2 groups in the region of 3447 cm-1 are relatively broad and strong, and the peaks related to the vibrations of urethanes and carbonyl groups (C=O) are observed in the region of 2073 cm-1 and 1638 cm-1, respectively. The bending vibrations of CH2 groups also appeared in the region of 661 cm-1. In the FTIR spectrum of niosome suspension encapsulated with nisin, stretching vibrations related to COOH and NH2 groups are observed in the region of 3453 cm-1 as a relatively broad and strong peak. This peak has been shifted compared to the corresponding peaks in the niosomal suspension (3437 cm-1) and nisin (3447 cm-1), which is attributed to the hydrogen bonds created through hydroxyl and amine groups. The peaks related to the vibrations of urethanes and carbonyl groups (C=O) present in the niosome suspension and nisin are observed in the region of 2081 cm-1 and 1638 cm-1, respectively. The peak related to the C-O stretching vibrations of ester groups can also be found in the region of 1103 cm-1, confirming the presence of niosome compounds in this sample. The bending vibrations of the CH2 groups of niosome and nisin compounds are also observed in the region of 658 cm-1.
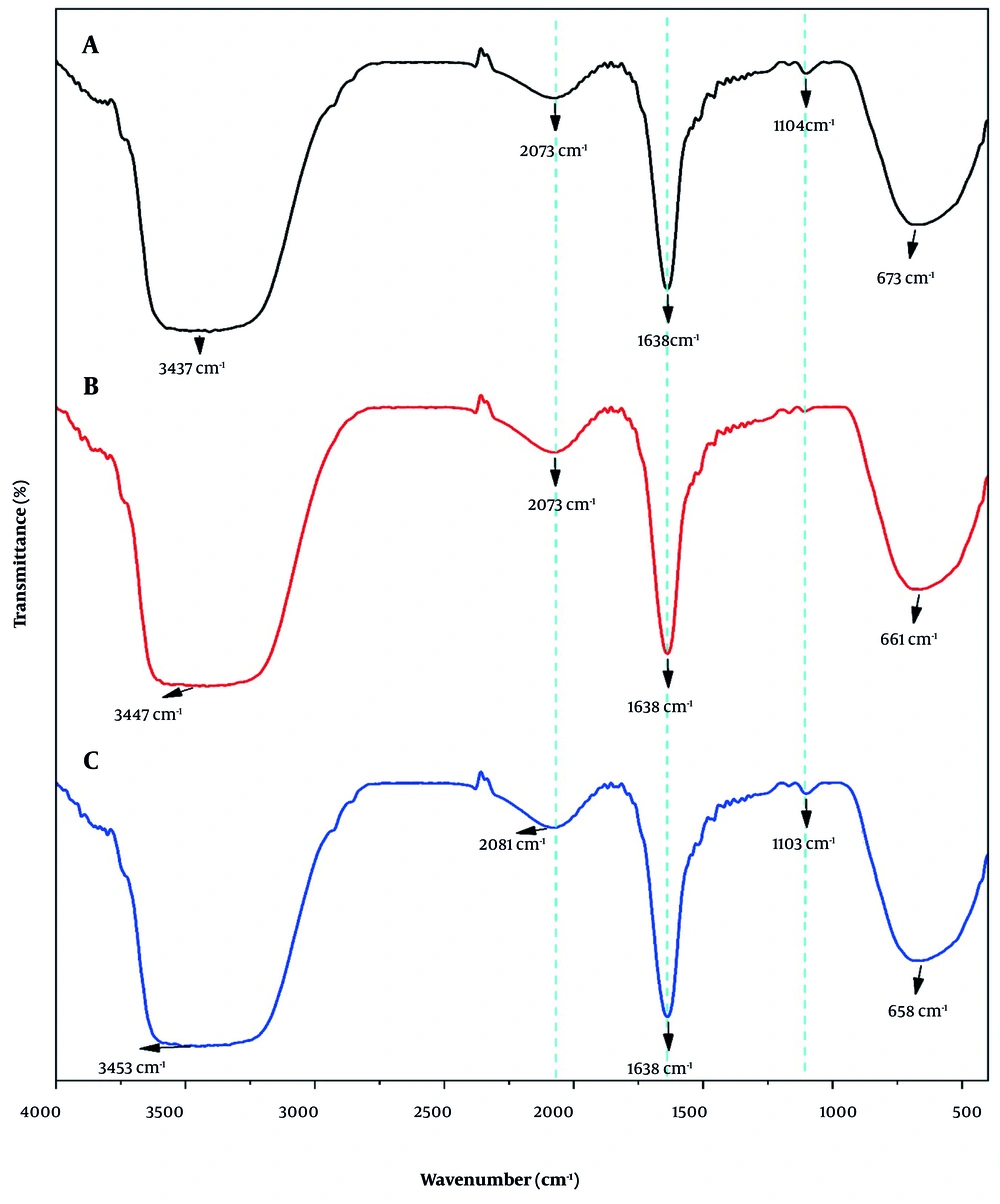
Figure 3.
FTIR spectrum of A, nisin; B, empty noisome; and C, niosome containing nisin
4.4. Atomic Force Microscopy Image of Nisin-Containing Niosomes
The morphology of niosomes containing nisin was evaluated by AFM imaging (Figure 4). The results showed that the nanoparticles encapsulated with nisin were spherical, and the size of the nanoparticles was in the range of 90 - 110 nm, which was smaller than the results observed by the DLS method.
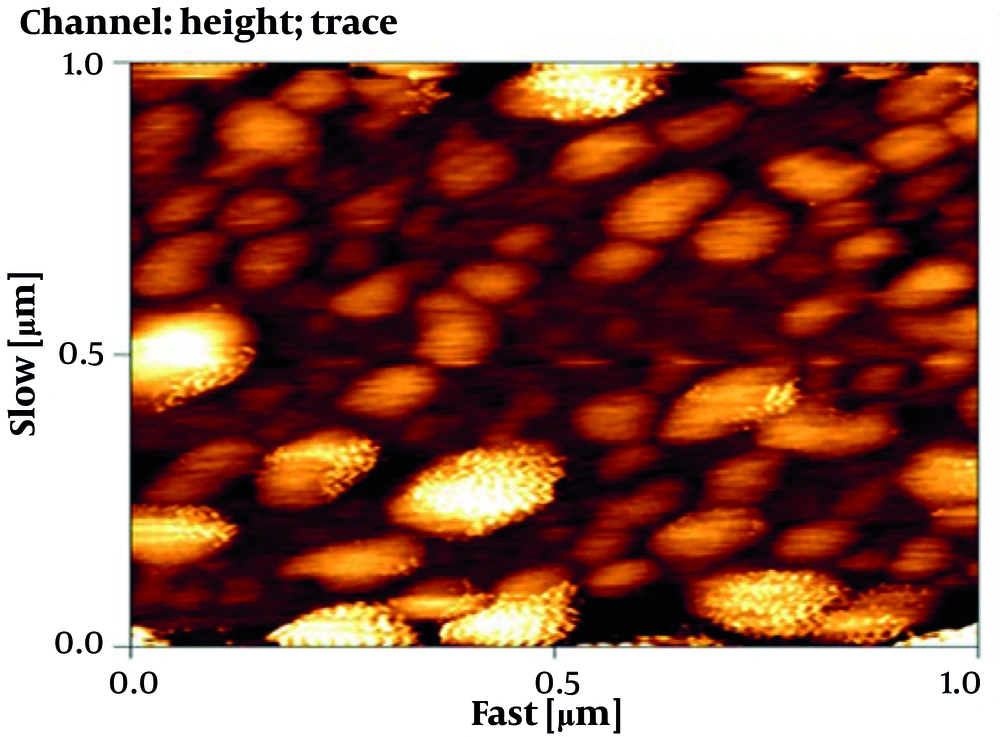
Figure 4.
Atomic force microscopy (AFM) image of nisin-containing niosomes
5. Discussion
As mentioned in the introduction, nisin, as a natural antibacterial, is the only bacteriocin licensed as a bio-preservative, but its tendency to bind to food components and degrade them reduces its effectiveness. Encapsulation is one of the solutions that can preserve this bacteriocin and control its release in food products. In this study, which was conducted to investigate the possibility of encapsulating nisin in niosomes, we succeeded in encapsulating nisin in niosomes, and its physicochemical properties were investigated to assess the feasibility of using it as a nanocarrier containing a preservative for use in the food industry. Based on the results, the encapsulation efficiency of nisin in different formulas varied from 27.7% to 36.3%. Similarly, the entrapment rate of nisin in nanoliposomes with different formulations was reported to be between 12% and 54% in the study of Colas et al. and 70.3% in the liposomes studied by Zou et al. Also, the encapsulation efficiency of nisin in nanoliposomes prepared by Poul et al. was reported to be 32.19%, which increased to 75% with chitosan coating (17, 19, 20). Tizchang et al. reported the encapsulation efficiency of nisin in their study liposomes as 30% and attributed the low encapsulation efficiency to the presence of cholesterol, the nature, and purity of the encapsulated material based on a previous study (21).
As shown in Figures 1, and 2, the accumulation percentages of released nisin varied from 20.29% to 38.6% over 72 hours. Figure 2 shows the slope of the nisin release graph is steeper at first, indicating the rapid release of nisin in the early hours. Previous studies attribute this to the presence of nisin on the surface of the nanocapsules or near it (5). Following that, the slope of the graph decreases, showing that the trends of nisin release are stable over a longer period. The results also showed that, in general, the rate of encapsulation and release of nisin over 72 hours for formulas containing 30% cholesterol was higher than for formulas containing 20% cholesterol. Previous studies have shown that increasing cholesterol in the structure of nanoparticles can speed up the release from the system, but excessive cholesterol causes instability of the synthesized nanoparticles (22).
The percentage of nisin encapsulation and release increased in formulas containing 30% cholesterol with an increase in the molar ratio of Span 60 to Tween 80 and in formulas containing 20% cholesterol with an increase in the molar ratio of Tween 80 to Span 60. In both formulas F3 (30% cholesterol group with the highest percentage of Span 60) and F4 (20% cholesterol group with the highest percentage of Tween 80), the lowest encapsulation and highest release were observed, and the results of statistical analysis do not show a significant difference (P > 0.05). The maximum encapsulation efficiency was found in the F2 formula with a 1:1 ratio of surfactants and 30% cholesterol, which had a significant difference with formulas F4, F6, and F3 (P < 0.05). Although there was no significant difference with formulas F1 and F5 (P > 0.05).
Entrapment efficiency is an important parameter for the industrial application of the niosomal system. This efficiency depends on the components of the carrier (18). Due to the higher amount of encapsulation (36.3%) and the more stable nisin release pattern over 72 hours, formula F2 was chosen as the optimal formulation. The drug release profile is also considered one of the most fundamental practical aspects of nanocarriers (23). Given the instability of nisin in the food system, its release pattern from the niosome must be such that it can both exert its antimicrobial effect and last until the end of the product’s shelf life, although more and more accurate studies are needed to meet these goals. In this study, due to the nisin release pattern in the F2 formula, it was selected as the optimal formula. The size and Dispersion Index of nanoparticles in the optimal formula were 200.00 ± 12.00 nm and 0.96, respectively.
In a similar study, curcumin-containing niosomes with different molar ratios of Tween 80, Span 60, and cholesterol were prepared, showing that their particle size and Dispersion Index varied from 344 to 1800 nm, and 0.137 to 0.954, respectively. It was also reported that by increasing the amount of Span 60 and Tween 80, the size of the vesicles increased and decreased, respectively (24). According to the results of the present study, the size of F4 - F6 niosomes (20% cholesterol group) was also reported to be larger with increasing Span 60. In the study of Akhlaghi et al., the particle size of nanoniosomes containing licorice extract was reported to be 90.7 ± 3.6 nm and its Dispersion Index was 0.53 (25). In the study of Machado et al., the average size of niosomes containing the antioxidant resveratrol was reported to be 445 nm and its Dispersion Index was 0.37 (26). The Dispersion Index represents the population size distribution in a certain sample and is usually expressed as an index of particle diameter in colloidal systems. The lower the level of this index, the more uniform the diameter of the particles, with the numerical value of DI ranging from 0.0 (for a completely uniform sample regarding particle size) to 1.0 (for a much-dispersed sample with several particle size populations). In drug delivery applications using lipid-based carriers, such as liposome and nanoliposome formulations, a DI of 0.3 or less is considered acceptable and indicates a homogeneous population of phospholipid vesicles. Although the latest edition of the FDA’s "Industry Guidance" on liposome drug products emphasizes the importance of size and size distribution as "critical quality characteristics" and the essential components of the stability of these products, it does not specify acceptable DI criteria. More specific standards and guidelines are needed for the acceptability of the DI range of the product for various applications in food, cosmetics, medicine, etc., to be regulated by regulatory authorities (27).
The FTIR spectroscopy was used to determine any possible chemical interactions between nisin and the niosome nanocarrier. Based on the results, the peaks of stretching vibrations related to COOH and NH2 groups are observed in the region 3437 - 3453 cm-1, the peaks related to urethane vibrations in the region 2073 - 2081 cm-1, and the peaks related to carbonyl C=O groups and secondary amines in the region 1638 cm-1. The bending vibrations of CH2 groups also appeared in the region 661 cm-1 (28-32). In the nisin-containing niosomes, the stretching vibrations related to COOH and NH2 groups in the region 3453 cm-1 have shifted compared to the corresponding peaks in the empty niosomes (3437 cm-1) and nisin (3447 cm-1), which is attributed to the hydrogen bonds formed through hydroxyl and amine groups. Also, the peak values of nisin, nisin-containing niosomes, and empty niosomes, are approximately at wave numbers 2073 and 1638 cm-1, and have a small shift. Since no new peaks were created and no peaks disappeared in the FTIR spectrum of the nisin-containing niosome system, it indicates that there is no chemical interaction between nisin and the carrier compounds and both have maintained their nature. In a similar study by Bernela et al., nisin was loaded into an alginate-chitosan composite, which according to the FTIR results, peak 3288 was attributed to the OH stretching of the COOH group, peak 2960 to the C-H stretching, and peak 1232 to the O-H group. They also attributed the peak at 1645 to the amide group and the peak at 1527 to the bending of the primary amines. They reported that the functional groups of the polymeric materials on the surface of the nanoparticles had almost the same chemical properties as nisin, indicating that chemical interactions between the functional groups of nisin and the polymer, which could change the chemical structure of nisin, did not occur (14).
The morphology of niosomes containing nisin was evaluated by AFM imaging. Based on the results of AFM, the size of the nanoparticles was smaller than the results observed by the DLS method. In accordance with AFM image results in this study, similar findings have been reported by other researchers, due to the fact that the particle size analyzer measures the hydrodynamic diameter of the particle in its original environment and cannot distinguish between nanoparticle impurities (14, 15). They have reported the occurrence of shriveling and shrinking of nanoparticles during the sample drying process for electron imaging (33, 34).
5.1. Conclusions
The use of nisin as a natural preservative in food can be an effective measure to meet the demands and reduce the concerns of consumers about the presence of chemical preservatives in food. It is of particular importance to protect food and gradually release this preservative to make it effective for a long time. In this study, niosome nanoparticles containing nisin were prepared using Span 60 and Tween 80 surfactants, which are allowed to be used in the food industry, by the thin film hydration method. From among them, the optimal formula with the appropriate amount of encapsulation and release was selected. Its other characteristics, including size, form, and the lack of chemical interaction of nisin with formulation components, were evaluated and confirmed by DLS, FTIR, and AFM methods. The results of the present study show that the use of a niosomal system carrying nisin in food is a suitable solution for the limitations, such as reduction in effectiveness and increase of the dose of the preservative, which can prevent problems related to the binding of nisin to food components by gradual release of nisin during the storage of food products. However, considering the tendency of nisin to bind to food components, which leads to a decrease in its biological activity in the food system, it is necessary that the amount of nisin encapsulation and its release should be such that it can perform its antimicrobial effect and persist during the product’s shelf life. To achieve these goals, further studies are needed in this field.


