


1. Background
2. Objectives
3. Methods
3.1. Materials
3.2. Fish Preparation and Sample Treatment
3.3. Plant Extract Preparation
3.4. Antimicrobial Activity Assessment
3.5. Film Preparation and Characterization
3.6. Analytical Methods
3.6.1. pH Measurement
3.6.2. TBARS Analysis
3.6.3. TVB-N Determination
3.6.4. Peroxide Value
3.7. Microbiological Analysis
3.8. Sensory Evaluation
3.9. Statistical Analysis
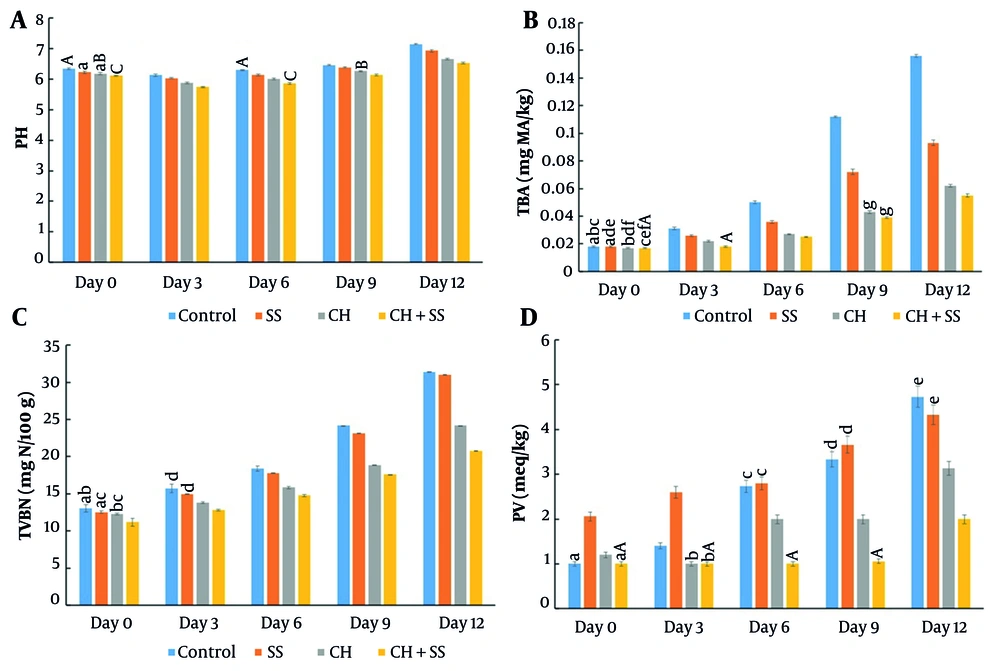
Changes in chemical quality parameters of trout fillets during 12-day storage at 4°C: A, pH; B, TBARS; C, TVB-N; and D, peroxide values (lowercase letters indicate no significant difference between treatments; capital letters indicate no significant difference between storage days within the same treatment; values are expressed as mean ± SD, n = 3; P > 0.05).
![Microbial dynamics in trout fillets during 12-day storage at 4°C: A, total viable count (TVC); B, psychrotrophic bacteria count (PTC); C, <i>Pseudomonas</i> count (PSC); and D, yeast and mold count [data represent mean ± SD for control, chitosan (CH), <i>S. striata</i> extract, and CH film incorporating with <i>S. striata</i> extract (CH+SS) treatment groups (log CFU/g). Lowercase letters indicate no significant difference between treatments; capital letters indicate no significant difference between storage days within the same treatment; P > 0.05].](https://brieflands.com/journals/jjnpp/articles/165986/figures/jjnpp-20-4-165986-i002-preview.webp "Microbial dynamics in trout fillets during 12-day storage at 4°C: A, total viable count (TVC); B, psychrotrophic bacteria count (PTC); C, <i>Pseudomonas</i> count (PSC); and D, yeast and mold count [data represent mean ± SD for control, chitosan (CH), <i>S. striata</i> extract, and CH film incorporating with <i>S. striata</i> extract (CH+SS) treatment groups (log CFU/g). Lowercase letters indicate no significant difference between treatments; capital letters indicate no significant difference between storage days within the same treatment; P > 0.05].")
Microbial dynamics in trout fillets during 12-day storage at 4°C: A, total viable count (TVC); B, psychrotrophic bacteria count (PTC); C, Pseudomonas count (PSC); and D, yeast and mold count [data represent mean ± SD for control, chitosan (CH), S. striata extract, and CH film incorporating with S. striata extract (CH+SS) treatment groups (log CFU/g). Lowercase letters indicate no significant difference between treatments; capital letters indicate no significant difference between storage days within the same treatment; P > 0.05].
4. Results
4.1. Film Physical Properties
4.2. Mechanical Performance
| Films | TS (MPa) | Elong Aft Break (%) | Module (MPa) |
|---|---|---|---|
| CHPGE | 2.73 ± 0.25 | 7.39 ± 1.21 | 7.89 ± 0.50 |
| CHPG | 4.08 ± 1.44 | 7.55 ± 3.31 | 11.16 ± 0.23 |
| CHG | 1.18 ± 0.06 | 3.68 ± 0.06 | 6.38 ± 0.49 |
| CLPGE | 8.54 ± 2.04 | 36.27 ± 10.27 | 20.34 ± 2.58 |
| CLPG | 14.92 ± 0.10 | 40.07 ± 7.88 | 24.12 ± 1.73 |
| CLG | 2.53 ± 0.28 | 11.35 ± 0.89 | 6.54 ± 1.55 |
a Values are expressed as mean ± SD.
4.3. Morphological Characteristics
![Surface morphology of chitosan films: A, pure chitosan (CH); and B, CH film incorporating with <i>Scrophularia striata</i> extract [CH+SS; FTIR spectra of; C.a, CH film and C.b, CH+SS composite film].](https://brieflands.com/journals/jjnpp/articles/165986/figures/jjnpp-20-4-165986-i003-preview.webp "Surface morphology of chitosan films: A, pure chitosan (CH); and B, CH film incorporating with <i>Scrophularia striata</i> extract [CH+SS; FTIR spectra of; C.a, CH film and C.b, CH+SS composite film].")
Surface morphology of chitosan films: A, pure chitosan (CH); and B, CH film incorporating with Scrophularia striata extract [CH+SS; FTIR spectra of; C.a, CH film and C.b, CH+SS composite film].
4.4. Molecular Interactions
4.5. Antimicrobial Efficacy
| Concentration (µg/mL) | Listeria monocytogenes | Salmonella typhimurium | Pseudomonas aeruginosa | Staphylococcus aureus |
|---|---|---|---|---|
| 50000 | ND | 17.43 ± 0.23 | 19.33 ± 0.32 | 25.33 ± 0.58 |
| 25000 | ND | 14.33 ± 0.49 | 14.73 ± 0.06 | 21.50 ± 0.50 |
| 12500 | ND | 13.80 ± 0.30 | 11.60 ± 0.30 | 15.50 ± 0.25 |
| 6250 | ND | 11.40 ± 0.53 | ND | 13.66 ± 0.58 |
| 3125 | ND | 10.40 ± 0.26 | ND | 13.00 ± 0.00 |
| 1562.5 | ND | ND | ND | 12.26 ± 0.15 |
| 781.25 | ND | ND | ND | 11.63 ± 0.31 |
Abbreviation: ND, not detectable.
a Values are expressed as mean ± SD.
b Larger inhibition zone diameters indicate greater antimicrobial activity.
| Foodborne Pathogens | Listeria monocytogenes | Salmonella typhimurium | Pseudomonas aeruginosa | Staphylococcus aureus |
|---|---|---|---|---|
| Inhibition zone | 9.87 ± 1.27 | 10.8 ± 0.21 | 13.56 ± 0.33 | 12.83 ± 0.24 |
a Values are expressed as mean ± SD.
| Food Pathogens | Listeria monocytogenes (µg/mL) | Salmonella typhimurium (µg/mL) | Pseudomonas aeruginosa (µg/mL) | Staphylococcus aureus (µg/mL) |
|---|---|---|---|---|
| Scrophulariastriata Extract | ||||
| MIC | 6250 | 9375 | 6250 | 6250 |
| MBC | 12500 | 12500 | 12500 | 12500 |
| CH+SS | ||||
| MIC | 9375 | 9375 | 4687.5 | 195.31 |
| MBC | 12500 | 12500 | 6250 | 1562.5 |
Abbreviations: MIC, minimum inhibitory concentration; MBC, minimum bactericidal concentration; CH+SS, CH film incorporating with S. striata extract.
4.6. Chemical Quality Parameters
4.7. Microbial Dynamics
4.8. Sensory Evaluation
![Sensory evaluation of trout fillets during 12-day storage at 4°C: A, color scores; B, odor scores; and C, texture scores [data represent mean ± SD of sensory for control, chitosan (CH), <i>S. striata</i> extract, and CH film incorporating with <i>S. striata</i> extract (CH+SS) treatment groups].](https://brieflands.com/journals/jjnpp/articles/165986/figures/jjnpp-20-4-165986-i004-preview.webp "Sensory evaluation of trout fillets during 12-day storage at 4°C: A, color scores; B, odor scores; and C, texture scores [data represent mean ± SD of sensory for control, chitosan (CH), <i>S. striata</i> extract, and CH film incorporating with <i>S. striata</i> extract (CH+SS) treatment groups].")
Sensory evaluation of trout fillets during 12-day storage at 4°C: A, color scores; B, odor scores; and C, texture scores [data represent mean ± SD of sensory for control, chitosan (CH), S. striata extract, and CH film incorporating with S. striata extract (CH+SS) treatment groups].


