
1. Introduction
The kidneys are essential for filtering blood and eliminating waste, while also playing a crucial role in regulating the volume and concentration of various electrolytes within the body (1). Nephrotoxicity is defined as the rapid deterioration of kidney function resulting from the harmful effects of drugs and chemicals. Numerous medications induce inflammatory alterations in the glomeruli, renal tubular cells, and adjacent tissues, potentially resulting in fibrosis and kidney injury (2). In cases of severe nephrotoxicity, additional symptoms may arise, such as reduced urination, swelling due to fluid retention, and elevated blood pressure (3). Reactive oxygen species (ROS) have the capacity to oxidize vital biological macromolecules, including proteins, lipids, and nucleic acids, which can lead to both structural and functional alterations in these molecules. The oxidation of lipids generates a secondary product known as malondialdehyde. Lipid peroxidation serves as a significant target for evaluating oxidative stress and its associated complications, as the hydroxyl radical produced is the most reactive form of ROS capable of initiating lipid peroxidation by attacking unsaturated fatty acids. Oxidative stress is regarded as a primary contributor to nephrotoxicity (4-6). Poorly controlled diabetes mellitus results in coronary artery disease, peripheral vascular disease, retinopathy, cerebrovascular disease, neuropathy, and nephropathy (7). Alloxan (ALLO) triggers the activation of oxidative and inflammatory factors. Consequently, the main approach to reduce ALLO-induced nephrotoxicity involves the use of antioxidants (8). The incorporation of antioxidant substances is crucial in alleviating the effects of diabetes (9). Herbal medicine is generally more affordable, easier to obtain, and more accessible than chemical medicine, and in certain instances, it presents fewer side effects. Conversely, individuals often prefer herbal medicine over chemical alternatives (10). To date, over 1200 herbal medicinal substances have been recognized as potentially effective in managing diabetes (11). Among these are quercetin (QCT) and catechin (CAT), which play a vital role in treating and preventing complications associated with diabetes and dyslipidemia due to their antioxidant characteristics. Green tea (GT) is among the most commonly consumed traditional drinks around the world. Green tea contains varying levels of CATs. Numerous studies have demonstrated that the antioxidant effects of GT stem from flavonoids (12, 13). Flavonoids are a category of polyphenolic compounds that are present in substantial quantities in various foods derived from plants, particularly in tea, onions, berries, and certain medicinal plants. The advantageous properties of flavonoids are linked to their redox antioxidant capacity (14). Catechin is an antioxidant present in medicinal plants that holds promise for diabetes treatment. Numerous studies have indicated that CATs can lower the risk of chronic illnesses, including cardiovascular diseases (15). Some intervention studies involving humans and animals suggest that GT extract or epigallocatechin gallate (EGCG) may positively influence blood sugar regulation (16). Furthermore, EGCG has demonstrated the ability to aid in the removal of ROS and reduce oxidative stress (17). In vivo research has demonstrated that GT can enhance insulin sensitivity (16). Reports from animal studies have highlighted the hypoglycemic properties of GT extract, which is abundant in CATs (18). Epidemiological research has suggested that the consumption of GT may lower the risk of developing diabetes (19). A clinical trial indicated that supplementation with GT extract led to a decrease in glycosylated hemoglobin levels among individuals with abnormal blood sugar (16). Moreover, EGCG has been recognized for its capacity to enhance insulin sensitivity and facilitate glucose absorption by cells (20). Quercetin, a phytochemical that is part of the flavonoid family, exhibits antioxidant properties and the capacity to diminish free radicals within the body (21). Quercetin can be found in a variety of fruits and vegetables, including onions, blueberries, and broccoli. Findings from both animal and human cell studies suggest that QCT offers beneficial physiological effects, including enhanced glucose absorption, increased antioxidant capacity, and improved anti-inflammatory responses (22). Studies performed in both in vitro and in vivo settings have demonstrated that QCT acts as an inhibitor of xanthine oxidase. A previous study has proposed that QCT may protect pancreatic β cells from inflammatory damage (23). Furthermore, a significant function of QCT is its capacity to diminish aldose reductase, the enzyme responsible for converting glucose into sorbitol. The buildup of sorbitol contributes to diabetic retinopathy, nephropathy, and neuropathy (24). Investigations of QCT have revealed that this compound acts as a powerful ROS scavenger and may lower the risk of cardiovascular and renal diseases (25). One study indicated that type 2 diabetes is linked to COX-mediated inflammation and an increased production of prostaglandins (26). Conversely, cyclooxygenase-2 (COX-2) inhibitors have been shown to mitigate the damage induced by diabetes (27).
2. Objectives
The objective of this study was to explore the protective functions of QCT and CAT in ALLO-induced nephrotoxicity through oxidative stress, inflammation, and COX-2 protein expression.
3. Materials and Methods
3.1. Drugs and Chemicals
Alloxan (purity: ≥ 98%), QCT (purity ≥ 95%), and CAT (purity: ≥ 98%) were obtained from Sigma Co, USA. Fasting blood sugar (FBS), cholesterol (Cho), triglyceride (TG), high density lipoprotein-cholesterol (HDL-C), low density lipoprotein-cholesterol (LDL-C), uric acid (U.A), blood urea nitrogen (BUN), and creatinine (Cr) kits were obtained from Pars Azmoon Co, Iran. Total thiol, thiobarbituric acid reactive substances (TBARS), superoxide dismutase (SOD), CAT, advanced oxidation protein products (AOPP), and ROS assay kits were obtained from the ZellBio Co, Germany. The expression of COX-2 protein was assessed using Western blot.
3.2. Animals and Ethical Statement
In this research, thirty male mice, each weighing 25 ± 2 g, were categorized into five groups of six. The mice were maintained at a temperature of 23 ± 2°C, with a humidity range of 40 - 50 %, and were subjected to a light/dark cycle that lasted for 12 hours each. Additionally, they were given adequate food and water. All ethical standards concerning the utilization of animals complied with the protocols set forth by AJUMS (ethics number: IR.AJUMS.AEC.1403.022).
3.3. Experimental Design
A total of thirty male mice were divided into five groups of six with a power analysis, then randomization was performed using computer-generated sequences and assignment concealment. We preregistered our analyses with the Open Science Framework which facilitates reproducibility and open collaboration in science research. Our preregistration was carried out to limit the number of analyses conducted and to validate our commitment to testing a limited number of a priori hypotheses. Our methods are consistent with this preregistration. The current research was supported by the Toxicology Research Center, Medical Basic Sciences Research Institute of the AJUMS Foundation in Iran (03s53). The group classification was: Control (10 mL/kg normal saline); ALLO (120 mg/kg, i.p.); ALLO+QCT (150 mg/kg, gavage); ALLO+CAT (150 mg/kg, gavage); and ALLO+QCT+CAT. Alloxan was administered via injection every other day for a duration of six days. Subsequently, QCT and CAT were given to the mice via gavage for a duration of 14 days. The dosages and administration periods for ALLO (28), QCT (29), and CAT (30) were determined based on findings from recent studies. After a period of 21 days and one night of fasting, the mice were subjected to anesthesia, after which blood was drawn from their hearts. Following centrifugation, the serum was isolated and preserved at -20°C until biochemical analyses could be conducted and the following parameters were assessed: Fasting blood sugar, Cho, TG, HDL-C, LDL-C, U.A, BUN, Cr, total thiol, TBARS, CAT, SOD, ROS, AOPP, TNF-α, and the expression of COX-2 protein. The kidneys were removed and rinsed with normal saline. One kidney was maintained in formalin for histopathological assessment, whereas the other kidney was kept at -70°C for the assessment of oxidative and inflammatory factors, as well as COX-2 protein expression.
3.4. Sample Preparation and Protein Content Assay
To achieve this objective, kidney tissue was homogenized and centrifuged. The supernatant was preserved at -70°C for the purpose of measuring tissue factors, which include total thiol, TBARS, CAT, SOD, ROS, AOPP, TNF-α, and the expression of COX-2 protein. The Bradford method was employed to ascertain the protein concentration in the supernatants. Absorbance readings were taken at 595 nm (31).
3.5. Biochemical Assay
The serum concentrations of FBS, Cho, TG, HDL-C, LDL-C, U.A, BUN, and Cr were evaluated utilizing kits of Pars Azmoon Co Iran, with assistance from a Mindray BS-380 auto-analyzer and reported as mg/dL.
3.6. Total Thiol Assay
The overall concentration of total thiol was evaluated using Ellman’s reagent (32). The absorbance was recorded at 412 nm and expressed as nmol/mg protein.
3.7. Thiobarbituric Acid Reactive Substances Assay
The TBARS level was assessed utilizing the Kei method (33). The absorbance was measured at 532 nm and reported as nmol/mg protein.
3.8. Antioxidant Enzymes Activity Assay
The functionality of the antioxidant enzymes SOD and CAT was evaluated utilizing ZellBio assay kits sourced from Germany, with the findings recorded as U/mg protein.
3.9. Advanced Oxidation Protein Products Assay
The concentration of AOPP was assessed utilizing the OxiSelect™ Kit (34). To achieve this, the unidentified samples that contain AOPP or the chloramine standards are initially combined with a reaction initiator. After a brief incubation phase, a stop solution is added, enabling the evaluation of the samples and standards through a conventional colorimetric plate reader. The concentrations of AOPP in the unknown samples are assessed by comparing them to the predefined Chloramine standard curve. The absorbance was recorded at 450 nm and reported as pg/ml.
3.10. Reactive Oxygen Species and TNF-α Assay
The assessment of ROS and TNF-α levels was conducted utilizing a commercial kit. Absorbance measurements were recorded at 450 nm and documented as pg/mg protein.
3.11. Cyclooxygenase-2 Protein Expression Assay
A total of 20 μg of protein from each group was subjected to electrophoresis using sodium dodecyl sulfate polyacrylamide gel. The membranes were then incubated with primary antibodies, namely anti-COX-2 (1:500, Cat No: 610203) and anti-GAPDH (1:500, Cat No: 5174). Thereafter, the membranes were treated with mouse anti-rabbit IgG-HRP (1:1000, Cat No: sc-2357). To visualize the protein bands, an electrochemiluminescence kit was employed, and Image Lab™ Touch software was utilized for band quantification.
3.12. Histopathological Analysis
One kidney was preserved in 10% formalin. Sections 4 - 6 μm thick were prepared and stained with H&E (35). For each animal, three microscopy slides were analyzed to assess histological alterations such as glomerular atrophy and destruction, degeneration of the epithelial lining (EL), inflammation, and congestion. Histopathological interpretations were performed by randomizing the order of examination and reading the histological slides by the pathologist. The investigators and animal care staff were blinded to group allocation from the beginning of the experiment until data analysis, and all animals in the experiment were managed, monitored, and treated in the same manner. For each animal, five different investigators were involved as follows: The first investigator assigned the treatment according to the randomization table. This investigator was the only one who was aware of the treatment group allocation. The second investigator was responsible for the anesthetic procedure, while the third investigator performed the surgery. The fourth investigator (also blinded to the treatment) performed the experiments, and finally the fifth investigator analyzed the results.
3.13. Statistical Analysis
Statistical analysis was conducted using GraphPad Prism 9, and the normality of the data was evaluated through the Kolmogorov-Smirnov test. The mean ± standard deviation was computed for each group. The results were examined using one-way ANOVA, followed by Tukey's post hoc test for multiple comparisons. A significance level of P < 0.05 was set.
4. Results
4.1. Impact of Quercetin and Catechin on the Serum Biochemical Factors
Impact of QCT and CAT on the serum biochemical factors is illustrated in Figure 1. The assessment of serum biochemical factors indicated that the serum concentrations of FBS, Cho, TG, LDL-C, U.A, BUN, and Cr were markedly elevated in the ALLO group when compared to the control group (all P < 0.001). Administration of QCT led to a reduction in FBS (P = 0.022), Cho (P = 0.008), TG (P = 0.016), LDL-C (P = 0.001), U.A (P = 0.012), BUN (P = 0.024), and Cr (P = 0.010) relative to the ALLO group. Administration of CAT led to a reduction in FBS, Cho, TG, LDL-C, U.A, Cr (all P < 0.001), and BUN (P = 0.002) relative to the ALLO group. The combined effect of QCT and CAT on biochemical factors was more prominent than the effects of single treatment with QCT or CAT (all P < 0.001). In addition, the HDL-C level of the ALLO group was significantly lower than that of the control group (P < 0.001). Treatment with QCT resulted in an increase in HDL-C (P = 0.028) compared to the ALLO group. Treatment with CAT resulted in an increase in HDL-C (P = 0.008) compared to the ALLO group. The combined effect of QCT and CAT on HDL-C was more prominent than the effect of single treatment with QCT or CAT (P < 0.001).
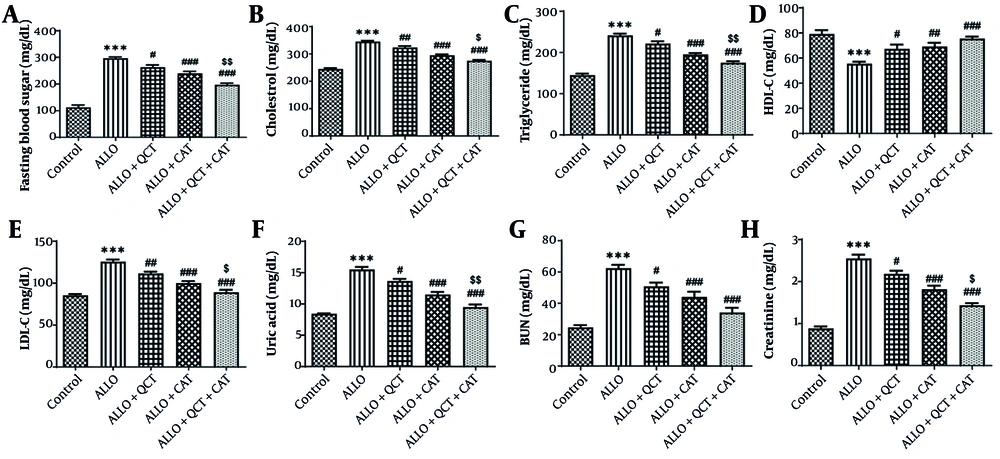
Figure 1.
Impact of quercetin (QCT) and catechin (CAT) on the levels of A, fasting blood sugar (FBS); B, cholesterol (Cho); C, triglyceride (TG); D, low density lipoprotein-cholesterol (LDL-C); E, high density lipoprotein-cholesterol (HDL-C); F, uric acid (U.A); G, blood urea nitrogen (BUN); and H, creatinine (Cr) on alloxan (ALLO)-induced nephrotoxicity in mice. Data are presented as mean ± standard deviation (n = 6) and confidence intervals 95%. Standard errors were: 10.09 (FBS), 5.812 (Cho), 5.842 (TG), 3.702 (HDL-C), 3.289 (LDL-C), 0.515 (U.A), 3.580 (BUN), and 0.101 (Cr). (*** P < 0.001) compared with control group; (# P < 0.05, ## P < 0.01, ### P < 0.001) compared with ALLO groups that received treatment with QCT or CAT versus ALLO group. ($ P < 0.05, $$ P < 0.01) compared with ALLO group treated with a combination of QCT and CAT against the ALLO groups treated with QCT or CAT individually.
4.2. Impact of Quercetin and Catechin on the Oxidative Stress Markers
The influence of QCT and CAT on the oxidative stress markers is depicted in Figure 2. The evaluation of these parameters indicated that levels of total thiol, ROS, AOPP, SOD, and CAT in the ALLO group were significantly below those found in the control group (all P < 0.001). ALLO group that was treated with QCT exhibited significantly higher levels of total thiol (P = 0.044), SOD (P = 0.049), and CAT (P = 0.021) compared to the ALLO group. ALLO group that was treated with CAT exhibited significantly higher levels of total thiol, SOD, and CAT compared to the ALLO group (all P < 0.001). A rise in TBARS, ROS, and AOPP levels was noted in the ALLO group in comparison to the control group (all P < 0.001). Conversely, in ALLO group that underwent treatment with QCT, TBARS (P = 0.009), ROS (P = 0.004), and AOPP (P = 0.001) levels showed a significant decrease. In ALLO group that underwent treatment with CAT, TBARS, ROS, and AOPP levels showed a significant decrease (all P < 0.001). The effect of combination therapy with QCT and CAT was significantly greater than that of single therapy (all P < 0.001).
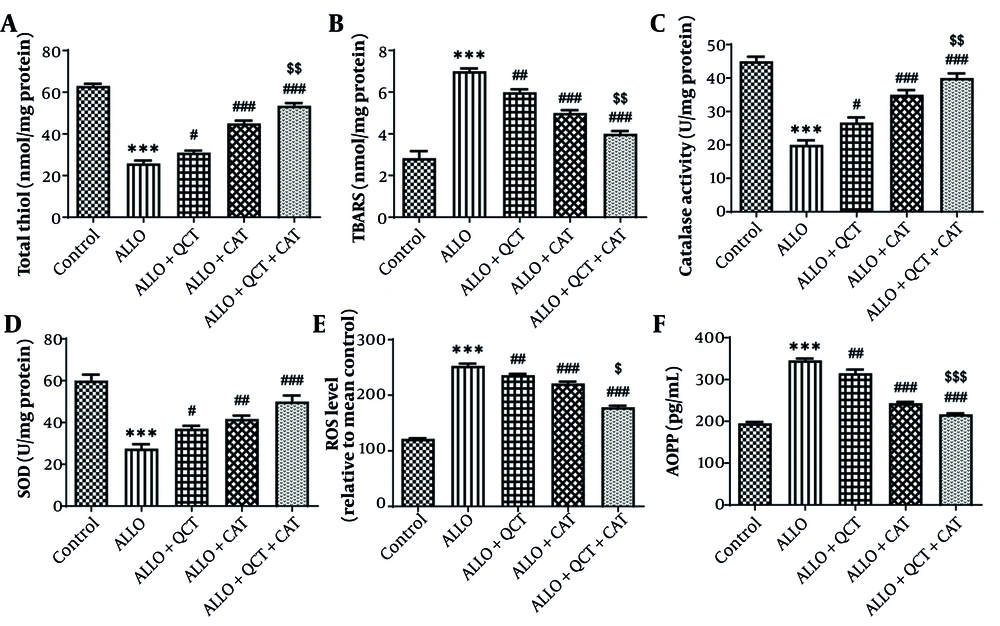
Figure 2.
Impact of quercetin (QCT) and catechin (CAT) on A, total thiol; B, thiobarbituric acid reactive substances (TBARS); C, catalase activity; D, superoxide dismutase (SOD) activity; E, reactive oxygen species (ROS); and F, advanced oxidation protein products (AOPP) on alloxan (ALLO)-induced nephrotoxicity in mice. Data are presented as mean ± standard deviation (n = 6) and confidence intervals 95%. Standard errors were: 1.729 (total thiol), 0.274 (TBARS), 2.011 (catalase), 3.227 (SOD), 4.063 (ROS), and 7.059 (AOPP). (*** P < 0.001) compared with control group. (# P < 0.05, ## P < 0.01, ### P < 0.001) compared with ALLO groups that received treatment with QCT or CAT versus ALLO group. ($ P < 0.05, $$ P < 0.01, $$$ P < 0.001) compared with ALLO group treated with a combination of QCT and CAT against ALLO groups treated with QCT or CAT individually.
4.3. Impact of Quercetin and Catechin on the TNF-α Inflammation Marker
The influence of QCT and CAT on the inflammation marker TNF-α is depicted in Figure 3. The findings indicated a notable rise in the level of TNF-α after ALLO administration in comparison to the control group (P < 0.001). QCT (P = 0.011) or CAT (P < 0.001) exhibited an improvement in this marker, leading to a significant reduction in TNF-α level in the groups that were treated in comparison to the ALLO group. The effect of combination therapy with QCT and CAT was significantly greater than that of single therapy (P < 0.001).
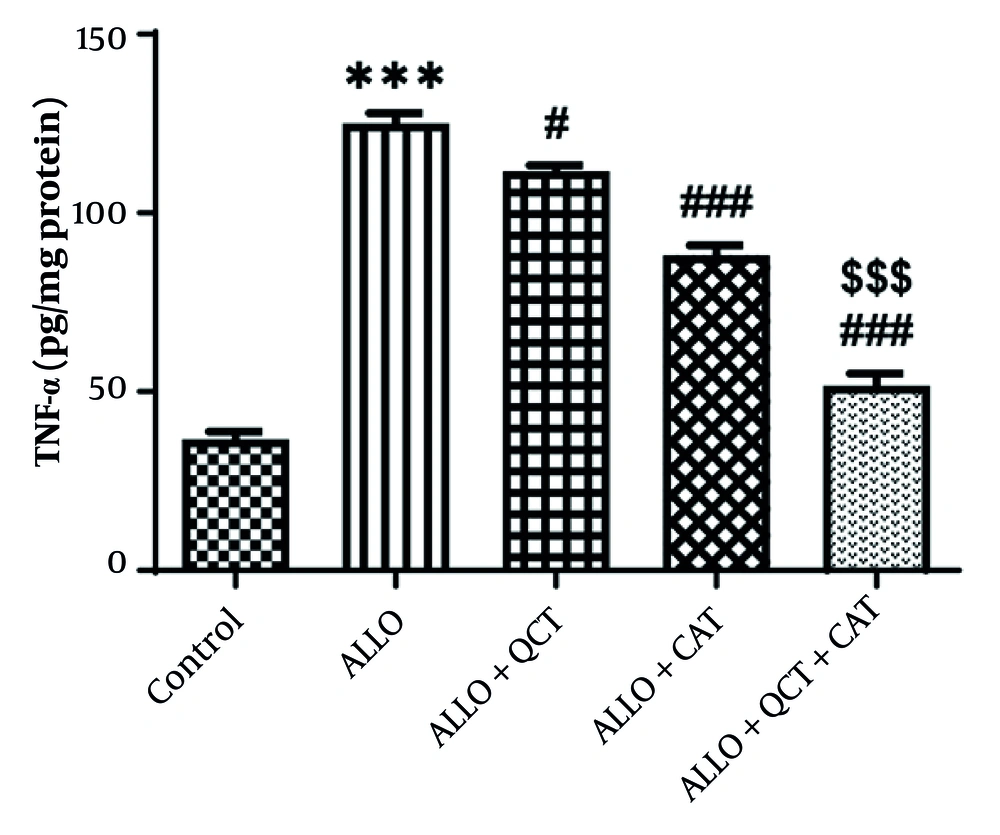
Figure 3.
Impact of quercetin (QCT) and catechin (CAT) on the inflammation marker of tumor necrosis factor-alpha (TNF-α) on alloxan (ALLO)-induced nephrotoxicity in mice. Data are presented as mean ± standard deviation (n = 6) and confidence intervals 95%. Standard error was: 3.707. (*** P < 0.001) compared with control group. (# P < 0.05, ### P < 0.001) compared with ALLO groups that received treatment with QCT or CAT versus ALLO group. ($$$ P < 0.001) compared with ALLO group treated with a combination of QCT and CAT against ALLO groups treated with QCT or CAT individually.
4.4. Impact of Quercetin and Catechin on the Cyclooxygenase-2 Protein Expression
The influence of QCT and CAT on the COX-2 protein expression is depicted in Figure 4. The level of COX-2 protein expression in the ALLO group exhibited a significant increase when compared to the control group (P < 0.001). In the treatment groups receiving either QCT or CAT, expression of this protein was significantly lower compared to that seen in the ALLO group (all P < 0.001). Furthermore, the combined effect of QCT and CAT on the COX-2 protein expression was found to be considerably more effective than the individual effects of QCT or CAT (P < 0.001).
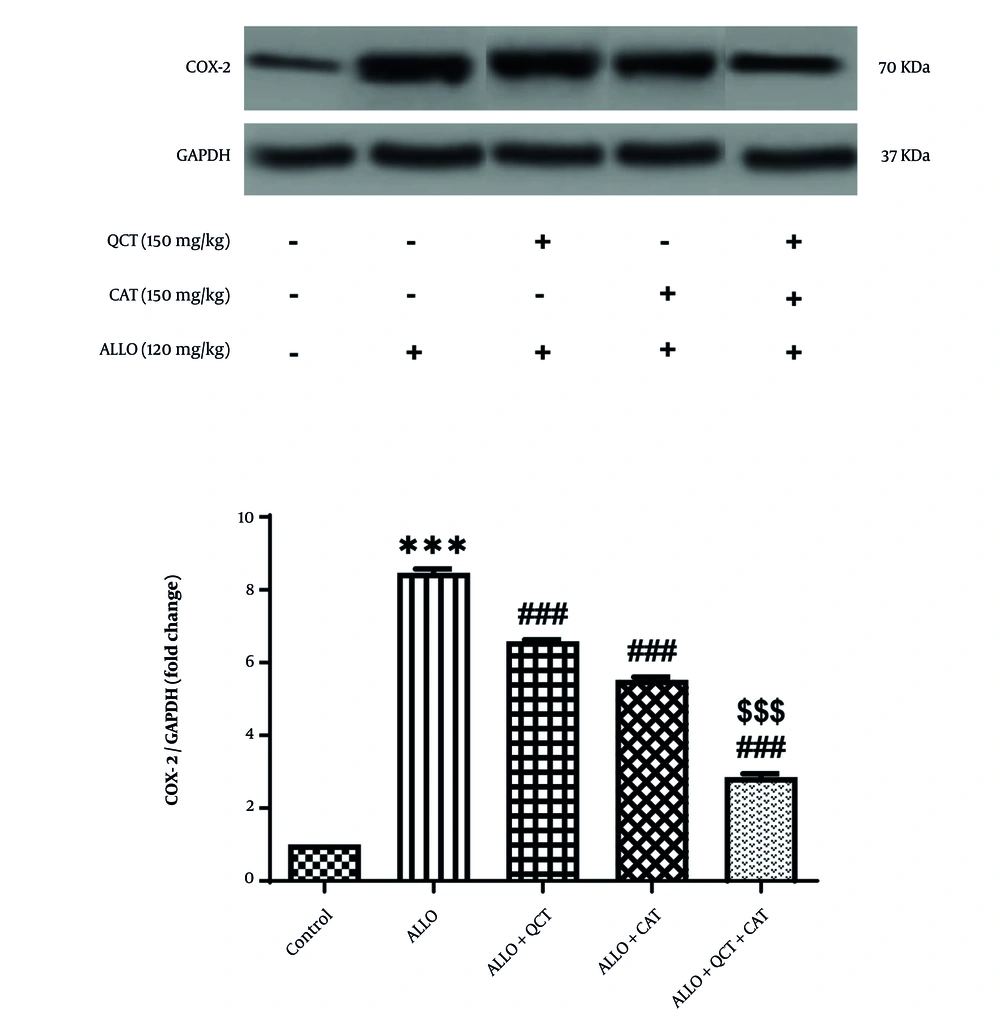
Figure 4.
Impact of quercetin (QCT) and catechin (CAT) on the cyclooxygenase-2 (COX-2) protein expression on alloxan (ALLO)-induced nephrotoxicity in mice. Data are presented as mean ± standard deviation (n = 6) and confidence intervals 95%. Standard error was: 0.102. (*** P < 0.001) compared with control group. (### P < 0.001) compared with ALLO groups that received treatment with QCT or CAT versus ALLO group. ($$$ P < 0.001) compared with ALLO group treated with a combination of QCT and CAT against ALLO groups treated with QCT or CAT individually.
4.5. Impact of Quercetin and Catechin on the Histopathological Factors
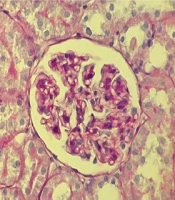
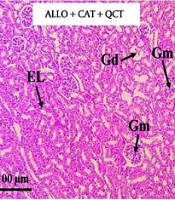
The impact of QCT and CAT on the histopathological factors is shown in Figure 5. Kidney tissue in the control group exhibited a normal structure. Both the glomeruli and tubular tissue appeared normal. In contrast, the ALLO-treated group displayed characteristic signs of kidney tissue destruction, which included glomerular damage, vacuolar degeneration (VD), and the destruction of tubular epithelium . Additionally, areas of hemorrhage were noted in this group. The administration of QCT and CAT resulted in a significant improvement in the previously mentioned renal degenerative changes. Notably, the extent of these damages and tissue alterations was more pronounced in the cohort of patients who received both QCT and CAT concurrently, compared to those who were treated with QCT and CAT individually. The quantitative analysis depicting the average areas of damaged tissue for each group is shown in Figure 6. Consequently, the ALLO group exhibited the highest percentage of tissue damage (P < 0.001). Conversely, the treatment groups receiving QCT or CAT showed a reduction in tissue damage (P < 0.001). The effect of combination therapy was significantly greater than that of single therapy (P < 0.001).
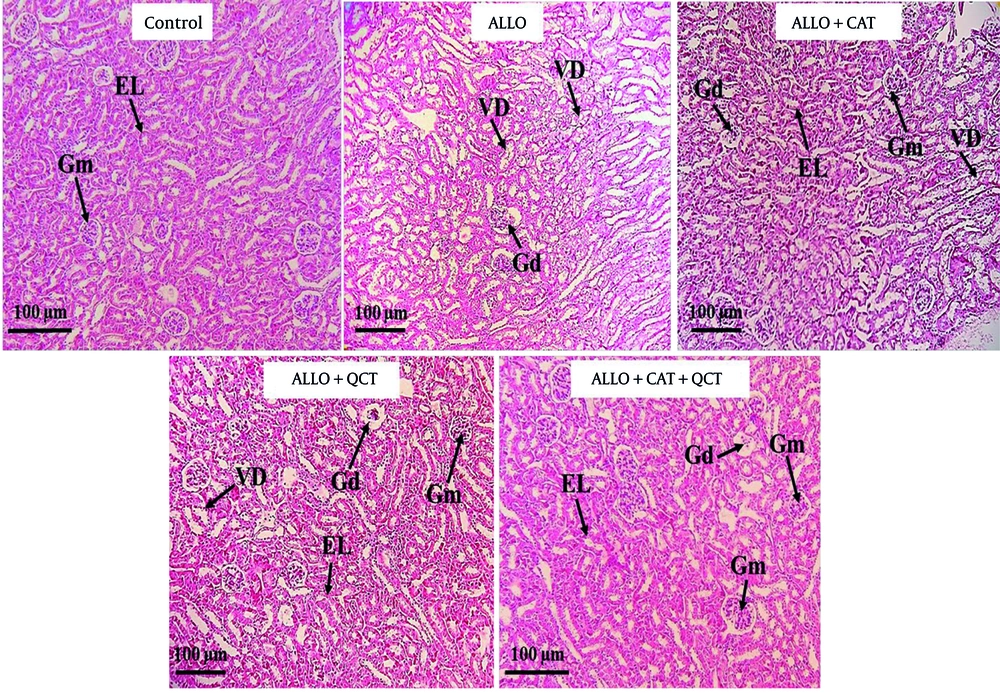
Figure 5.
Staining of kidney tissue using hematoxylin-eosin in the control group and treatment groups. Groups consist of control, alloxan (ALLO), ALLO combined with quercetin (QCT), ALLO combined with catechin (CAT), and ALLO combined with QCT+CAT; Glomerulus (Gm), Glomerular disorganization (Gd), Epithelial lining (EL), and Vacuolar degeneration (VD). Magnification: 100X.
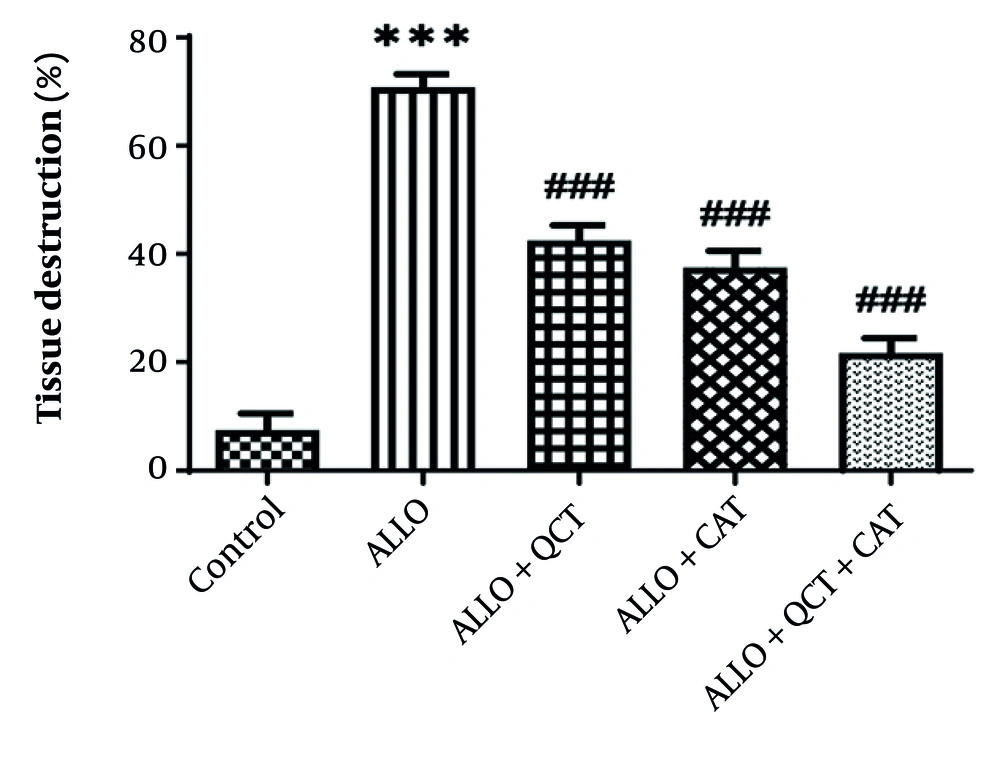
Figure 6.
Impact of quercetin (QCT) and catechin (CAT) on the tissue destruction on alloxan (ALLO)-induced nephrotoxicity in mice. Data are presented as mean ± standard deviation (n = 6) and confidence intervals 95%. Standard error was: 4.028. (*** P < 0.001) compared with control group. (### P < 0.001) compared with ALLO groups that received treatment with QCT or CAT versus ALLO group.
5. Discussion
In this research, the protective role of QCT and CAT against ALLO-induced nephrotoxicity was examined through the pathways of oxidative stress and inflammation, as well as COX-2 protein expression. The primary strategy for mitigating ALLO-induced nephrotoxicity involves the application of antioxidants (36). According to the findings, serum biochemical parameters such as FBS, Cho, TG, LDL-C, U.A, BUN, and Cr were elevated in the ALLO group. The management of QCT or CAT resulted in a decrease in these biomarkers. Effects of amalgamation therapy on biochemical parameters was significantly superior to that of individual treatments. The noted normalization of FBS, lipids (which included a decrease in TG, Cho, and LDL-C, along with an increase in HDL-C), and kidney markers (which included a decrease in BUN, Cr, and U.A) was biologically aligned with existing scientific literature. Research indicates that QCT enhances blood glucose and lipid levels while decelerating the advancement of renal injury in both preclinical and pooled analyses (37-39). Ni et al. demonstrated that CAT positively influenced metabolic and inflammatory profiles and provided renal advantages in both clinical and experimental contexts (40). In this research, the oxidative stress markers total thiol, AOPP, SOD, and catalase exhibited a decrease in the ALLO group. The administration of QCT or CAT resulted in an increase in these markers. Additionally, ALLO led to an elevation in ROS and TBARS. Conversely, the treatment with QCT or CAT significantly reduced these markers. The impact of the combined treatment with QCT and CAT on the oxidative stress markers was notably superior to that of the individual treatments. Although there is still a scarcity of renal studies directly evaluating QCT and CAT, two recent pieces of evidence indicate a synergistic effect. Ashkar et al. demonstrated that the combination of QCT and CAT lowered TG and TBARS more effectively than either treatment alone (41). Furthermore, the research conducted by Guan et al. revealed that QCT and CAT together enhanced Nrf-2 nuclear translocation and inhibited IKKα/p53-related oxidative signaling, providing a credible foundation for their enhanced antioxidant and anti-inflammatory effectiveness (42). In the context of the diabetic/oxidative kidney injury model, the suppression of Nrf-2 and the activation of NF-κB/NLRP-3 lead to lipid peroxidation and the release of cytokines. Polyphenols, such as QCT and CAT, mitigate these pathways through antioxidant and anti-inflammatory signaling, aligning with the reversal of ALLO-induced biomarkers (43). In this study, the inflammatory marker TNF-α was found to be elevated in kidney tissue following ALLO administration. The administration of either QCT or CAT resulted in a decrease in this inflammatory marker. Combination treatment with
QCT and CAT demonstrated a significantly greater effect compared to either treatment alone. Evidence indicates that CAT provides renal protection by diminishing NF-κB/TNF-α signaling and activating antioxidant pathways. In kidney models, CAT was shown to lower proinflammatory mediators (TNF-α, IL-6) and NF-κB activity, and in certain studies, it mitigated NLRP3-induced pyroptosis. These mechanisms align with our observed reductions in TNF-α and COX-2 (44, 45). The results indicated that COX-2 protein expression was elevated in the ALLO group but decreased in QCT or CAT treatment groups. Effects of amalgamation of QCT and CAT on COX-2 protein expression was significantly superior to that of either treatment alone. Our findings regarding QCT are in agreement with recent reviews and meta-analyses focused on kidney health. Quercetin has been shown to reduce oxidative damage, inflammation, and fibrosis in models of kidney injury. Mechanistically, QCT downregulates COX-2, NF-κB, and AP-1, while enhancing antioxidant defenses, as evidenced by the reduction of TBARS and TNF-α (46, 47). Multi-polyphenol formulations aimed at activating Nrf-2 and suppressing NF-κB/COX-2/TNF-α may prove to be more effective than single agents, necessitating further investigation into optimal ratios and delivery systems, such as nanoformulations to enhance bioavailability (48). Research has indicated that QCT offers protection against renal injury and nephrotoxicity by modulating the AKT/Raf/MEK/ERK pathway and inflammatory factors, which aligns with our findings (38, 49). In this investigation, ALLO was found to induce kidney tissue damage, including glomerular injury, VD, and destruction of tubular epithelium. The administration of QCT or CAT resulted in significant improvement in the aforementioned renal degenerative changes. The histological protection observed in the combination group corroborates reports of kidney structure preservation under various conditions, such as hypoxia and hyperuricemia, attributed to QCT, which is consistent with the modulation of oxidative and inflammatory injury (50, 51). Beyond the individual effects, our combined QCT and CAT treatment consistently surpassed the outcomes of single treatments in biochemical, redox, inflammatory, and histological assessments, indicating complementary pharmacodynamics. However, pharmacokinetics, tissue distribution, and long-term safety were not explored in this study, representing limitations that should be addressed in future research. This study has demonstrated that oxidative stress and inflammation are pivotal in ALLO-induced nephrotoxicity, and the combination of QCT and CAT effectively mitigated this damage.
5.1. Conclusions
Our findings indicated that QCT 150 mg/kg and CAT 150 mg/kg have the potential to mitigate ALLO-induced nephrotoxicity in mice through the suppression of oxidative stress, inflammation, and the expression of COX-2 protein. Therefore, incorporating the antioxidant agents QCT and CAT may alleviate renal damage by diminishing the nephrotoxic impacts of ALLO.