
1. Background
Snakebite envenoming is a major global public health problem and a well-recognized cause of substantial morbidity, particularly in countries characterized by low mortality rates and middle-income economies (1, 2) According to the World Health Organization’s most recent global estimates (2017), approximately 5.4 million snakebites occur annually worldwide, resulting in nearly 2.7 million cases of envenomation, about 137,880 deaths, and up to three times as many survivors living with permanent physical disabilities. These figures include bites from both venomous and non-venomous species, with envenomation-related outcomes attributed exclusively to venomous snakes (3).
Among venomous snakes, the saw-scaled viper (Echis carinatus) represents a significant cause of envenomation in tropical and subtropical regions, including parts of Africa, the Middle East, and the Indian subcontinent. The wide geographic distribution of this species, coupled with its aggressive behavior and highly potent venom, contributes substantially to the burden of snakebite envenoming in these regions (4).
Saw-scaled viper bites occur predominantly in rural settings and are more common during rainy seasons, when agricultural activity increases and human-snake encounters become more frequent (5, 6). Children are particularly vulnerable to severe envenomation, with complications such as hemorrhagic manifestations and acute kidney injury (AKI) being more common in pediatric populations; snakebite-related mortality among children has been reported in several endemic areas (7, 8). Adults engaged in farming and outdoor occupations, especially males between 17 and 45 years of age, are bitten more frequently than females, reflecting occupational exposure patterns (9, 10). Delayed access to medical care remains a critical determinant of poor clinical outcomes, as late presentation is associated with increased severity of complications and reduced survival (11, 12).
Renal involvement is a well-documented consequence of viper envenomation. Acute kidney injury, typically defined by a rapid rise in serum creatinine and/or reduced urine output within days of envenomation, represents the most common form of kidney injury in this context. In some patients, renal dysfunction may persist beyond the acute phase, leading to long-term or chronic kidney impairment, underscoring the importance of early recognition and management (7, 13).
Iran is a natural habitat for several venomous snake species and faces a considerable burden of snakebite, particularly in rural areas of the southern and southwestern provinces (14). In Khuzestan province, where E. carinatus is endemic, snakebite envenoming remains a persistent public health concern. According to reports from the provincial health center, approximately 900 - 1,000 snakebite cases from venomous species are recorded annually, with 1 - 2 associated deaths reported in recent years (data reported for the year 2000) (15, 16). These local statistics highlight the ongoing risk posed by venomous snakes in this region.
The venom of E. carinatus contains a complex mixture of bioactive components, including serine proteases, metalloproteinases, and phospholipase A₂, which interfere with platelet function and the coagulation cascade. A hallmark of Echis envenomation is venom-induced consumption coagulopathy (VICC), characterized by depletion of clotting factors, prolonged coagulation times, low fibrinogen levels, and elevated fibrin degradation products (13, 17-19). Unlike disseminated intravascular coagulation, VICC is typically self-limited and often resolves within 24 - 48 hours following appropriate antivenom administration, although the role of antivenom in accelerating recovery remains a subject of debate (20).
Multiple venom enzymes, including fibrinolytic enzymes, prothrombin activators such as ecarin, and thrombin-like serine proteases, contribute to the hypocoagulable state seen in E. carinatus envenomation. These toxins promote fibrinogen depletion, microvascular thrombosis, and bleeding, and may also damage endothelial cells, further amplifying coagulation abnormalities and systemic complications (21-28).
Despite the clinical importance of E. carinatus envenomation, contemporary data on its complications and outcomes in southwestern Iran remain limited. Given the endemic presence of this species in Khuzestan Province, updated regional studies are essential to inform public health planning, improve clinical management strategies, and reduce morbidity and mortality associated with snakebite envenoming.
2. Objectives
This study aimed to describe the demographic characteristics of patients with E. carinatus envenomation and to assess the frequency of major complications, including VICC, AKI, and cellulitis, and the factors associated with their occurrence.
3. Methods
This retrospective, hospital-based cohort study was conducted at Razi hospital in Ahvaz, southwestern Iran, which serves as the provincial referral center for clinical toxicology and admits patients aged 12 years and older. The study covered six years from 2016 to 2022.
During the study period, a total of 1,949 patients with suspected snakebite envenomation were screened. Of these, 1,699 patients were excluded based on predefined eligibility criteria. Due to the retrospective nature of the study and limitations in access to detailed screening logs for excluded cases, exact counts for each exclusion category could not be reliably retrieved. All exclusions were applied before data extraction and were independent of study outcomes, thereby minimizing the risk of selection bias. Ultimately, 250 patients with confirmed E. carinatus envenomation were included in the final analysis.
Patients presenting more than 24 hours after envenomation were excluded because delayed presentation may substantially alter laboratory findings, clinical manifestations, and treatment response, thereby limiting comparability with early-presenting cases and introducing heterogeneity in outcome assessment. Nonetheless, this exclusion criterion may have led to underrepresentation of more severe or complicated cases, and the potential for selection bias is acknowledged.
Eligible patients were required to have a confirmed diagnosis of E. carinatus envenomation. Species identification was established by the attending physician based on direct examination of the snake specimen brought by the patient or evaluation of a clear photograph demonstrating characteristic morphological features, particularly the distinctive white arrow- or cross-shaped marking on the head (29). After applying all inclusion and exclusion criteria, 250 patients were included in the final analysis (Figure 1).
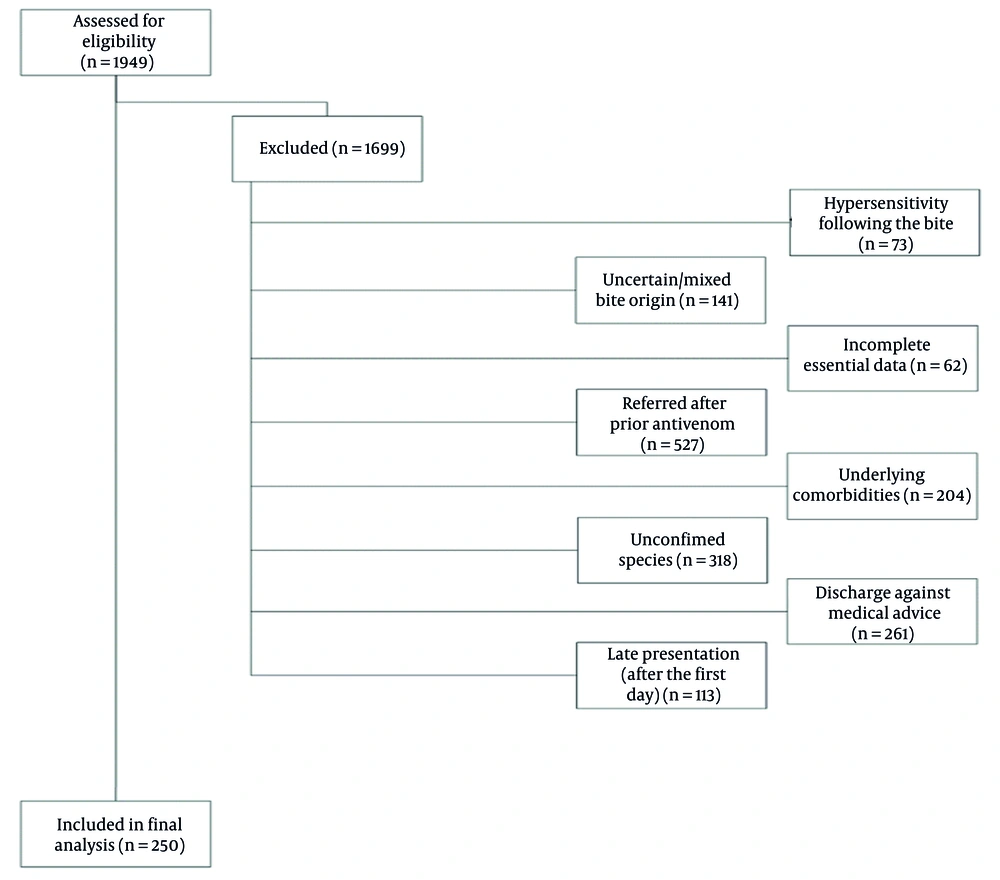
Figure 1.
Flow diagram illustrating patient screening and selection
Treatment was provided in accordance with the national snakebite management protocol. Although two licensed polyvalent antivenoms targeting six medically important snake species are available in Iran (produced by the Razi Vaccine and Serum Research Institute and Padra Serum), only the Razi polyvalent antivenom was used in this study (30). Coagulation parameters, including prothrombin time, activated partial thromboplastin time (aPTT), and international normalized ratio, were monitored every four hours. Antivenom administration was initiated when the international normalized ratio (INR) reached ≥ 2 or when clinically significant systemic envenomation was present. The standard initial dose ranged from three to five vials, with escalation to six to ten vials in cases of systemic involvement and up to twelve vials in patients with severe neurotoxic or hemodynamic complications.
3.1. Definition
Venom-induced consumption coagulopathy was defined by prolonged prothrombin time (PT) and aPTT in conjunction with an INR ≥ 2 (15). Bite site infection (cellulitis) was defined as a clinical diagnosis of localized infection at the snakebite site, characterized by erythema, warmth, edema, necrosis, or infected bullae, as documented in the medical records (31). This variable was originally recorded in the dataset as “BSI,” referring specifically to bite site infection and not bloodstream infection. To avoid ambiguity and misinterpretation, the term "cellulitis" is used consistently throughout the manuscript.
Routine microbiological confirmation (e.g., wound cultures or blood cultures) was not systematically performed, and the diagnosis was based on clinical assessment by the treating physician.
Acute kidney injury was defined according to the Kidney Disease: Improving Global Outcomes (KDIGO) criteria as any of the following: An increase in serum creatinine of ≥ 0.3 mg/dL (26.5 μmol/L) within 48 hours; an increase in serum creatinine to ≥ 1.5 times the baseline value within the preceding 7 days; or urine output < 0.5 mL/kg/h for at least 6 hours (32). Baseline serum creatinine was defined as the value measured at hospital admission, acknowledging that pre-envenomation creatinine levels were unavailable.
Laboratory measurements were obtained according to routine clinical indications during patient care rather than a predefined research sampling protocol. Consequently, not all laboratory parameters were assessed on all hospitalization days for every patient. The absence of measurements therefore reflects clinical judgment and patient stability rather than missing or incomplete data.
3.2. Statistical Analysis
Data analysis was performed using SPSS software version 26 (SPSS Inc., Chicago, IL, USA). Continuous variables were expressed as mean ± standard deviation or median (interquartile range [IQR]), as appropriate. The normality of continuous data was assessed using the Kolmogorov-Smirnov and Shapiro-Wilk tests, and non-normally distributed variables were summarized using median (IQR).
Between-group comparisons for continuous variables were performed using the Mann-Whitney U test, while categorical variables were compared using the chi-square test or Fisher’s exact test, as appropriate. Odds ratios with corresponding 95% confidence intervals (CIs) were calculated from 2 × 2 contingency tables using univariable analyses. Multivariable logistic regression models were not performed due to the limited number of outcome events, particularly AKI (n = 19), which precluded reliable multivariable modeling.
To control for inflation of Type I error due to multiple comparisons, the Bonferroni correction was applied. The correction was specifically used for three primary comparisons (k = 3): (1) The association between cellulitis and AKI, (2) the association between VICC and AKI, and (3) the association between hypotension at admission and VICC. Accordingly, the conventional significance level of α = 0.05 was divided by three, resulting in an adjusted significance threshold of α = 0.0167. Only P-values below this threshold were considered statistically significant. All reported CIs were calculated at the 95% level.
4. Results
Normality was assessed using the Shapiro-Wilk and Kolmogorov-Smirnov tests. Age was non-normally distributed (Shapiro-Wilk P < 0.001; Kolmogorov-Smirnov P = 0.006); therefore, continuous variables are summarized as median (IQR) and compared using the Mann-Whitney U test.
4.1. Study Population and Baseline Characteristics
All patients presenting with snakebite envenomation during the study period were assessed using a census sampling approach.
After applying predefined exclusion criteria, 250 patients with confirmed E. carinatus envenomation were included in the final analysis (Figure 1).
The median age was 35 years (IQR: 24 - 47 years), and the majority of patients were male (83.2%). No in-hospital mortality was observed. Baseline demographic and clinical characteristics are summarized in Table 1.
Table 1.
Baseline Demographic and Clinical Characteristics of Patients with Echis Carinatus Envenomation (n = 250) a
| Variables | Values |
|---|---|
| Age, y | 35 (24 - 47) |
| Gender, male | 208 (83.2) |
| Systolic blood pressure at admission, mmHg | 120 (110 - 120) |
| Diastolic blood pressure at admission, mmHg | 80 (70 - 80) |
| Pulse rate at admission, beats/min | 81 (77 - 87) |
| Respiratory rate at admission, breaths/min | 15 (14 - 18) |
| Body temperature at admission, °C | 37.0 (36.6 - 37.2) |
| Hypotension at admission (SBP < 90 mmHg) | 1 (0.4) |
| Fever at admission (T ≥ 38.0°C) | 3 (1.2) |
| VICC | 69 (27.6) |
| AKI | 19 (7.6) |
| Cellulitis | 19 (7.6) |
| Proteinuria | 69 (27.6) |
| Hematuria | 71 (28.4) |
| Hemoglobinuria | 72 (28.8) |
| Urinary RBCs | 96 (38.4) |
Abbreviations: VICC, venom-induced consumption coagulopathy; AKI, acute kidney injury; RBCs, red blood cells.
a Data are presented as median (interquartile range) or number (percentage), as appropriate.
4.2. Frequency of Major Complications
Venom-induced consumption coagulopathy occurred in 69 patients (27.6%), AKI in 19 patients (7.6%), and cellulitis in 19 patients (7.6%).
4.3. Temporal Changes in Laboratory Parameters
Coagulation parameters were markedly abnormal at presentation and demonstrated progressive normalization during hospitalization. Temporal trends in coagulation, renal, and hematological parameters are shown in Table 2.
| Parameters | Day 1 | Day 2 | Day 3 |
|---|---|---|---|
| Prothrombin time, s | 14.0 (13.0 - 26.5) | 14.0 (12.0 - 16.0) | 13.0 (12.0 - 14.0) |
| INR | 1.3 (1.2 - 4.0) | 1.3 (1.0 - 1.6) | 1.2 (1.0 - 1.3) |
| aPTT, s | 36.0 (30.0 - 54.5) | 33.0 (29.0 - 39.0) | 30.0 (28.0 - 35.0) |
| Serum creatinine, mg/dL | 1.0 (0.8 - 1.1) | 0.9 (0.8 - 1.1) | 0.9 (0.8 - 1.0) |
| BUN, mg/dL | 16.0 (13.0 - 20.0) | 15.0 (13.0 - 18.0) | 15.0 (13.0 - 18.0) |
| Potassium, mmol/L | - | - | 4.0 (3.8 - 4.2) |
| Hemoglobin, g/dL | - | 13.2 (12.0 - 14.0) | - |
| RBC, ×10⁶/µL | - | 4.5 (4.0 - 5.0) | - |
Abbreviations: INR, international normalized ratio; aPTT, activated partial thromboplastin time; BUN, blood urea nitrogen; RBC, red blood cell count.
a Data are presented as median (interquartile range).
b Potassium was not measured on days 1 and 2.
c Hemoglobin and red blood cell counts were measured only on day 2.
4.4. Acute Kidney Injury-Stratified Analysis
Patients who developed AKI exhibited higher peak serum creatinine and blood urea nitrogen levels than those without AKI. Renal and electrolyte parameters stratified by AKI status are presented in Table 3.
Table 3.
| Variables | AKI (n = 19) | No AKI (n = 231) |
|---|---|---|
| Peak serum creatinine, mg/dL | 1.6 (1.15 - 1.9) | 1.0 (0.8 - 1.1) |
| Peak BUN, mg/dL | 24.0 (20.0 - 33.0) | 16.0 (14.0 - 20.0) |
| Peak potassium, mmol/L | 4.25 (4.03 - 4.80) | 4.10 (3.90 - 4.40) |
Abbreviations: AKI, acute kidney injury; BUN, blood urea nitrogen.
a Data are presented as median (interquartile range).
b Values represent peak measurements during hospitalization and are presented as median (interquartile range).
c Comparisons between groups were performed using the Mann-Whitney U test.
4.5. Associations Between Major Complications
Acute kidney injury was more frequently observed among patients with cellulitis compared with those without cellulitis (57.9% vs. 4.4%; P = 0.005; OR = 4.10). Venom-induced consumption coagulopathy was also significantly more common in patients with AKI than in those without AKI (P = 0.005; OR = 4.10). Hypotension at admission was uncommon and was not significantly associated with VICC.
Length of hospital stay varied according to major complications (Figure 2).
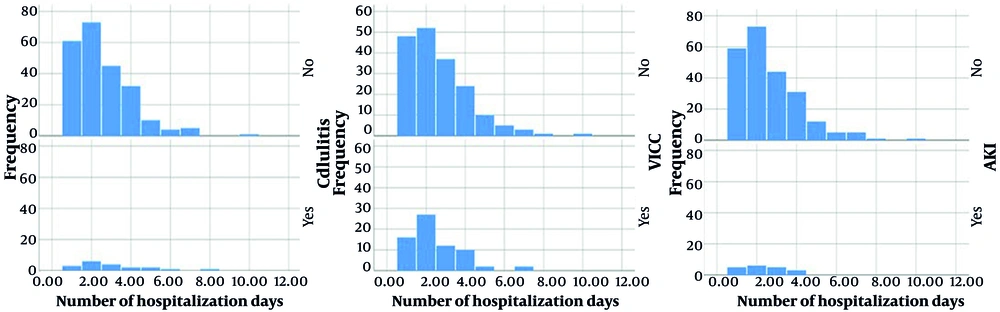
Figure 2.
Length of hospital stay according to the presence of venom-induced consumption coagulopathy (VICC), acute kidney injury (AKI), and cellulitis
5. Discussion
This study provides updated, region-specific evidence on the clinical spectrum of E. carinatus envenomation in southwestern Iran. The predominance of young adult males observed in this cohort is consistent with previous epidemiological studies from Iran and other endemic regions, reflecting increased occupational exposure related to agricultural and outdoor activities. The absence of in-hospital mortality in the present study likely reflects timely access to antivenom therapy and supportive care at a tertiary referral center, as has been reported in settings with improved healthcare access (9-11, 14, 33).
Venom-induced consumption coagulopathy and AKI were the most clinically significant systemic complications identified. The observed frequency of VICC (27.6%) aligns with reports from other regions affected by hemotoxic viper envenomation. Progressive normalization of coagulation parameters during hospitalization supports previous observations that appropriate antivenom administration and close laboratory monitoring are critical for reversing venom-induced coagulopathy (5-7, 13, 17, 18).
Although AKI occurred in a minority of patients, its clinical relevance was underscored by its significant association with VICC. The association between AKI and coagulopathy is biologically plausible, as venom-mediated activation of coagulation pathways may lead to microvascular thrombosis, renal ischemia, and direct nephrotoxicity. These mechanisms have been demonstrated in both experimental and clinical studies of Echis envenomation (22-26).
In contrast, the observed association between cellulitis and AKI should be interpreted with caution. In this study, cellulitis represented a clinically diagnosed bite site infection rather than microbiologically confirmed bacterial infection. Therefore, cellulitis may reflect more severe local envenomation or extensive tissue injury rather than a direct infectious cause of renal dysfunction.
Urinalysis abnormalities were frequently observed and may represent early indicators of renal involvement following E. carinatus envenomation. Similar urinary findings have been described in hemotoxic snakebites and are thought to reflect glomerular injury, hemolysis, and pigment nephropathy (7, 13, 18).
Hypotension at admission was uncommon in the present cohort and was not significantly associated with VICC. While hypotension has been described as a marker of severe envenomation in some studies, differences in case severity, early presentation, and prompt supportive management may explain the lack of association observed here (1, 5).
Overall, the clustering of coagulopathy, renal dysfunction, and local infection observed in this cohort suggests that these complications may represent markers of more severe envenomation rather than isolated events. However, the limited number of AKI cases and the absence of multivariable analyses restrict definitive conclusions. Prospective studies are needed to clarify causal pathways and optimize management strategies (3, 20).
5.1. Conclusions
Echis carinatus envenomation remains an important cause of morbidity in southwestern Iran. Venom-induced consumption coagulopathy and AKI were the most frequent systemic complications, while cellulitis was the main local manifestation. Although AKI occurred in a minority of patients, it was significantly associated with coagulopathy and was more frequently observed in patients with cellulitis.
Our findings suggest that early recognition of severe local reactions and close monitoring of hemodynamic status, coagulation, and renal function during hospitalization may help clinicians identify patients at higher risk of complications. Prospective multicenter studies are needed to confirm these associations and to evaluate optimal treatment pathways.
5.2. Limitations
This study is limited by its retrospective design and reliance on medical records. The small number of AKI cases limited statistical power and precluded multivariable analyses. Species identification was based on clinical assessment and photographic evidence, which may introduce misclassification bias. Long-term renal outcomes were not assessed. Length of hospital stay was analyzed only in relation to major complications and not calculated as an overall summary measure for the entire cohort.