
1. Introduction
Chronic kidney disease (CKD) affects nearly 10% of the global population and represents an expanding public health challenge driven largely by diabetes, hypertension, and population aging (1). The condition is associated with substantial morbidity and mortality, particularly due to cardiovascular complications, and is projected to become the fifth leading cause of years of life lost by 2040 (2,3). The CKD progression is mediated by interconnected mechanisms including metabolic dysregulation, intrarenal renin-angiotensin system activation, chronic inflammation, and oxidative stress (4). Persistent inflammatory signaling and excess reactive oxygen species (ROS) contribute to renal fibrosis, endothelial dysfunction, and cardiovascular injury (5,6). Elevated pro-inflammatory cytokines such as interleukin-1β (IL-1β) have been linked to accelerated renal decline, while malondialdehyde (MDA) is widely used as a biomarker of lipid peroxidation and oxidative damage in CKD (7,8). Sleep disturbances are also highly prevalent in CKD, affecting up to 80% of patients, and are associated with increased inflammation, oxidative stress, metabolic abnormalities, and heightened cardiovascular risk (9,10). Given the bidirectional relationship between circadian rhythm disruption and systemic inflammation, circadian-targeted interventions may offer multidimensional therapeutic benefits. Melatonin, an endogenous regulator of circadian rhythms, additionally exerts antioxidant and anti-inflammatory effects through direct scavenging of free radicals, upregulation of antioxidant enzymes, modulation of inflammatory pathways, and reduction of mitochondrial ROS production (11 - 14). Despite strong mechanistic and preclinical support, clinical evidence regarding melatonin supplementation in non-dialysis CKD remains limited and inconsistent, with most human studies concentrating on sleep outcomes in dialysis populations (15). Considering the central role of inflammation and oxidative stress in CKD progression and the high burden of sleep disturbances, evaluating melatonin in stage 3 - 4 CKD is clinically pertinent. Accordingly, this randomized, double-blind, placebo-controlled trial examined whether 12-week supplementation with 3 mg melatonin could improve inflammatory (IL-1β) and oxidative stress (MDA) biomarkers, as well as metabolic parameters, blood pressure, and sleep quality in adults with stage 3 - 4 CKD.
2. Methods
2.1. Study Design and Setting
This prospective, randomized, double-blind, placebo-controlled clinical trial was conducted at Labbafinejad Hospital, a tertiary university-affiliated center, from May 2024 to March 2025. The study was registered in the Iranian Registry of Clinical Trials (IRCT20160412027346N12) and conducted in accordance with the Declaration of Helsinki and Good Clinical Practice guidelines (16). Ethical approval was granted by the Research Ethics Committee of the School of Pharmacy and Nursing & Midwifery, Shahid Beheshti University of Medical Sciences (Approval ID: IR.SBMU.PHARMACY.REC.1403.299). Written informed consent was obtained from all participants. Trial reporting followed the CONSORT guidelines (17).
2.2. Participants
Adults aged 18 - 75 years with stage 3 - 4 CKD (eGFR 15 - 59 mL/min/1.73 m²), stable renal function for ≥3 months, and not on dialysis were included. Exclusion criteria were end-stage renal disease or kidney transplantation, recent acute kidney injury, uncontrolled hypertension, poorly controlled diabetes (HbA1c ≥9%), active infection or inflammatory, autoimmune, hepatic, or gastrointestinal disorders, recent major cardiovascular events, pregnancy or breastfeeding, history of malignancy, recent use of melatonin, sedatives, antioxidants, corticosteroids, or immunosuppressive drugs, and any condition interfering with study participation.
2.3. Randomization, Blinding, and Intervention
After baseline assessment, participants were randomized 1:1 using a computer-generated sequence to receive either 3 mg melatonin nightly for 12 weeks or a visually identical placebo. Packaging, labeling, appearance, and dosing schedule were identical to ensure blinding, and both participants and study staff remained unaware of group allocation. Medication adherence was evaluated through pill counts at follow-up visits. The 3 mg dose was selected based on prior evidence of safety and biological activity (18).
2.4. Sample Size Calculation
The sample size was determined a priori based on the primary endpoint of the parent randomized controlled trial, which was the expected reduction in proteinuria among adults with stage 3 - 4 CKD. Using a two-sided alpha level of 0.05, 80% statistical power, an anticipated between-group mean difference of 12.66 units, and a standard deviation of 20 units, the calculated effect size was moderate (Cohen’s d ≈ 0.63). Under these assumptions, 41 participants per group (total N = 82) were required. Allowing for an estimated 5% attrition, the planned enrollment target was 88 participants. A total of 73 participants completed the study. While this sample size remained adequate to detect a moderate effect for the primary outcome, the reduced number of completers may have limited statistical power for smaller effect sizes in secondary biochemical outcomes, including inflammatory and oxidative stress markers. Consequently, the potential for type II error in these secondary analyses cannot be excluded.
2.5. Data Collection and Outcomes
The primary outcomes were changes in serum IL-1β and MDA concentrations. Fasting venous blood samples were obtained at baseline and after 12 weeks of intervention. The IL-1β levels were measured using a validated ELISA kit (R&D Systems, Minneapolis, MN, USA) (19), and MDA was quantified using an ELISA-based lipid peroxidation assay (ZellBio GmbH, Ulm, Germany) (20). Secondary outcomes included serum creatinine, estimated glomerular filtration rate (eGFR), electrolytes, lipid profile, fasting blood glucose, blood pressure, and sleep quality. Baseline data collection encompassed demographic characteristics, medical history, current medications, and anthropometric measurements [height, weight, and Body Mass Index (BMI)]. Adherence and adverse events were assessed at each follow-up visit. Baseline medication use, including renin-angiotensin-aldosterone system inhibitors and lipid-lowering agents, was documented at study entry. No protocol-mandated changes to pharmacotherapy were made during the intervention period. Nonetheless, given the high prevalence of polypharmacy in CKD populations, the possibility of residual confounding cannot be fully excluded.
2.6. Statistical Analysis
Analyses followed a modified intention-to-treat approach. Continuous variables were expressed as mean ± SD or median (IQR) and categorical variables as frequency (%). Between- and within-group comparisons used suitable parametric or nonparametric tests, and chi-square tests for categorical data. Longitudinal changes and group-by-time interactions were examined using Generalized Estimating Equations with an exchangeable correlation structure. Statistical significance was set at P < 0.05 (STATA v17). Although the age difference did not reach statistical significance, we recognize its potential biological relevance. Adjusted analyses were conducted within the GEE framework controlling for baseline covariates, including age. Results remained unchanged. Statistical significance was set at P < 0.05 (STATA v17). A post hoc power analysis based on observed mean differences and pooled SDs showed low statistical power (7% for MDA; 6% for IL-1β) with trivial effect sizes (Cohen’s d = 0.10 and 0.08, respectively). Given minimal between-group differences (0.58 and 0.15), the absence of significant findings likely reflects a negligible biological effect rather than sample size limitation.
3. Results
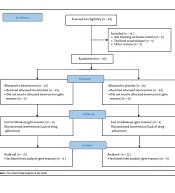
A total of 88 patients were screened for eligibility (Figure 1). Seven individuals were excluded prior to randomization, five due to failure to meet inclusion criteria and two due to declining participation. During the follow-up period, eight participants discontinued the study because of mild adverse events, including headache, skin rash, nausea, and drowsiness. Ultimately, 73 participants completed the 12-week trial (melatonin: n = 37; placebo: n = 36). Overall adherence exceeded 90% in both arms, and no serious adverse events were reported.
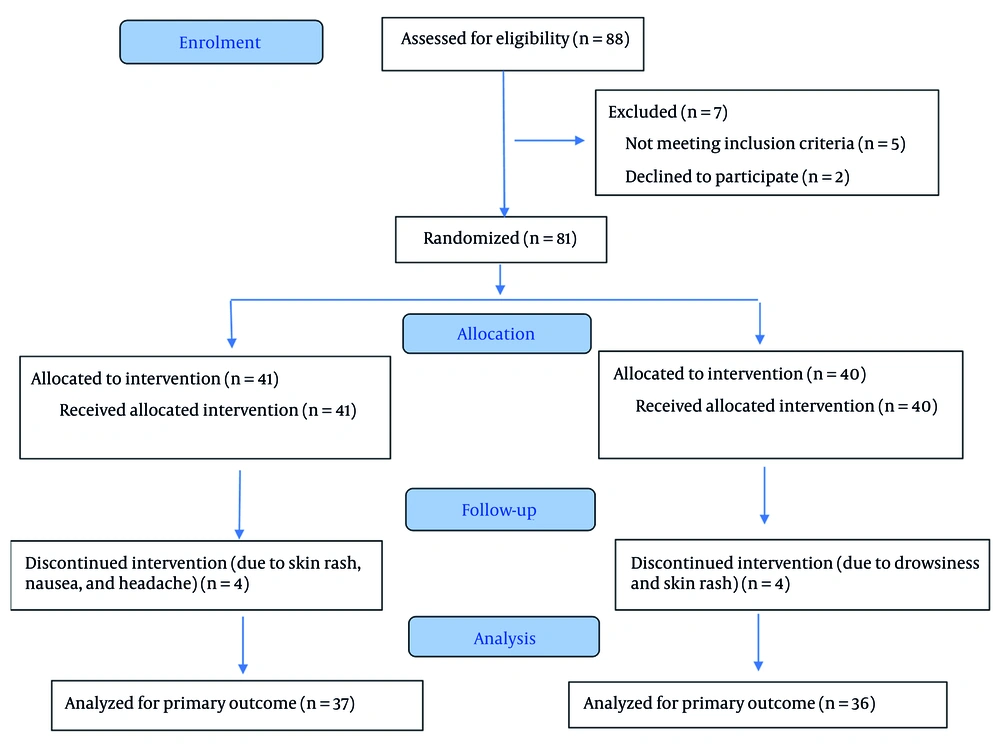
Figure 1.
Study flowchart
3.1. Baseline Characteristics
Baseline demographic and clinical characteristics were comparable between the melatonin and placebo groups (Table 1). No significant differences were detected regarding age, sex distribution, CKD stage, or comorbidity burden including hypertension and diabetes mellitus. Median age was 57 years (IQR: 42 - 67), and 53.4% of participants were male. Median treatment adherence was 91% (IQR: 80 - 100%) with no between-group differences (P = 0.675).
Table 1.
Baseline Demographic and Clinical Characteristics of Patients by Intervention Group a
| Variables | Placebo (N = 36) | Melatonin (N = 37) | Total (N = 73) | P-Value |
|---|---|---|---|---|
| Age (y) | 50.5 (39.5 - 65) | 61 (49 - 69) | 57 (42 - 67) | 0.127 |
| Gender | 0.129 | |||
| Female | 20 (55.56) | 14 (37.84) | 34 (46.58) | |
| Male | 16 (44.44) | 23 (62.16) | 39 (53.42) | |
| Height (cm) | 165.5 (160 - 175) | 172 (163 - 180) | 169 (162 - 178) | 0.074 |
| Weight (kg) | 69 (63.5 - 79.5) | 70 (65 - 75) | 70 (64 - 78) | 0.794 |
| BMI (kg/m2) | 24.65 (22.14 - 27.71) | 23.45 (21.84 - 26.89) | 24.21 (22.03 - 27.34) | 0.440 |
| Total intervention adherence (%) | 91 (80 - 100) | 90 (79 - 99) | 91 (80 - 100) | 0.675 |
Abbreviation: BMI, Body Mass Index.
a Values are described as median and interquartile range (Q1 - Q3) and N (%).
3.2. Renal Function and Inflammatory/Oxidative Markers
As shown in Table 2, kidney function indices and inflammatory markers were not significantly different between-groups at baseline (P > 0.05). After 12 weeks of treatment, neither IL-1β nor MDA levels showed statistically significant within-group or between-group changes (P > 0.05). The MDA exhibited a numerical reduction in the melatonin group (-0.39 ± 9.36) compared to a slight increase in the placebo group (0.69 ± 4.93), but the between-group difference was not significant (P = 0.313). Serum creatinine decreased slightly in both groups; however, changes were not statistically meaningful (P = 0.327).
Table 2.
Renal Function, Inflammatory and Oxidative Stress Markers of Patients by Intervention Group During the Study a
| Variables | Placebo (N = 36) | Pairwise Comparison P-Value b | Melatonin (N = 37) | Pairwise Comparison P-Value b | Between Group Comparison P-Value c |
|---|---|---|---|---|---|
| Serum MDA (nmol/L) | |||||
| Before | 6.55 (4.9 - 11.05) | 0.137 | 6.5 (4.7 - 9.7) | 0.820 | 0.588 |
| After (3-month intervention) | 7 (4.55 - 11.5) | 0.137 | 7 (5 - 10) | 0.820 | 0.933 |
| Difference d | 0.69 ± 4.93 | - | -0.39 ± 9.36 | - | 0.313 |
| Serum IL-1β (pg/mL) | |||||
| Before | 8.2 (7.1 - 9.85) | 0.451 | 8 (7 - 9.2) | 0.993 | 0.561 |
| After (3-month intervention) | 8.5 (7.2 - 9.25) | 0.451 | 8.5 (7 - 9.9) | 0.993 | 0.898 |
| Difference d | 0.05 ± 1.13 | - | 0.09 ± 1.10 | - | 0.640 |
| Serum creatinine (mg/dL) | |||||
| Before | 1.7 (1.3 - 3.25) | <0.001 e | 1.7 (1.4 - 2.35) | 0.003 e | 0.933 |
| After (3-month intervention) | 1.6 (1.3 - 3.0) | <0.001 e | 1.6 (1.4 - 2.2) | 0.003 e | 0.929 |
| Difference d | -0.15 ± 0.26 | - | -0.09 ± 0.17 | - | 0.327 |
| BUN (mg/dL) | |||||
| Before | 33 (21 - 51.5) | 0.746 | 33 (23 - 45) | 0.149 | 0.769 |
| After (3-month intervention) | 33 (22 - 48) | 0.746 | 35 (24 - 42) | 0.149 | 0.584 |
| Difference d | -1.00 ± 4.22 | - | -0.94 ± 3.09 | - | 0.484 |
Abbreviations: MDA, malondialdehyde; IL-1β, interleukin-1β.
a Values are described as median and interquartile range (Q1 - Q3) or mean ± standard deviation.
b Comparison of before intervention value with after (3-month intervention) intervention value (paired comparison).
c Comparison of the means between two groups of intervention.
d Difference = After (3-month intervention) value - baseline value.
e Statistically significant, P-value < 0.05.
3.3. Sleep Quality and Blood Pressure
Table 3 presents the changes in sleep quality and blood pressure. Baseline values were comparable between-groups (P > 0.05). Over the 12-week intervention, PSQI scores showed numerical changes in both groups: the placebo group exhibited a significant within-group decline (P < 0.001), whereas the reduction observed in the melatonin group did not reach statistical significance (P = 0.267). When comparing groups, the melatonin arm demonstrated a relatively more favorable trajectory, with a smaller mean decrease in PSQI score (-0.18 ± 0.84 vs. -0.69 ± 1.06; P = 0.047). The prevalence of poor sleep showed a modest reduction in both groups. Systolic blood pressure increased slightly in the melatonin group (+1.94 ± 4.60; P = 0.012) but did not change significantly in the placebo arm (P = 0.096). Despite these within-group variations, there was no significant difference between treatment groups (P = 0.768).
Table 3.
Sleep Quality and Blood Pressure Assessment of Patients by Intervention Group During Study a
| Variables | Placebo (N = 36) | Pairwise Comparison P-Value b | Melatonin (N = 37) | Pairwise Comparison P-Value b | Between Group Comparison P-Value c |
|---|---|---|---|---|---|
| PSQI score | |||||
| Before | 5.5 (2 - 12.5) | <0.001 d | 7 (3 - 12) | 0.267 | 0.803 |
| After (3-month intervention) | 5 (2 - 11) | <0.001 d | 7 (2 - 12) | 0.267 | 0.591 |
| Difference e | -0.69 ± 1.06 | - | -0.18 ± 0.84 | - | 0.047 d |
| PSQI category | |||||
| Before | - | - | 0.845 | ||
| Poor | 11 (30.56) | - | 13 (35.14) | - | 0.845 |
| Moderate | 8 (22.22) | - | 9 (24.32) | - | 0.845 |
| Good | 17 (47.22) | - | 15 (40.54) | - | 0.845 |
| After (3-month intervention) | |||||
| Poor | 10 (27.78) | 0.563 | 11 (29.73) | 0.157 | 0.836 |
| Moderate | 9 (25.00) | 0.563 | 11 (29.73) | 0.157 | 0.836 |
| Good | 17 (47.22) | 0.563 | 15 (40.54) | 0.157 | 0.836 |
| Difference e | - | - | - | - | - |
| Systolic blood pressure (mmHg) | |||||
| Before | 130 (120 - 140) | 0.096 | 130 (120 - 135) | 0.012 d | 0.924 |
| After (3-month intervention) | 130 (120 - 140) | 0.096 | 130 (120 - 140) | 0.012 d | 0.841 |
| Difference e | 2.36 ± 7.69 | - | 1.94 ± 4.60 | - | 0.768 |
| Diastolic blood pressure (mmHg) | |||||
| Before | 90 (80 - 90) | 0.669 | 90 (80 - 90) | 0.541 | 0.680 |
| After (3-month intervention) | 90 (80 - 90) | 0.669 | 90 (80 - 90) | 0.541 | 0.311 |
| Difference e | 0.55 ± 4.74 | - | -0.13 ± 3.99 | - | 0.514 |
Abbreviation: PSQI, Pittsburgh Sleep Quality Index.
a Values are described as median and interquartile range (Q1 - Q3) or mean ± standard deviation.
b Comparison of before intervention value with after (3-month intervention) intervention value (paired comparison).
c Comparison of the means between two groups of intervention.
d Statistically significant, P-value < 0.05.
e Difference = After (3-month intervention) value - baseline value.
3.4. Lipid Profile and Glycemic Measures
Table 4 presents lipid and glycemic profiles. Baseline values did not differ significantly between groups (P > 0.05). At follow-up, total cholesterol decreased significantly in the melatonin group (−1.02 ± 2.96), whereas no significant change was observed in the placebo group; the between-group difference favored melatonin (P = 0.029). LDL increased modestly in the melatonin group (P = 0.020) but not in the placebo group (P = 0.062), with no significant between-group difference (P = 0.675). HDL increased significantly only in the placebo group (P = 0.030), though the between-group comparison remained nonsignificant (P = 0.173). Triglycerides and fasting glucose showed no meaningful changes (P > 0.05).
Table 4.
Lipid and Glycemic Profiles of Patients by Intervention Group During Study a
| Variables | Placebo (N = 36) | Pairwise Comparison P-Value b | Melatonin (N = 37) | Pairwise Comparison P-Value b | Between group Comparison P-Value c |
|---|---|---|---|---|---|
| Total cholesterol (mg/dL) | |||||
| Before | 152 (124.5 - 184.5) | 0.426 | 153 (135 - 179) | 0.042 d | 0.896 |
| After (3-month intervention) | 152 (125 - 184.5) | 0.426 | 153 (135 - 175) | 0.042 d | 0.781 |
| Difference e | 0.19 ± 1.45 | - | -1.02 ± 2.96 | - | 0.029 d |
| LDL (mg/dL) | |||||
| Before | 79.5 (57.5 - 102) | 0.062 | 81 (64 - 100) | 0.020 d | 0.514 |
| After (3-month intervention) | 80.5 (57.5 - 102.5) | 0.062 | 84 (65 - 100) | 0.020 d | 0.466 |
| Difference e | 0.50 ± 1.79 | - | 0.48 ± 1.32 | - | 0.675 |
| HDL (mg/dL) | |||||
| Before | 40.5 (35 - 49.5) | 0.030 d | 40 (36 - 49) | 0.560 | 0.929 |
| After (3-month intervention) | 40.5 (35.5 - 50.5) | 0.030 d | 40 (37 - 49) | 0.560 | 0.829 |
| Difference e | 0.97 ± 3.35 | - | 0.02 ± 1.04 | - | 0.173 |
| Triglyceride (mg/dL) | |||||
| Before | 140.5 (94 - 181) | 0.522 | 130 (107 - 188) | 0.682 | 0.808 |
| After (3-month intervention) | 141.5 (94 - 180.5) | 0.522 | 130 (107 - 188) | 0.682 | 0.757 |
| Difference e | -0.89 ± 6.35 | - | -0.02 ± 1.32 | - | 0.451 |
| FBS (mg/dL) | |||||
| Before | 95.5 (83 - 107.5) | 0.197 | 97 (90 - 110) | 0.180 | 0.304 |
| After (3-month intervention) | 95.5 (83.5 - 105) | 0.197 | 97 (90 - 110) | 0.180 | 0.291 |
| Difference e | 0.08 ± 2.03 | - | 0.27 ± 1.23 | - | 0.970 |
Abbreviation: FBS, fasting blood sugar.
a Values are described as median and interquartile range (Q1 - Q3) or mean ± standard deviation.
b Comparison of before intervention value with after (3-month intervention) intervention value (paired comparison).
c Comparison of the means between two groups of intervention.
d Statistically significant, P-value < 0.05.
e Difference = After (3-month intervention) value - baseline value.
3.5. Serum Electrolytes
Table 5 shows that baseline serum electrolytes did not differ between groups. Serum potassium decreased significantly in the melatonin group (P < 0.001), while nonsignificant reductions occurred in the placebo group (P = 0.230). Differences between groups did not reach statistical significance (P = 0.073). Sodium levels remained stable throughout the study.
Table 5.
Serum Electrolytes of Patients by Intervention Group During Study a
| Variables | Placebo (N = 36) | Pairwise Comparison P-Value b | Melatonin (N = 37) | Pairwise Comparison P-Value b | Between Group Comparison P-Value c |
|---|---|---|---|---|---|
| Serum sodium (Na, mEq/L) | |||||
| Before | 139.5 (137.5 - 141) | 0.193 | 140 (138 - 141) | 0.087 | 0.713 |
| After (3-month intervention) | 140 (138 - 141.5) | 0.193 | 140 (138 - 141) | 0.087 | 0.885 |
| Difference d | 0.36 ± 1.60 | - | 0.21 ± 1.20 | - | 0.578 |
| Serum potassium (K, mmol/L) | |||||
| Before | 4.3 (4 - 4.6) | 0.230 | 4.4 (4.2 - 4.7) | <0.001 e | 0.101 |
| After (3-month intervention) | 4.3 (4 - 4.6) | 0.230 | 4.3 (4.2 - 4.5) | <0.001 e | 0.185 |
| Difference d | -0.02 ± 0.13 | - | -0.07 ± 0.12 | - | 0.073 |
a Values are described as median and interquartile range (Q1 - Q3) or mean ± standard deviation.
b Comparison of before intervention value with after (3-month intervention) intervention value (paired comparison).
c Comparison of the means between two groups of intervention.
d Difference = After (3-month intervention) value - baseline value.
e Statistically significant, P-value < 0.05.
3.6. Longitudinal Trends
Figures 2 - 4 illustrate longitudinal trends. GEE analysis revealed significant time-related changes in total cholesterol and LDL only in the melatonin group (P < 0.05), but treatment-by-time interactions were not significant (P > 0.05). Systolic blood pressure demonstrated a significant upward trend in the melatonin arm (P = 0.005), with a significant group-by-time interaction (P = 0.013), indicating differing trajectories between-groups. For renal indices, creatinine trends over time and their interactions with treatment were significant (P < 0.05). BUN and potassium also showed significant trends in the melatonin group with significant interaction terms (P = 0.016 and P = 0.003, respectively), while trend for sodium was nonsignificant.
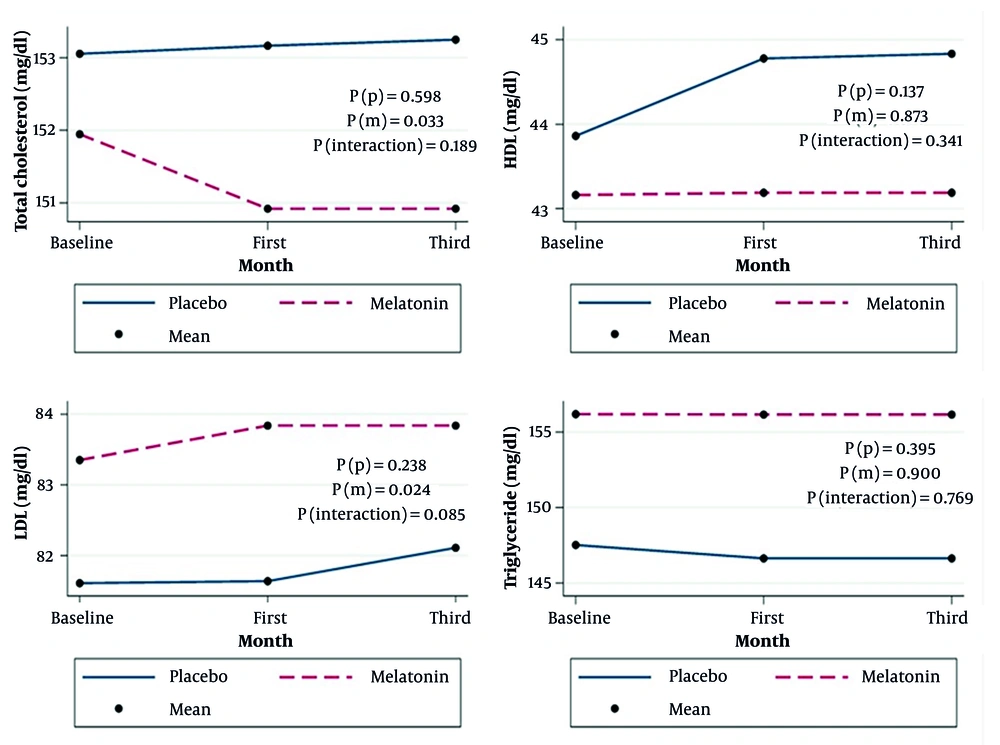
Figure 2.
Longitudinal changes in lipid profi le (total cholestrol, HDL, LDL, Triglyceride) over the 12 week intervention period
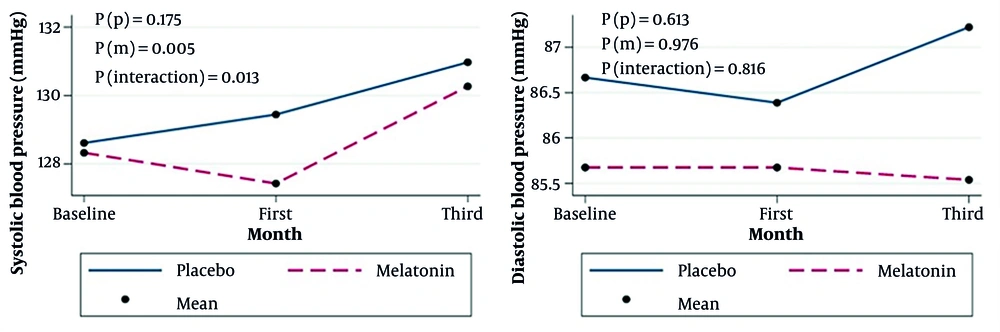
Figure 3.
Longitudinal changes in systolic and diastolic blood pressure over the 12 week intervention period
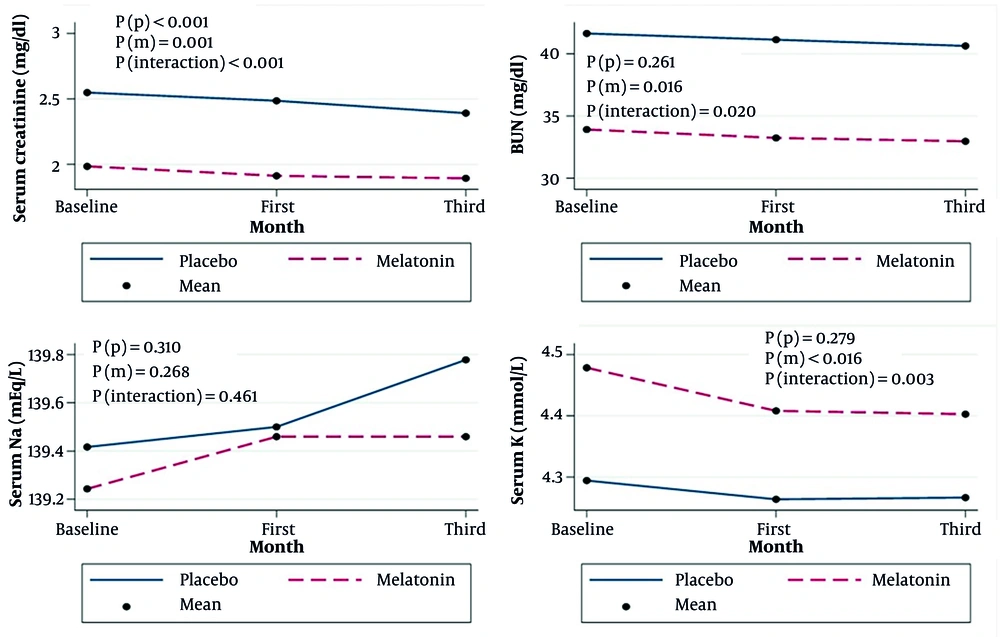
Figure 4.
Longitudinal changes in serum creatinine, blood urea nitrogen (BUN), serum sodium, and serum potassium over the 12 week intervention period
4. Discussion
In this randomized, double-blind, placebo-controlled trial, 3 mg of nightly melatonin for 12 weeks did not significantly reduce IL-1β or MDA levels in patients with stage 3 - 4 CKD. Although slight within-group numerical declines were observed, the differences compared with placebo were not statistically significant, indicating minimal effect on inflammatory and oxidative stress markers at this dose and duration. Several factors may explain these neutral findings, including a potentially subtherapeutic dose, limited intervention duration, relatively low baseline inflammatory burden in some participants, and clinical heterogeneity in CKD etiology, comorbidities, and concomitant medications.
4.1. Comparison With Previous Studies
Our findings are consistent with prior randomized trials in CKD and related metabolic conditions. A 10-week study in diabetic CKD patients found no significant change in MDA, IL-6, or hs-CRP with 5 mg melatonin twice daily (21), and Sadeghi et al. similarly observed no improvements in TAC, TOS, or inflammatory cytokines (22). Together, these results suggest that the impact of melatonin on inflammatory and oxidative biomarkers in human CKD may be smaller than anticipated from preclinical research. In contrast, numerous animal studies have demonstrated robust renoprotective effects. Melatonin reduces oxidative stress, inflammation, and fibrosis in the remnant kidney model (23), and improves proteinuria, glomerular structure, and oxidative injury in hypertensive and salt-sensitive models independent of blood pressure effects (24,25). Observational human data also indicate biological plausibility: lower endogenous melatonin levels correlate with CKD severity, attenuated circadian rhythm amplitude, sleep disturbances, and elevated pro-inflammatory cytokines such as TNF-α and IL-6 (26,27). The discrepancy between strong preclinical efficacy and modest clinical responses highlights challenges in translating melatonin’s mechanistic potential into measurable biochemical effects in CKD populations. Possible contributors include insufficient statistical power, short treatment duration, suboptimal dosing, low baseline inflammation, interindividual variability in melatonin metabolism, and the narrow biomarker panel used.
4.2. Biological Plausibility
Despite the absence of significant biochemical effects, melatonin’s mechanistic profile supports further investigation. Melatonin directly scavenges free radicals, upregulates endogenous antioxidant enzymes (SOD, catalase, glutathione peroxidase), modulates redox signaling, chelates transition metals, and reduces mitochondrial ROS generation (28). It also suppresses NF-κB activation, reduces pro-inflammatory cytokine production, and inhibits inflammasome activation. Additional CKD-relevant mechanisms include regulation of circadian rhythms, restoration of physiological nocturnal blood pressure dipping, and attenuation of intrarenal RAS activity (29). Experimental models also show activation of Nrf2-mediated antioxidant pathways and stabilization of mitochondrial function mechanisms that may be blunted in advanced CKD due to chronicity, pathway saturation, or altered receptor sensitivity.
4.3. Clinical Interpretation
Although biochemical outcomes were neutral, a modest but statistically significant reduction in total cholesterol was observed in the melatonin group. The magnitude of reduction was small, and its clinical significance for cardiovascular risk mitigation in CKD remains uncertain. Conversely, a slight within-group increase in LDL cholesterol occurred, though the absolute change was minimal and may reflect biological variability, background statin therapy, dietary fluctuations, or measurement noise. VLDL subfraction was not assessed, limiting mechanistic interpretation. Detailed lipid subclass analysis in future studies would help clarify these effects. A small (~2 mmHg) but statistically significant increase in systolic blood pressure was noted within the melatonin group. This change is unlikely to be clinically meaningful and may reflect measurement variability, timing differences, fluid status fluctuations, adjustments in antihypertensive therapy, or regression to the mean rather than a direct hypertensive effect of melatonin. Although a statistically significant reduction in serum potassium was observed, values remained within the physiological reference range and did not meet criteria for clinically relevant hypokalemia. No potassium-related adverse events were reported. The mechanism underlying this observation remains uncertain. Possible contributors include dietary variation, diuretic use, RAAS modulation, or biological variability rather than a direct pharmacologic effect of melatonin. Larger, tightly controlled trials are needed to determine whether these findings are reproducible.
4.4. Dose and Duration Considerations
The melatonin regimen used in this study, a 3 mg nightly dose over 12 weeks, was selected based on its widespread clinical use for sleep disturbances and its established safety profile. However, patients with stage 3 - 4 CKD experience substantial oxidative stress and chronic inflammation, and may require higher doses (e.g., 5 - 10 mg) or longer treatment durations to achieve measurable biochemical effects. Consequently, the dosing strategy and relatively short intervention period may have been insufficient to meaningfully modulate the targeted inflammatory and oxidative pathways, potentially contributing to the gap between preclinical evidence and clinical outcomes. Longer interventions of at least six months are warranted in future studies to more robustly assess biological responses.
4.5. Limitations
This study has several limitations. First, the sample size was modest, and post-hoc analyses indicated very low achieved power (7% for MDA; 6% for IL-1β), reflecting trivial effect sizes (Cohen’s d < 0.10). Although the trial was originally powered to detect a moderate effect size (d ≈ 0.63; 80% power), the final sample of 73 completers was below the targeted 82 participants, further reducing power to detect small-to-moderate biochemical changes and increasing the risk of type II error. Second, serum or urinary melatonin (6-sulfatoxymelatonin) concentration were not measured, limiting assessment of pharmacokinetic variability, absorption, and exposure-response relationships. Third, the 12-week intervention may have been insufficient to meaningfully influence chronic inflammatory or oxidative pathways. Fourth, sleep quality was assessed using the PSQI, a validated but subjective instrument; objective measures such as actigraphy or polysomnography may offer more precise characterization. Fifth, the biomarker panel was limited to IL-1β and MDA. Although widely used, MDA is a relatively nonspecific lipid peroxidation marker; additional or kidney-specific biomarkers (e.g., F2-isoprostanes, NGAL, or tubular injury markers) could provide deeper mechanistic insights. The final point to acknowledge, excluding individuals with uncontrolled diabetes or hypertension may limit the generalizability of our findings to higher-risk CKD populations. This restriction was implemented to minimize major confounding inflammatory influences and to ensure participant safety, but it necessarily narrows the applicability of the results.
4.6. Conclusion and Future Directions
In this randomized, double-blind, placebo-controlled trial, nightly supplementation with 3 mg of melatonin for 12 weeks did not significantly reduce IL-1β or MDA levels in adults with stage 3 - 4 CKD. Although biochemical effects on inflammation and oxidative stress were neutral, melatonin was well tolerated and produced modest improvements in total cholesterol without evidence of cardiovascular instability. With respect to sleep, melatonin appeared to confer a stabilizing effect, sleep quality remained comparatively more stable relative to placebo, suggesting a potential protective influence rather than a curative impact on established sleep disturbances. However, these observations should be interpreted cautiously given the absence of objective sleep assessments. Strengths of the study included rigorous blinding, high adherence, and structured safety monitoring. Key limitations, modest sample size, single-center design, lack of serum melatonin measurements, restricted biomarker panel, and reliance on subjective sleep evaluation, limit definitive conclusions regarding mechanistic or clinical efficacy. Future trials should prioritize larger, multicenter designs with longer follow-up, higher or titrated melatonin dosing, and comprehensive mechanistic endpoints. Incorporating pharmacokinetic profiling, expanded inflammatory and oxidative stress biomarkers, and objective measurements of sleep and circadian rhythm will be essential to delineate dose-response relationships and to clarify whether melatonin may offer protective value in mitigating the inflammatory, oxidative, metabolic, and sleep-related burden of CKD.