
1. Background
Pseudomonas aeruginosa is a non-fermenting gram-negative aerobic bacillus commonly causing skin infections in burn injuries, pneumonia in cystic fibrosis and ventilator-dependent patients, and bloodstream infections in immunocompromised individuals. In addition, the organism is a significant cause of urinary tract and surgical wound infections in the normal population (1, 2). In recent years, the pathogen has been known as a significant etiology of nosocomial infections, especially in patients who are admitted to intensive care unit (ICU) and is associated with high mortality rates in these patients (3, 4).
Resistance of the organism to many available antibiotics is a worldwide health concern, especially in nosocomial infections that accompany increased mortality and high economic and social costs (5, 6).
Many of the previous studies have reported a high prevalence of resistance of the bacterium to penicillins, third and fourth-generation cephalosporins, aminoglycosides, carbapenems, and fluoroquinolones in different geographic areas of the world (2, 7-9). The antibiotic resistance rate varied in other countries and even in different regions of each country. For example, in a study in the United States in 2015, 84% of the isolates were susceptible to ceftazidime (10), while in a systematic review in Iran in 2020, the cumulative susceptibility of the organism to this drug was estimated to be 60% (7). On the other hand, the resistance rate to imipenem in Iran was 54.9% (11) in one area and 30.0% in another (12).
Knowing the susceptibility of microorganisms to different antibiotics in each region is essential for rational prescription of antibiotics. Previous studies on the susceptibility of clinical isolates of P. aeruginosa in Iran have experienced significant limitations, such as small sample sizes and the inclusion of contaminated samples in the analysis. Furthermore, the studies have reported the susceptibility of the isolates in different clinical scenarios, such as community versus hospital acquisition, pediatric versus adult participants, and ICU versus non-ICU admission of the patients.
2. Objectives
This study aimed to compare the antibiotic susceptibility of pathogenic P. aeruginosa isolates in various clinical conditions, including community or hospital acquirement of the infection, pediatric or adult age group, and ICU or non-ICU ward of admission.
3. Methods
This study aims to report the antimicrobial susceptibility of community and nosocomial P. aeruginosa isolates obtained from hospitalized patients in three large referral hospitals in Isfahan, Iran. The study involved three major referral hospitals: Al-Zahra, Dr. Shariati, and Dr. Gharazi. The laboratories of these hospitals have received a quality certificate from the Iranian Ministry of Health for conducting microbiological tests and have been partners of the World Health Organization in the Global Antimicrobial Resistance Surveillance System program (13).
Clinical samples in enrolled hospitals included blood, urine, cerebrospinal fluid, lower respiratory tract secretion, and abscess discharges, prepared with aseptic techniques from inpatients with suspected bacterial infections.
Pseudomonas aeruginosa strains were isolated by conventional biochemical tests and in agreement with recommendations of Clinical Laboratory Standard Institute (CLSI) guidelines. In addition, the susceptibility of the isolates to different antibiotic classes, including penicillins, third and fourth-generation cephalosporins, aminoglycosides, carbapenems, fluoroquinolones, and folate antagonists, was determined by dehydrated discs (MAST, Merseyside, and UK) in accordance to the standard guidelines of CLSI (14). Susceptibility to colistin was assessed by the MIC method in isolates with high levels of resistance to all examined antibiotics (Liofilchem, Italy).
Contaminant strains were identified and excluded from the study by the participating hospitals' infection control nurses and physicians after isolating P. aeruginosa species. When the organism was isolated from patients with clinical or para-clinical manifestations of the infection at the sampling site, the organism was considered a true pathogen. The rest of the isolates were identified as contaminated. In addition, the infection control nurses and physicians in the enrolled medical centers determined the source of the infection in each patient with P. aeruginosa infection. When the clinical sample was sent after 48 hours of hospitalization and due to the appearance of a new infection symptom, the isolated bacteria were considered hospital bacteria. The rest of the bacteria were known as community bacteria.
3.1. Statistical Analysis
The information on antibiotic susceptibility of P. aeruginosa isolates, place of the infection (hospital, community), group of inpatient departments (ICU and non-ICU), and age group of patients (below 20 years and above 20 years) was extracted from WHONET software version 5.6 in enrolled hospitals. The data were analyzed using SPSS software version 18. The antibiotic susceptibility of the isolates was compared in various clinical conditions using chi-square and Fisher's exact tests. A P-value of less than 0.05 was considered as significant.
4. Results
A total of 261 P. aeruginosa isolates were identified, of which 56 samples were considered contaminants and excluded from the study. Of 208 patients with documented P. aeruginosa infection, 120 (57.7%) were males, 21 (10.1%) were below 20 years, 120 (57.7%) had acquired the infection from the community, and 33 (16.1%) were admitted to the ICU department (Figure 1). The most common diagnosis of the patients was sepsis 74 (35.6%), followed by urinary tract 54 (26%), skin and soft tissue 28 (13.5%), and other infections 52 (24.9%) (Figure 2).
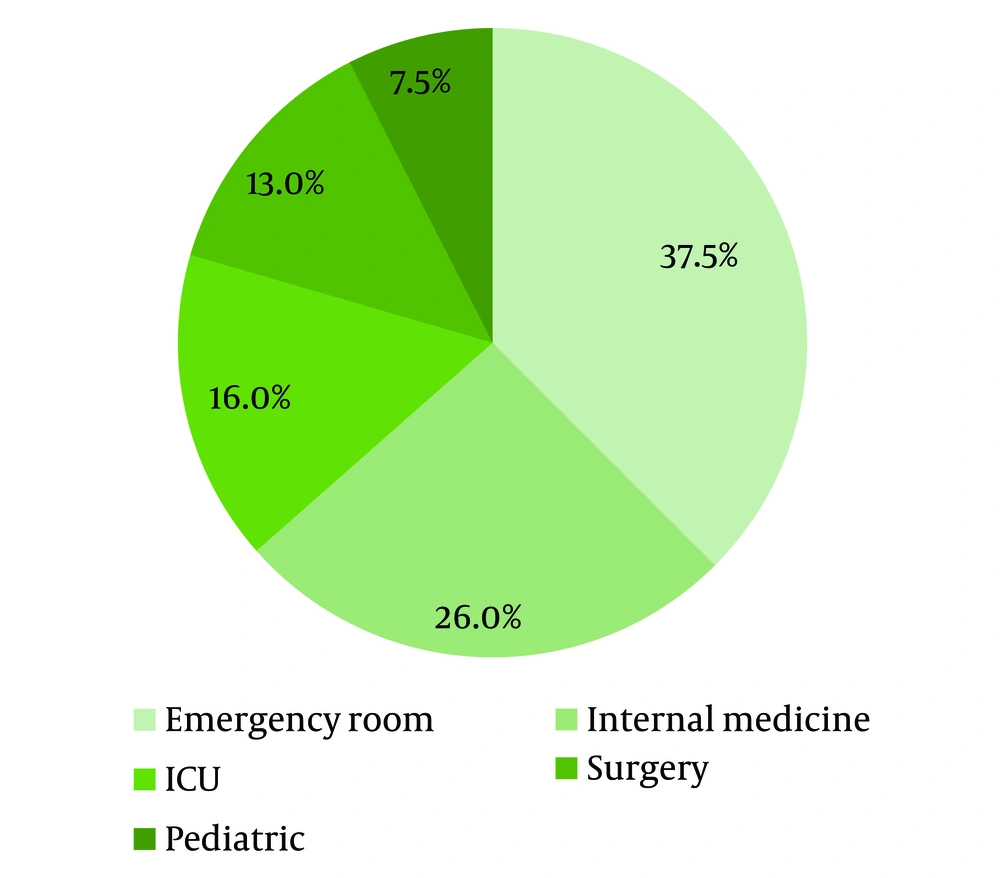
Figure 1.
Frequency of Pseudomonas aeruginosa isolates per inpatient wards in three referral hospitals in Isfahan, Iran
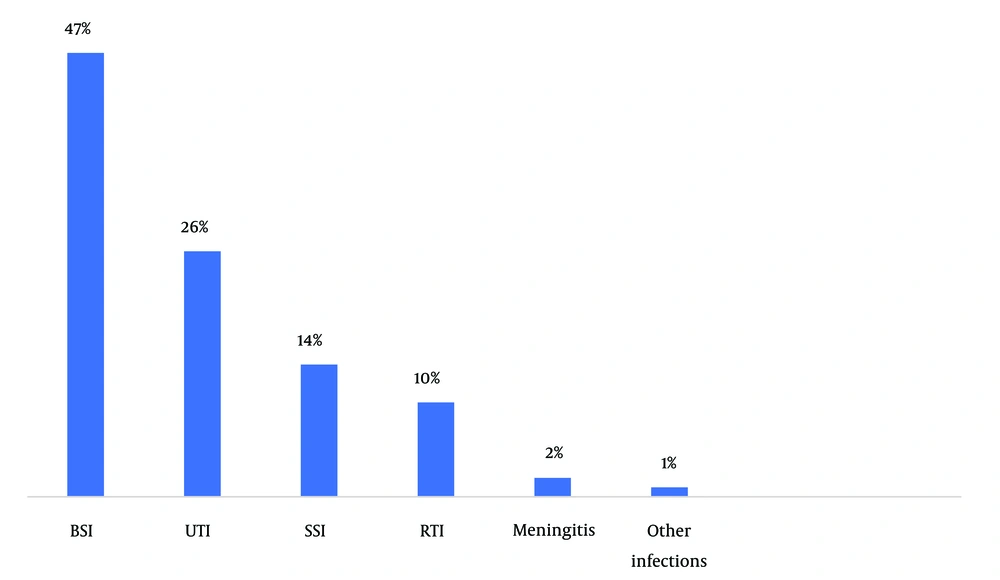
Figure 2.
Frequency of P. aeruginosa isolates per infection type in patients admitted in three referral hospitals in Isfahan, Iran (BSI: Blood stream infections; UTI: Urinary tract infections; SSI: Skin and soft tissue infections; RTI: Respiratory tract infections).
The isolates were mainly susceptible to colistin (100%), amikacin (81.8%), tobramycin (69.2%), ciprofloxacin (68.5%), meropenem (67.2%), cefepime (65.7%), ceftazidime (64.3%), and imipenem (63.3%), respectively. On the other hand, the strains have less susceptibility to ampicillin-sulbactam (7.5%), ceftriaxone (23.7%), and trimethoprim-sulfamethoxazole. Community-acquired strains were significantly more susceptible to ciprofloxacin (77.1%), meropenem (81.6%), cefepime (77.1%), ceftazidime (72.2%), and imipenem (74.3%) than nosocomial strains (Table 1).
Table 1.
Sensitivity Profile of Pseudomonas aeruginosa Per the Source of the Infection in Patients Admitted in Three Referral Hospitals in Isfahan, Irana
| Antibiotic Name | Sensitivity of the Isolates | Total | ||
|---|---|---|---|---|
| Community-Acquired | Hospital-Acquired | P-Value | ||
| Ampicillin/sulbactam | 0/21 (0) | 3/19 (15.8) | 0.098 b | 3/40 (7.5) |
| Ceftazidime | 83/115 (72.2) | 45/84 (53.6) | 0.007 | 128/199 (64.3) |
| Ceftriaxone | 7/22 (31.8) | 2/16 (12.5) | 0.544 b | 9/38 (23.7) |
| Cefepime | 84/115 (73.0) | 46/83 (55.4) | 0.010 | 130/198 (65.7) |
| Imipenem | 26/35 (74.3) | 12/25 (48.0) | 0.037 | 38/60 (63.3) |
| Meropenem | 84/103 (81.6) | 41/83 (49.4) | 0.000 | 125/186 (67.2) |
| Amikacin | 95/114 (83.3) | 67/84 (79.8) | 0.960 | 162/198 (81.8) |
| Tobramycin | 11/16 (68.8) | 7/10 (70.0) | 1.000 b | 18/26 (69.2) |
| Ciprofloxacin | 84/109 (77.1) | 42/75 (56.0) | 0.003 | 126/184 (68.5) |
| Trimethoprim/sulfamethoxazole | 20/37 (54.1) | 4/23 (17.4) | 0.007 b | 24/60 (40.0) |
| Colistin (E-test) | 11/11 (100) | 9/9 (100) | - | 20/20 (100) |
a n/N (%): Number of (community or hospital-acquired) or sensitive isolates/total number of examined isolates (%).
b When the conditions for Pearson’s chi-square test are not met, especially when one or more of the cells have expi < 5, an alternative approach with 2 × 2 contingency tables is to use Fisher’s exact test.
P. aeruginosa isolates, which caused infection in patients hospitalized in ICU departments, were susceptible to amikacin (75%), followed by cefepime (53%) and ceftazidime (52%).
Non-ICU isolates exhibited more susceptibility to imipenem (75%), meropenem (73%), and ciprofloxacin (73%) than the ICU strains (Table 2).
Table 2.
Sensitivity Profile of Pseudomonas aeruginosa in Accordance to Admission Ward (Intensive Care Unit and Non-Intensive Care Unit) in Patients Admitted in Three Referral Hospitals in Isfahan, Iran a
| Antibiotic Name | Sensitivity of the Isolates | ||
|---|---|---|---|
| ICU | Non-ICU | P-Value | |
| Amikacin | 24/32 (75) | 141/167 (84) | 0.194 |
| Cefepime | 17/32 (53) | 116/167 (70) | 0.072 |
| Ceftazidime | 16/31 (52) | 116/168 (69) | 0.059 |
| Ceftriaxone | 0/11 (0) | 9/26 (35) | 0.036 b |
| Ciprofloxacin | 12/26 (46) | 116/158 (73) | 0.005 |
| Imipenem | 3/11 (27) | 36/48 (75) | 0.005 b |
| Meropenem | 14/31 (45) | 112/154 (73) | 0.003 |
| Tobramycin | 2/5 (40) | 18/23 (78) | 0.123 b |
| Trimethoprim/sulfamethoxazole | 1/10 (10) | 24/49 (49) | 0.034 b |
a n/N (%): Number of (ICU or non-ICU) isolates/total number of examined isolates (%).
b When the conditions for Pearson’s chi-square test are not met, especially when one or more of the cells have expi < 5, an alternative approach with 2 × 2 contingency tables is to use Fisher’s exact test.
The antibiotic susceptibility of P. aeruginosa strains in different age groups demonstrated no significant difference between the age group of less than 20 years and ages of greater than 20 years in all studied antibiotics except for ciprofloxacin, which revealed higher susceptibility in the age group of less than 20 years. In this study, P. aeruginosa strains isolated from patients under 20 years of age were highly sensitive to ciprofloxacin (100%) (Table 3).
Table 3.
Sensitivity Profile of Pseudomonas aeruginosa Per Age Group in Patients Who Were Admitted in Three Referral Hospitals in Isfahan, Iran a
| Antibiotic Name | Sensitivity of the Isolates | ||
|---|---|---|---|
| Samples < 20 y | Samples > 20 y | P-Value | |
| Amikacin | 18/19 (95) | 147/180 (82) | 0.207 b |
| Cefepime | 16/20 (80) | 117/179 (65) | 0.220 b |
| Ceftazidime | 16/21 (76) | 116/178 (65) | 0.464 b |
| Ceftriaxone | 0/3 (0) | 9/34 (27) | 0.582 b |
| Ciprofloxacin | 10/10 (100) | 118/174 (68) | 0.033 b |
| Colistin | 2/2 (100) | 62/62 (100) | - |
| Imipenem | 6/7 (86) | 33/52 (64) | 0.404 b |
| Meropenem | 12/14 (86) | 114/171 (67) | 0.232 b |
| Tobramycin | 5/5 (100) | 15/23 (65) | 0.281 b |
| Trimethoprim/sulfamethoxazole | 2/4 (50) | 23/55 (42) | 1.000 b |
aSamples (y)/total number of examined isolates (%).
b When the conditions for Pearson’s chi-square test are not met, especially when one or more of the cells have expi < 5, an alternative approach with 2 × 2 contingency tables is to use Fisher’s exact test.
5. Discussion
This study showed that all P. aeruginosa isolates were highly susceptible to colistin, followed by amikacin and tobramycin. Additionally, community-acquired strains were highly susceptible to ciprofloxacin, cefepime, ceftazidime, and imipenem, and isolates under 20 years showed high sensitivity to ciprofloxacin.
This study, in agreement with similar research, showed that all P. aeruginosa isolates were susceptible to colistin (7-10, 15). Due to the high frequency of side effects and low antibacterial efficacy of the drug (16), it should be combined with other antibacterial anti-pseudomonal medicines in the empiric treatment of critically ill patients suspected of P. aeruginosa infection.
About 83% of the isolates showed susceptibility to amikacin. This high susceptibility was observed in all ages, places of infection, and inpatient department groups. Thus, the drug could be appropriate for treating critically ill patients with probable P. aeruginosa infection. Amikacin's efficacy in treating P. aeruginosa infections varied across different regions. While Germany and the United States had high sensitivity rates (93% and 80%, respectively), India and Iran had low susceptibility rates (48% and 33 - 62% respectively) (2, 10, 15, 17-19).
The present study demonstrated the moderate susceptibility (63 - 68%) of P. aeruginosa strains to ciprofloxacin, meropenem, cefepime, ceftazidime, and imipenem. The susceptibility of community-acquired isolates to these drugs (72 - 82%) was significantly higher than that of nosocomial isolates (48 - 56%. On the other hand, the sensitivity of strains isolated from non-ICU patients to these drugs (69 - 75%) was significantly higher than ICU patients (27 - 53%). Therefore, these antibiotics may be appropriate for empiric treatment of non-ICU inpatients with suspected community-acquired P. aeruginosa infection. The sensitivity of P. aeruginosa to these antibiotics was different from previous studies. In some areas, the level of sensitivity was similar to the present research and differed in others. These differences showed the necessity of periodic determination of bacterial susceptibility in different regions to implement effective antibacterial treatment in each area (2, 8, 17-19).
The susceptibility of nosocomial and community-acquired P. aeruginosa strains to tobramycin was high (about 69%). However, the sensitivity of the strains to this drug was low in patients hospitalized in ICU (about 40%). Similar studies in Brazil, Iran, and India have reported the low susceptibility of P. aeruginosa isolates to tobramycin (32 - 42%) (20-22).
Most of the isolates had low susceptibility to ampicillin-sulbactam, ceftriaxone, and trimethoprim-sulfamethoxazole. Therefore, these antibiotics are not good choices for the empiric treatment of suspected P. aeruginosa infections in Iran. Other similar studies in Iran, India, and Brazil have shown similar results (2, 20, 21).
This study had a limitation in determining the antibacterial susceptibility of isolates for all classes of antibiotics. Therefore, multi- and pan-drug-resistant strains could not be reported. This study was conducted as part of routine laboratory work, and not all microbiological kits were available during the isolation of P. aeruginosa strains.
5.1. Conclusions
Based on the results, a combination of colistin and amikacin would be appropriate for the empiric treatment of suspected P. aeruginosa infections in severe cases, nosocomial infections, or patients admitted to ICU. Ceftazidime, cefepime, ciprofloxacin, meropenem, or imipenem would be suitable for mild to moderate infections, especially in community-acquired infections.