
1. Background
Rheumatoid arthritis (RA) is among the most common chronic systemic autoimmune diseases with protean manifestations. Although RA primarily affects small joints, the concomitant systemic inflammation in RA can potentially involve any body organs and lead to various coexisting complications (1). Cardiovascular disease (CVD) is the most noticeable long-term sequela of RA and the leading cause of premature death in RA patients (1, 2). Patients with RA experience atherosclerosis, heart failure, atrial fibrillation, and stroke with a double risk (2). Traditional risk factors, including dyslipidemia and hypertension, do not have a usual effect on CVD development in RA patients compared to healthy populations, requiring CVD risk management and preventive measures in RA (2-5).
Among the leading factors related to CVD development in RA patients, persistent systemic inflammation underlying the pathogenesis of RA received increased attention. Classical variables, including lipid profile, commonly used for CVD risk assessment in RA patients, are affected by RA-associated inflammatory conditions (6). Atherosclerosis is also influenced by chronic systemic inflammation characteristic of RA (7, 8). Atherosclerosis is the most common form of CVD in RA patients, regarding the European Alliance of Associations for Rheumatology (EULAR) last update, and screening for asymptomatic atherosclerotic plaques can be appreciated as part of the CVD risk assessment in RA (6, 9).
Finding a possible link between RA, CVD, and inflammation is one of the priorities in RA research. Among various factors, the pro-inflammatory cytokines, including TNF-α, IL-6, and IL-1, have well-established roles in the pathogenesis of RA and the promotion of atherosclerosis through vascular hemostasis disruption. The CVD risk dampens in RA patients following treatment with biologic disease modifying anti-rheumatic drugs (bDMARDs), especially with TNF-α inhibitors (10-12).
There are six identified human splice variants of C-X-C motif chemokine ligand 12 (CXCL12)/stromal cell-derived factor 1 (SDF-1), which are encoded by the same gene on chromosome 10q11 (13, 14). A heterogeneous cell type secretes CXCL12 and, CVD along with its role in following attachment to its receptor CXCR4, exerts a critical biological function, including hematopoiesis, angiogenesis, and mounting inflammatory reactions (13).
Previous studies have shown that CXCL12 plays a pivotal role in RA-associated inflammatory processes in the synovium, mainly through the recruitment and activation of B and T cells (15-17). In addition, some studies have reported higher expression of CXCL12 in serum and synovial fluid in RA patients (16, 17).
C-X-C motif chemokine ligand 12 is one of the critical molecules in the pathogenesis of CVD, along with its role in RA pathogenesis. The association of high serum levels of CXCL12 with increased major adverse cardiovascular events (MACEs) has been documented in previous studies (18). The Coronary artery disease genome-wide replication and meta-analysis study (CARDIoGRAM) showed a significant relationship between the CXCL12 locus and the risk for coronary artery disease (CAD) (19). Furthermore, a recent study showed that endothelial-derived CXCL12 exerts a pivotal role in atherosclerotic plaque development (20).
This study aimed to find a relationship between inflammation and cardiovascular disease in RA patients regarding the dual role of CXCL12 in the pathogenesis of CVD and RA. In this study, the correlation among plasma CXCL12 was evaluated with conventional cardiovascular biomarkers, including fasting blood sugar (FBS), plasma lipid profiles, and hypertension, and two well-established cardiac biomarkers, including high sensitivity C-reactive protein (HS-CRP) and N-terminal pro-B-type natriuretic peptide (NT-proBNP). C-reactive protein is an acute-phase response protein whose concentration is sharply elevated following the stimulation of liver hepatocytes by pro-inflammatory cytokines such as IL-6 (21). High sensitivity C-reactive protein measurement is the indicator of cardiovascular risk in RA patients (22). N-terminal pro-B-type natriuretic peptide is another biomarker of cardiovascular disease, whose concentration increases in the onset of heart disorders (23). In addition, in the present study, the correlation between CXCL12 and two well-known cardiovascular risk stratification algorithms, including the Framingham risk score (FRS) and the systematic coronary risk evaluation (SCORE), was evaluated.
2. Methods
2.1. Study Population
About 60 patients were enrolled with RA (30 newly diagnosed and 30 under-treatment) who referred to Imam Reza Hospital, Kermanshah University of Medical Sciences (KUMS), as well as 30 healthy subjects after matching for age and sex between April and October 2022. The diagnosis of RA was conducted by expert rheumatologists based on the classification criteria of the American College of Rheumatology (ACR)/EULAR 2010. The exclusion criteria included participants with any background of autoimmune disease other than RA and chronic diseases (cardiovascular, pulmonary, kidney, liver, etc.), metabolic and infectious diseases, and pregnant women. This study was performed based on the Declaration of Helsinki and conducted with consent from the Ethics Committee of KUMS (IR.KUMS.MED.REC.1401.292) and the entire participants. Demographic information and DMARD dosage in study groups are shown in Table 1.
Table 1.
The Disease Modifying Anti-rheumatic Drug Dosage and the Demographic Information of Groups Study a
| Variables | New Case | On-treatment | Control | P-Value |
|---|---|---|---|---|
| Number | 30 | 30 | 30 | |
| Age (y) | 48.80 ± 13.01 | 49.67 ± 10.51 | 48.10 ± 12.07 | |
| Sex, n | ||||
| Male | 5 | 5 | 5 | |
| Female | 25 | 25 | 25 | |
| TJC | 3.33 ± 3.50 | 0.23 ± 0.97 | < 0.0001 | |
| SJC | 3.20 ± 3.46 | 0.23 ± 0.97 | < 0.0001 | |
| DAS-28 | 3.60 ± 1.16 | 2.33 ± 0.66 | < 0.001 | |
| ESR (mm/h) | 25.76 ± 24.39 | 17.76 ± 10.91 | 0.491 | |
| Positive RF | 18 (60) | 14 (46.6) | ||
| Positive anti-CCP | 25 (83.3) | 13 (43.3) | ||
| MTX b (%) | 0 | 100 | 0 | |
| HCQ c (%) | 0 | 100 | 0 | |
| PSLd (%) | 0 | 100 | 0 | |
| Other DMARDs | 0 | 0 | 0 |
Abbreviation: DMARDs, disease modifying anti-rheumatic drugs.
a Values are expressed as mean ± SEM or No. (%) unless otherwise indicated.
b Methotrexate (7.5 - 25 mg per week).
c Hydroxychloroquin (200 mg per day).
d Prednisolone (5 - 10 mg per day).
2.2. Measurement of the Plasma Levels of CXCL12 and NT-proBNP
The plasma levels of CXCL12 and NT-proBNP were evaluated using enzyme-linked immunosorbent assay (ELISA) (ZellBio GmbH, Germany) [(Cat.NO: ZB-13537C-H9648), (Cat.NO: ZB-11239C-H9648)] after separating plasma from the peripheral blood of each participant according to the manufacturer’s instructions.
2.3. Measurement of FBS and Lipid Profile
After 12 hours of fast, 6mm of peripheral blood samples were collected in ethylene diamine tetra-acetate (EDTA) tubes for assessing plasma glucose (glucose oxidase-peroxidase method) (Biosystems, Barcelona, Spain) and lipid profile (total cholesterol, high-density lipid (HDL), low-density lipid (LDL) cholesterol, and triglyceride) via enzymatic reactions using commercial kits according to manufacturer’s instruction (Biosystem, Barcelona Spain). The results were read by a fully automated 7020 chemistry analyzer (Hitachi, Tokyo, Japan).
2.4. Immunoturbidimetric Assay
ADVIA 1800 Clinical Chemistry System (Siemens, Germany) based on latex-enhanced immunoturbidimetric was used to measure the amount of HS-CRP by pre-treated latex microparticles with the anti-CRP monoclonal antibody. In this test, human CRP agglutinates with latex particles coated with monoclonal-anti-CRP antibody. The precipitate and the concentration of HS-CRP in the plasma sample of each participant were determined turbidimetrically (assay range: 0.16 - 10 mg/L).
2.5. Disease Activity Score-28 and Body Mass Index
The disease activity score was measured by an expert rheumatologist (TJ: Number of tender joints from 28 joints, SJ: Number of swollen joints from 28 joints, global health (GH), erythrocyte sedimentation rate (ESR) using the formula DAS28 = 0.56 + 0.28 (SJ) + 0.70 in (ESR) + 0.014 GH (24).
Body mass index (BMI) was calculated based on the formula weight (in kilograms) divided by the square of height (in meters), which was performed based on standard protocol and the World Health Organization (WHO).
2.6. Calculation of SCORE and Assessment of FRS
2.7. Statistical Analysis
SPSS software version 24.0 (SPSS, Chicago, IL, USA) and GraphPad Prisms ®6.0 (GraphPad Software, La Jolla, California, USA) were used for statistical analysis and graph drawing. The data normality was assessed using the 1-sample Kolmogorov-Smirnov (K-S) test, and a one-way ANOVA test was used to compare the three groups. The relationship between the two variables was examined using the Spearman and Pearson correlation. The P-value showed as statistically significant at the level of < 0.05.
3. Results
3.1. Plasma Concentrations of FBS, Lipids (LDL, HDL, Triglyceride, and Cholesterol), NT-proBNP, HS-CRP, and CXCL12
Table 2 shows the mean plasma concentrations of FBS, LDL, HDL, triglyceride (TG), cholesterol, NT-proBNP, HS-CRP, and CXCL12 in three groups.
Table 2.
The Mean Body Mass Index, Blood Pressure, and Plasma Levels of Fasting Blood Sugar, Triglyceride, Low-Density Lipoprotein, High-Density Lipoprotein, Cholesterol, N-Terminal Pro-B-Type Natriuretic Peptide, High Sensitivity C-Reactive Protein and C-X-C Motif Chemokine Ligand 12 a
| Variables | New Cases (n = 30) | Under-Treatment (n = 30) | Control (n = 30) | P-Value |
|---|---|---|---|---|
| BMI (kg/m2) | 26.78 ± 5.01 | 24.76 ± 4.62 | 25.89 ± 3.69 | 0.223 |
| BPS (mmHg) | 118.33 ± 20.52 | 115.33 ± 13.57 | 114 ± 15.44 | 0.593 |
| BPD (mmHg) | 78 ± 7.14 | 80.66 ± 6.91 | 81 ± 4.02 | 0.191 |
| FBS (mg/dL) | 95.33 ± 16.08 | 91.44 ± 23.32 | 98.96 ± 17.37 | 0.093 |
| HDL (mg/dL) | 42.73 ± 10.67 | 57.86 ± 13.97 | 44.30 ± 8.82 | < 0.001 |
| LDL (mg/dL) | 93.03 ± 19.54 | 102.90 ± 22.76 | 92.03 ± 22.43 | 0.105 |
| TG (mg/dL) | 131.46 ± 59.19 | 112.60 ± 41.18 | 117.06 ± 29.13 | 0.241 |
| Chol (mg/dL) | 169.96 ± 31.41 | 176.36 ± 39.77 | 165.36 ± 25.03 | 0.427 |
| NT-proBNP (pg/mL) | 67.61 ± 12.47 | 61.43 ± 11.99 | 59.60 ± 10.69 | 0.016 |
| HS-CRP (mg/L) | 7.35 ± 6.82 | 3.33 ± 1.95 | 2.23 ± 0.62 | < 0.001 |
| CXCL12 (ng/L) | 331.44 ± 88.97 | 290.70 ± 67.87 | 347.90 ± 235.11 | 0.332 |
| FRS | 9.96 ± 11.02 | 7.20 ± 6.16 | 4.71 ± 6.07 | 0.029 |
| SCORE | 11.53 ± 12.19 | 8.83 ± 6.77 | 6.13 ± 6.60 | 0.078 |
Abbreviations: BMI, body mass index; BPS, systolic blood pressure; BPD, diastolic blood pressure; DAS-28, disease activity score-28; FBS, fasting blood sugar; HDL, high-density lipoprotein; LDL, low-density lipoprotein; TG, triglyceride; Chol, cholesterol; FRS, Framingham risk score; SCORE, systematic coronary risk evaluation; CXCL12, C-X-C motif chemokine ligand 12; NT-proBNP, N-terminal pro-B-type natriuretic peptide; HS-CRP, high sensitivity C-reactive protein.
a Values are expressed as mean ± SEM.
3.2. The Comparison of FBS, Lipid Profile, NT-proBNP, HS-CRP, and CXCL12 Between Three Group
The mean FRS and plasma concentration of HDL, NT-proBNP, and HS-CRP significantly differed between the three groups (P = 0.029, P < 0.001, P = 0.016, P < 0.001). The plasma levels of HS-CRP, NT-proBNP, and FRS value were elevated in newly diagnosed RA patients compared to under-treatment and healthy subjects. On the other hand, the mean plasma concentration of HDL was higher in patients who received DMARD therapy. The mean SCORE, systolic blood pressure (BPS), diastolic blood pressure (BPD), and mean plasma concentration of FBS, LDL, cholesterol, TG, and CXCL12 were not significantly different between the three groups (P = 0.078, P = 0.593, P = 0.191, P = 0.093, P = 0.105, P = 0.427, P = 0.241, P = 0.332, respectively) (Figure 1).
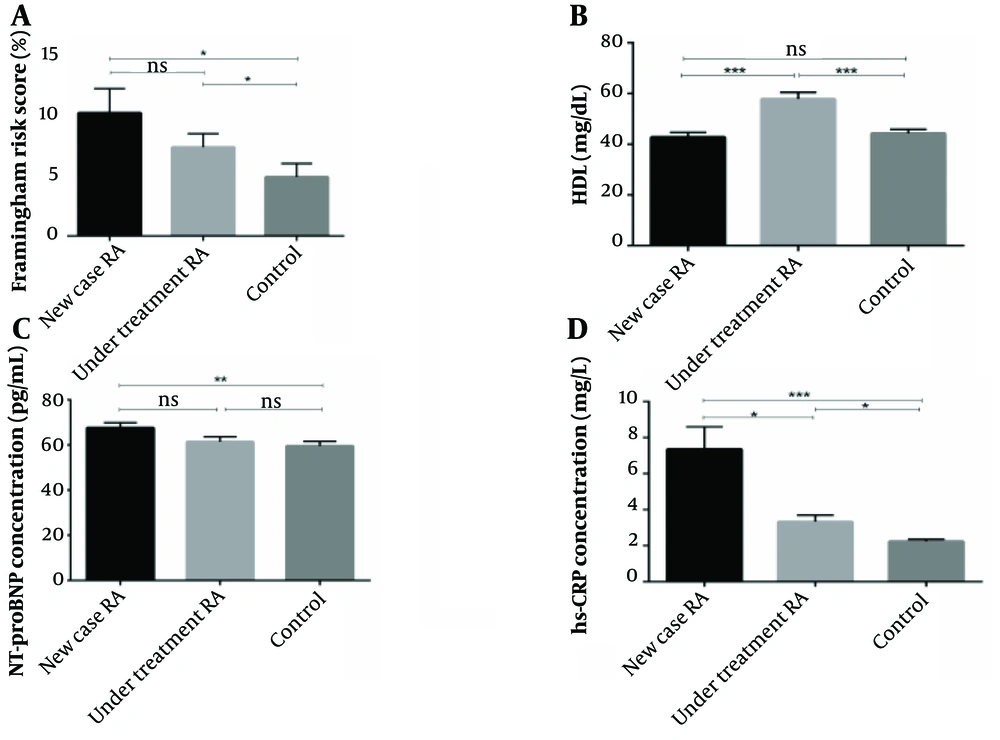
Figure 1.
Comparing the Framingham risk score (FRS) and plasma levels of high-density lipoprotein (HDL), N-terminal pro-B-type natriuretic peptide (NT-proBNP), and high sensitivity C-reactive protein (HS-CRP) among three groups. The plasma level of HDL was quantified by enzymatic reactions using a fully automated 7020 chemistry analyzer. The plasma level of NT-proBNP and HS-CRP was quantified by the sandwich enzyme-linked immunosorbent assay (ELISA) technique and immunoturbidimetric assay, respectively. Also, cardiovascular disease (CVD) risk was evaluated by risk calculators, including FRS and systematic coronary risk evaluation (SCORE). A, the FRS algorithm assessed the CVD risk was remarkably higher in newly diagnosed and under-treatment patients compared with the control group (P = 0.014 and P = 0.035, respectively); B, there was a significant rise of HDL in under-treatment patients compared with newly diagnosed rheumatoid arthritis (RA) and healthy subjects (P < 0.001 and P < 0.001, respectively). However, there was no meaningful difference between the new case and control groups (P = 0.422); C, the plasma level of HS-CRP was remarkably higher in the newly diagnosed and under-treatment RA patients than in healthy subjects (P < 0.001 and P = 0.013, respectively). Also, there was a significant difference between newly diagnosed and under-treatment groups (P = 0.020); D, the plasma level of NT-proBNP was remarkably higher in newly diagnosed compared to healthy subjects (P < 0.01). However, there was no remarkable difference between the under-treatment and control groups (P = 0.246).
3.3. Assessment of the Correlation Among Variables in Patients’ Group (New Case + Under-Treatment)
There was a significant positive correlation between CXCL12 with disease activity score-28 (DAS-28) (P = 0.024, r = 0.293) and also between CXCL12 with NT-proBNP (P < 0.0001, r = 0.570) in the patients’ group together (new case + under-treatment) (Figure 2). However, this correlation was not detected in newly diagnosed or under-treatment patients separately. Other correlations between CXCL12 and different variables, namely BMI, BPS, BPD, FBS, LDL/HDL, TG, cholesterol, and HS-CRP in RA patients, are shown in Table 3, and none of the correlations were significant.
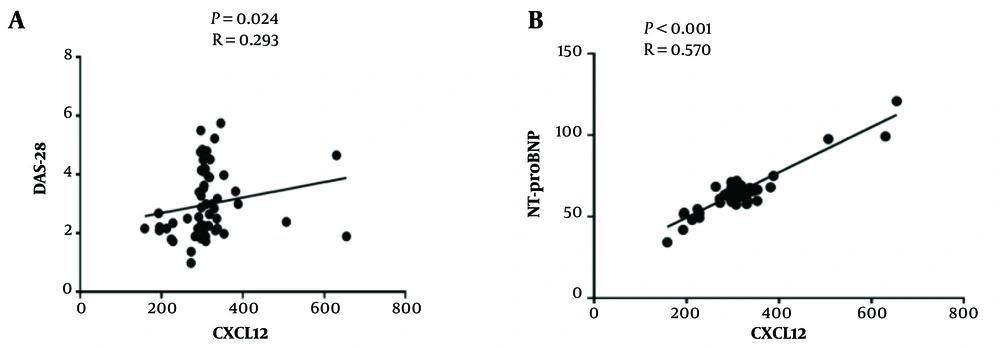
Figure 2.
Association between plasma levels of C-X-C motif chemokine ligand 12 (CXCL12) with disease activity score-28 (DAS-28) and N-terminal pro-B-type natriuretic peptide (NT-proBNP). Correlation analysis was done using Spearman and Pearson correlations. A, there was a significantly positive correlation between CXCL12 with DAS-28 patient groups (P = 0.024, r = 0.293); B, there was a significantly positive correlation between CXCL12 with NT-proBNP (P < 0.0001, r = 0.570) in patient groups.
Table 3.
Correlation Between the Plasma Level of C-X-C Motif Chemokine Ligand 12 with Clinical and Laboratory Parameters in Rheumatoid Arthritis Patients (New Case + Under-Treatment)
| CXCL12 | RA Patients (New Case + Under-Treatment) | |
|---|---|---|
| P | r | |
| BMI | 0.833 | -0.028 |
| BPS | 0.063 | 0.244 |
| BPD | 0.471 | -0.096 |
| FBS | 0.424 | 0.107 |
| HDL | 0.311 | -0.134 |
| LDL | 0.300 | -0.137 |
| TG | 0.462 | 0.098 |
| Chol | 0.239 | -0.156 |
| HS-CRP | 0.086 | 0.225 |
| SCORE | 0.230 | 0.159 |
| FRS | 0.350 | 0.124 |
| DAS-28 | 0.024 | 0.293 |
| NT-proBNP | < 0.0001 | 0.570 |
Abbreviations: BMI, body mass index; BPS, systolic blood pressure; BPD, diastolic blood pressure; DAS-28, disease activity score-28; FBS, fasting blood sugar; HDL, high-density lipoprotein; LDL, low-density lipoprotein; TG, triglyceride; Chol, cholesterol; FRS, Framingham risk score; SCORE, systematic coronary risk evaluation; CXCL12, C-X-C motif chemokine ligand 12; NT-proBNP, N-terminal pro-B-type natriuretic peptide; HS-CRP, high sensitivity C-reactive protein.
4. Discussion
In RA patients, the high occurrence of cardiovascular disorders cannot be adequately explained by traditional risk factors, suggesting that specific mechanisms contribute to the development of these disorders in these patients. Chronic inflammation is a cardinal feature of RA pathogenesis, which also has a principal role in CVD development. In the present study, the correlation between CXCL12, an inflammatory chemokine, and cardiometabolic risk factors (CRFs), cardiac biomarkers, and cardiac algorithms was investigated. In the current study, elevated levels of NT-ProBNP and HS-CRP were detected in RA patients, and plasma levels of CXCL9 showed a positive correlation with DAS-28 and NT-proBNP in RA patients.
In contrast to the previous study, the CXCL12 concentration was not significantly different from healthy subjects, newly identified, and under-treatment RA patients. Similar to existing data, a significant relationship was found between CXCL12 and DAS-28 (P = 0.024, r = 0.293) (17). The disease activity score-28 is one of the most common scores for evaluating RA severity, incorporating CRP or ESR (29). Previous studies have indicated that higher disease activity over time increases the risk of cardiovascular disorders in RA patients (30). C-X-C motif chemokine ligand 12 may contribute to the pathogenesis of RA inflammation by recruiting Th1 and T cells with effector memory phenotypes to the RA synovium (16). Several lines of solid evidence confirmed the importance of CXCL12 in the pathogenesis of cardiovascular disorders (18). C-X-C motif chemokine ligand 12 has an established role in the pathogenesis of RA and CVD, clarifying the importance of CXCL12 in the pathogenesis of CVD in RA patients. Therefore, the correlation of CXCL12 with cardiometabolic risk factors, including plasma glucose and lipid profile, as well as BMI and blood pressure, were evaluated. In the current study, no significant relationship was found between CXCL12 and well-known cardiometabolic risk factors, including plasma sugars and lipids. CVD risk calculators are beneficial tools for CVD risk assessment in general populations, but EULAR appreciates the limitation of current algorithms for CVD risk calculation in RA patients (2, 6). This study assessed the correlation between CXCL12 and well-established CVD risk calculators, including FRS and SCORE. The FRS value was significantly different among the three groups (P = 0.029), which further confirmed an elevated risk of CVD in RA patients. In this study, no significant correlation was found between CXCL12 and the CVD risk algorithm, including SCORE and FRS.
Moreover, the correlation between CXCL12 and two important cardiac biomarkers, HS-CRP and NT-proBNP, was tested to evaluate the possible association between CXCL12 and cardiovascular disorders. In this study, the plasma levels of NT-proBNP and HS-CRP were significantly different among the studied groups and were elevated in RA patients (P = 0.016, P < 0.001). High sensitivity C-reactive protein is a critical indicator of inflammation, which is significantly related to CVD development in RA patients (22, 31). Although a significant correlation was not found between CXCL12 and HS-CRP, there was a strong relationship between CXCL12 plasma levels and NT-ProBNP (P < 0.0001, r = 0.570). N-terminal pro-brain natriuretic peptide is produced by the ventricular myocardium in response to elevated ventricular wall pressure. The NT-proBNP plasma levels are a strong predictor of CVD, heart failure, left ventricular disorder (LVD), and ischemic heart disease (23, 32). Parallel to this study, previous investigations showed that NT-ProBNP levels increase during inflammatory settings (33). To our knowledge, this study is the first investigation documenting a remarkable link between CXCL12 and NT-ProBNP, a well-established cardiac biomarker. C-X-C motif chemokine ligand 12 may be one of the inflammatory mediators with a role in the pathogenesis of RA-associated CVD through its interaction with NT-proBNP.
4.1. Conclusions
Based on the results, there was a significant correlation among the inflammatory mediator, CXCL12, and the well-known cardiac biomarker NT-proBNP.