1. Introduction
Prenatal exposure to psychological and physiological stress disrupts maternal and fetal homeostasis and is increasingly recognized as a contributor to multisystem dysfunction, including hepatic impairment (1, 2). During pregnancy, chronic unpredictable stress (CUS) elicits sustained activation of the hypothalamic-pituitary-adrenal axis, resulting in prolonged glucocorticoid and catecholamine release. These neuroendocrine alterations promote oxidative stress, mitochondrial dysfunction, and inflammatory signaling in hepatic tissue, thereby compromising liver integrity and metabolic regulation (3, 4). Given the liver's central role in maternal metabolism and detoxification, stress-induced hepatic dysfunction during gestation may adversely affect both maternal health and fetal development, underscoring the need for interventions that preserve hepatic function under stress conditions.
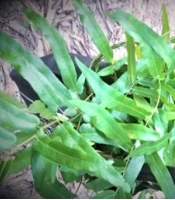
Moringa oleifera Lam., a widely cultivated tropical plant, has garnered considerable scientific interest because of its diverse pharmacological properties, including antioxidant, anti-inflammatory, and cytoprotective activities (5, 6). The leaves of M oleifera are rich in bioactive compounds, such as polyphenols, flavonoids, and isothiocyanates, which have been shown to modulate oxidative and inflammatory pathways by enhancing endogenous antioxidant defenses and suppressing proinflammatory mediators (7, 8). Experimental studies have demonstrated that M oleifera supplementation attenuates neuroendocrine, behavioral, and reproductive disturbances associated with prenatal stress exposure in animal models (9-12). However, despite these findings, its potential role in modulating maternal hepatic dysfunction induced by gestational stress has not been systematically investigated.
The liver is particularly vulnerable to oxidative and inflammatory insults elicited by chronic stress. Increased serum activities of alanine aminotransferase (ALT), aspartate aminotransferase (AST), and alkaline phosphatase (ALP), together with elevated bilirubin concentrations, are widely accepted biochemical indicators of hepatocellular injury and impaired bile metabolism (13). Evaluation of these biomarkers provides a reliable means of assessing hepatic functional integrity and the modulatory effects of antioxidant-based interventions in stress-related liver dysfunction.
Accordingly, the present study aimed to examine the dose-dependent effects of Moringa oleifera leaf extract (MoLE) on hepatic enzyme activities and bilirubin levels in pregnant Wistar rats subjected to CUS. We hypothesized that MoLE supplementation would modulate stress-associated hepatic biochemical alterations in a dose-dependent manner, with higher-dose administration conferring greater stabilization of hepatic function.
2. Methods
2.1. Plant Collection, Identification, and Extraction
Fresh M oleifera leaves were collected in Abakaliki, Nigeria, and authenticated by the Herbarium Unit, Department of Biological Science, Alex Ekwueme Federal University Ndufu-Alike (voucher No. AE-FUNAI UH 504a). The leaves were air-dried for 2 weeks, pulverized, and extracted with methanol using a Soxhlet apparatus (200 g powder/500 mL solvent for 48 hours). The filtrates were combined and concentrated under reduced pressure at 40°C to obtain a dark-green residue, which was refrigerated at 4°C until use. Gas chromatography-mass spectrometry analysis confirmed the presence of phenolic acids, flavonoids, and methylated fatty acid esters (9).
2.2. Experimental Animals and Design
Thirty adult female Wistar rats (150 - 180 g) were procured from the Animal House, AE-FUNAI, and acclimatized for 2 weeks under controlled conditions (25 ± 2°C; 12-hour light/dark cycle), with free access to water and standard rat chow (Vital Feed®, Nigeria).
FEligibility criteria: Female rats were included if they were aged 12–14 weeks, weighed 150–180 g at baseline, had no visible signs of illness or distress, and demonstrated confirmed pregnancy. Exclusion criteria included failure to conceive after two mating attempts, abnormal weight gain during acclimatization, or signs of pre-existing hepatic or systemic disease based on physical examination and baseline behavioral assessment. Pregnancy was confirmed by the presence of spermatozoa in vaginal smears following overnight mating (gestational day [GD] 1).
Sample size determination: Sample size (n = 5 per group) was determined using G*Power software (version 3.1.9.7). Assuming a large effect size (Cohen's f = 0.60) based on preliminary data from our laboratory regarding MoLE effects on hepatic enzymes, with α = 0.05 and power (1-β) = 0.80, the minimum required sample size was calculated as 4 animals per group. To account for potential attrition or technical failures, we included 5 animals per group. This sample size is consistent with prior published studies (9-12). The allocation ratio was 1:1:1:1:1:1.
Randomization and allocation concealment: After confirmation of pregnancy (GD 1), animals were randomly assigned to six groups using a simple random allocation procedure. A random sequence was generated using an online random number generator (Randomizer.org; seed value 20241103). Group assignments were concealed in sequentially numbered, opaque, sealed envelopes that were opened only at the time of treatment initiation (GD 8). The investigator responsible for outcome assessment was blinded to group allocation throughout the experiment, and the statistician was blinded until after the final analysis. The animal caretaker who administered treatments was not involved in biochemical analyses or statistical evaluation.
The 6 experimental groups (n = 5 per group) were as follows:
1) Group I (control): No stress and no treatment.
2) Group II (CUS): Exposure to CUS from GD 8 to 21.
3) Group III (low-dose MoLE): Daily oral gavage with 5 mg/kg MoLE from GD 8 to 21.
4) Group IV (high-dose MoLE): Daily oral gavage with 10 mg/kg MoLE from GD 8 to 21.
5) Group V (low-dose MoLE + CUS): Exposure to CUS with concurrent administration of 5 mg/kg MoLE.
6) Group VI (high-dose MoLE + CUS): Exposure to CUS with concurrent administration of 10 mg/kg MoLE.
2.3. Chronic Unpredictable Stress Paradigm
Dams in the stress-exposed groups underwent a validated CUS protocol (3, 9) involving a randomized schedule of mild stressors from GD 8 to 21. Stressors included wet bedding (1 L sawdust + 300 mL water), cage tilting (45° for 8 hours), overnight food deprivation, restraint stress in ventilated tubes (2 hours × 3), continuous overnight light exposure, sleep disruption on a 6-cm platform surrounded by water for 12 hours, predator exposure to a caged cat for 30 minutes, and social isolation for 12 hours.
Each stressor was applied once daily for 6 - 12 hours in a random and unpredictable sequence, with no repetition of the same stressor on consecutive days.
2.4. Sample Collection and Biochemical Analysis
On GD 21, dams were anesthetized, and blood samples (2 mL) were obtained via retro-orbital puncture into plain tubes. Serum was separated by centrifugation at 3000 rpm for 15 minutes and analyzed for hepatic enzyme activities, including ALP, ALT, and AST, as well as total and direct bilirubin concentrations, using standard colorimetric assay kits (Randox Laboratories Ltd., UK) according to the manufacturer's instructions (14).
2.5. Statistical Analysis
Data were expressed as mean ± standard deviation (SD). Normality of distribution was assessed using the Shapiro–Wilk test (p > 0.05 considered normal), and homogeneity of variances was verified using Levene's test. As normality and homogeneity assumptions were satisfied, one-way analysis of variance (ANOVA) was employed to compare means across the six groups. When the overall ANOVA was significant (P < 0.05), Tukey's Honestly Significant Difference (HSD) post hoc test was applied for pairwise multiple comparisons. This approach controlled for family-wise error rate while identifying specific group differences. All statistical analyses were performed using GraphPad Prism version 10.0 (GraphPad Software Inc., USA). Statistical significance was set at P < 0.05 for all comparisons. Effect sizes (partial η2) were calculated for all ANOVA results to quantify the magnitude of treatment effects.
3. Results
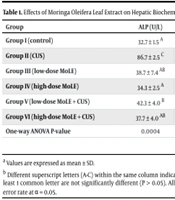
Chronic unpredictable stress produced marked alterations in hepatic biochemical indices in pregnant Wistar rats (Table 1). Animals exposed to CUS alone exhibited significant elevations in serum ALP, ALT, AST, total bilirubin, and direct bilirubin compared with the control group (P < 0.05), indicating stress-associated hepatic dysfunction. Administration of MoLE in nonstressed animals produced dose-dependent effects on hepatic markers. Rats treated with high-dose MoLE (10 mg/kg) showed ALP, AST, total bilirubin, and direct bilirubin levels comparable to control values, although ALT activity was modestly elevated. In contrast, low-dose MoLE (5 mg/kg) produced mild but significant increases in ALP, ALT, and bilirubin concentrations relative to controls. Under CUS conditions, MoLE supplementation modulated stress-induced biochemical disturbances in a dose-dependent manner. High-dose MoLE significantly attenuated elevations in ALP, ALT, AST, and bilirubin compared with the stress-only group, with most parameters approaching control values. Conversely, low-dose MoLE conferred limited protection, as ALP and bilirubin levels remained significantly higher than those in the control and high-dose MoLE-treated stressed animals. Overall, one-way ANOVA revealed significant treatment effects across all measured hepatic parameters (P < 0.05), with large effect sizes: ALP (partial η2 = 0.82), ALT (partial η2 = 0.79), AST (partial η2 = 0.76), total bilirubin (partial η2 = 0.71), and direct bilirubin (partial η2 = 0.58), supporting a dose-related modulatory influence of MoLE on stress-associated hepatic biochemical alterations.
Table 1.
| Group | ALP (U/L) | ALT (U/L) | AST (U/L) | Total Bilirubin (µmol/L) | Direct Bilirubin (µmol/L) |
|---|---|---|---|---|---|
| Group I (control) | 32.7 ± 1.5 A | 7.7 ± 0.6 A | 11.7 ± 1.2 A | 9.5 ± 0.3 A | 2.3 ± 0.2 A |
| Group II (CUS) | 86.7 ± 2.5 C | 22.3 ± 1.5 C | 22.7 ± 2.5 C | 12.5 ± 0.4 C | 2.7 ± 0.2 B |
| Group III (low-dose MoLE) | 38.7 ± 7.4 AB | 11.3 ± 2.3 B | 12.3 ± 1.5 A | 10.7 ± 0.5 AB | 2.6 ± 0.2 B |
| Group IV (high-dose MoLE) | 34.3 ± 2.5 A | 12.7 ± 3.6 B | 12.3 ± 0.6 A | 9.6 ± 1.0 A | 2.3 ± 0.3 A |
| Group V (low-dose MoLE + CUS) | 42.3 ± 4.0 B | 10.7 ± 1.5 AB | 13.0 ± 2.0 AB | 11.3 ± 1.3 B | 2.6 ± 0.3 B |
| Group VI (high-dose MoLE + CUS) | 37.7 ± 4.0 AB | 9.3 ± 0.6 A | 10.0 ± 0.0 A | 10.5 ± 0.8 AB | 2.3 ± 0.2 A |
| One-way ANOVA P-value | 0.0004 | 0.0009 | 0.0011 | 0.0020 | 0.0310 |
a Values are expressed as mean ± SD.
b Different superscript letters (A-C) within the same column indicate significant differences among group means (P < 0.05, Tukey multiple comparison test). Means sharing at least 1 common letter are not significantly different (P > 0.05). All comparisons were adjusted for multiple testing using Tukey's HSD procedure to control the family-wise error rate at α = 0.05.
4. Discussion
Chronic unpredictable stress during pregnancy induced significant alterations in hepatic biochemical markers in Wistar rats, indicating stress-associated hepatic dysfunction. Dams exposed to CUS alone exhibited marked elevations in serum ALP, ALT, AST, and bilirubin compared with those in control animals. These findings are consistent with hepatocellular injury and impaired bile metabolism and align with previous studies demonstrating that gestational stress disrupts hepatic homeostasis through oxidative and inflammatory mechanisms mediated by sustained glucocorticoid release and increased reactive oxygen species (1, 3, 4). These biochemical disturbances support the concept of maternal hepatic vulnerability under chronic stress conditions (2).
Administration of MoLE modulated these stress-induced alterations in a dose-dependent manner. In nonstressed animals, high-dose MoLE (10 mg/kg) maintained hepatic enzyme activities and bilirubin levels comparable to those in controls, suggesting metabolic tolerance and preserved hepatic function at this dose. However, low-dose MoLE (5 mg/kg) was associated with mild increases in transaminases and bilirubin, which may reflect transient metabolic activation or an adaptive hepatic response to phytochemical constituents, consistent with the hormetic effects reported for polyphenol-rich plant extracts (7, 8).
Under CUS conditions, high-dose MoLE substantially attenuated elevations in ALT, AST, ALP, and bilirubin relative to those in stress-only animals, with several parameters approaching control values. In contrast, low-dose MoLE provided limited modulation of stress-induced biochemical disturbances, as several markers remained elevated. These observations underscore the importance of adequate dosing to achieve hepatoprotective effects under stress.
The observed modulatory effects of MoLE are likely attributable to its rich composition of flavonoids, polyphenols, and isothiocyanates, which have been reported to enhance endogenous antioxidant defenses and mitigate inflammatory signaling pathways (5, 6). Although direct measurements of oxidative stress and inflammatory mediators were not performed in this study, previous investigations indicate that these compounds can upregulate enzymes such as superoxide dismutase, catalase, and glutathione peroxidase, thereby restoring redox balance and stabilizing hepatocyte membranes (15). This mechanism provides a plausible explanation for the reduced leakage of hepatic enzymes observed in MoLE-treated stressed animals.
Collectively, these findings indicate that chronic gestational stress disrupts hepatic biochemical homeostasis and that MoLE modulates these alterations in a dose-dependent manner. High-dose MoLE appears to provide a threshold level of phytochemical activity sufficient to mitigate stress-associated oxidative and inflammatory disturbances without inducing metabolic strain.
4.1. Conclusion
Chronic unpredictable stress during gestation was associated with significant disturbances in hepatic biochemical markers in pregnant Wistar rats, reflecting stress-related hepatic dysfunction. Oral administration of MoLE modulated these alterations in a dose-dependent manner, with supplementation at 10 mg/kg providing greater stabilization of hepatic enzyme activities and bilirubin levels than the lower dose. These findings suggest that appropriately dosed M oleifera may modulate stress-associated hepatic biochemical disturbances during pregnancy, potentially through antioxidant and anti-inflammatory pathways. Further studies incorporating direct mechanistic assessments are warranted to clarify these effects and their translational relevance.