1. Background
Today, the success of organizations is facing difficulties and their survival is being compromised by the instability and constant changes in the workplace, which has forced organizations to revise their targets and strategies and stress a prompt response to their customers’ needs (1). Change is a major competitive feature of organizations, including the health system, whose managers are unable to modify the organization according to the objectives of the health system policies unless they implement the change (2-5). The competitive atmosphere among health centers as organizations has provided customers with the freedom of choice between these organizations (6). Health centers that fail to deal with such a transformation miss the opportunity to survive (7). The need for change is therefore increasingly felt in terms of the health system’s challenges, including entering a competitive environment and using market mechanisms for survival. Modification programs are therefore required to be developed to achieve the health system’s objectives and meet the community’s needs and expectations. Organizational agility is recommended for the success and more effective adaptation to the environment as well as improving quality of services, enhancing the satisfaction of personnel and customers, improving the competitive power and reducing the costs and duration of service provision (8). Community health centers’ failure to be agile results in reduced flexibility, reduced quality and speed of services, falling behind competitors and failure to adapt to the changing environment (4).
The factors affecting organizational agility include strategy, technology, infrastructures and human resources. Many studies have considered effective adaptability of personnel the most important factor contributing to organizational agility (9). The workforce agility refers to the flexible, quick and efficient mobility of the workforce in a changing environment (10). Organizational agility improves an organization’s ability to supply high-quality products and services, making up an effective factor in organizational productivity (11). Organizational agility is characterized by four dimensions, namely responsiveness, competitiveness, flexibility and adoptability (12). Studying organizational agility is crucial given the remarkable and admirable successful outcomes of agile public organizations (11, 13). Given the critical mission of health organizations for ensuring and maintaining community health and life, and that everything is rapidly changing in today’s highly competitive world, and that treatment is a sensitive and important issue, health organizations should be agile in responding to these changes as other organizations are, and adapt themselves to environmental changes if necessary and continue to survive (4, 14, 15).
A review of literature on organizational agility suggests that responsiveness and competency, speed of reacting to environmental changes, organizational structure, organizational authority, consistency and harmony, knowledge-based organization, training, technology, occupational engineering, culture (16, 17) and talent management (18) are effective factors in achieving organizational agility. Other factors affecting organizational agility include establishing a flexible organizational structure, outsourcing supply and services, professional development of staff, preparedness for confrontation with environmental changes (2), paying attention to capabilities and enablers associated with agility (4) as well as organizational, human, strategic and technological factors (19). It is worth noting that organizational agility positively and significantly affects workforce agility (3), value-creating capabilities (20) and organizational performance (20, 21). Moreover, organizational agility is significantly associated with organizational intelligence (22, 23), personal and organizational empowerment (24) and organizational health (25).
Furthermore, skilled workforce is a major factor contributing to achieving organizational goals (26). Scholars and researchers are therefore currently increasingly focusing on EI as a skill of employees (27, 28). Salovey and Mayer pioneered in using the term EI as a social intelligence, which is another form of mental intelligence, defining it as a kind of social intelligence that enables individuals to assess emotions and use the results for contemplations and actions (29). Although the concept of EI turned into literature by Salovey and Mayer, it became well-known owing to the efforts made by Goleman. Inspired by the study of Salovey and Mayer, Goleman (1998) presented his theory and used it in the workplace. Goleman defined EI as the ability to recognize one’s own emotions and the others’ to arouse oneself and properly manage one’s feelings when communicating to others (30). According to Goleman (2004), EI can be explained using four components, namely self-awareness, self-management, social awareness and relationship management (31, 32). In recent years, the role of EI of employees has been well addressed in literature as an effective reality in organizational behavior. A review of literature suggests that EI positively and significantly affects many organizational variables such as organizational agility (33-35), workforce agility (36), occupational satisfaction (34), communication skills (31), occupational performance (32) and occupational stress (27). Furthermore, research has been primarily focused on organizational agility in industrial settings rather than in health centers (12). To the best of the authors’ knowledge, the relationship between EI and organizational agility in community health organizations has not been yet investigated.
2. Objectives
The present study was therefore conducted to explain the relationship between the components of EI and organizational agility and to determine whether these relationships are significant in the healthcare network of Kangavar, Iran.
3. Methods
The present correlational study was conducted in 2017 on a statistical population comprising all the personnel and managers of the healthcare network in Kangavar (n = 250). Simple random sampling was used to select the subjects. The sample size was calculated as 148 using the Kerjcie and Morgan Table. The inclusion criteria comprised willingness and giving consent to participate in the study and being able to share information and experiences. The exclusion criteria consisted of unwillingness to participate in the study and failing to completely respond to the questionnaires’ items. To observe ethical principles, the participants signed informed consent forms before completing the questionnaires. Out of the 148 questionnaires distributed, 138 fully completed questionnaires were collected by the researcher and analyzed, suggesting a questionnaire rate of return of 93%. EI was measured using the 22-item EIT developed by Goleman et al., which investigates self-awareness, self-management, social awareness and relationship management on a five-point Likert scale (37). A Cronbach’s alpha of 0.89 confirmed the reliability of the EIT. Cronbach’s alpha is used to assess internal consistency, with α > 0.8 being considered appropriate and α < 0.6 generally poor (38). The 30-item organizational agility scale developed by Spitzer and used in the present study evaluates three dimensions, namely total quality management, human resources management and change management on a five-point Likert scale (39). The reliability of this questionnaire was also confirmed by calculating a Cronbach’s alpha of 0.92. In addition, both the EIT and the organizational agility scale have been used and validated as standard tools in different studies conducted in Iran (21, 37, 40).
The Kolmogorov-Smirnov test was used for determining the distribution normality of the data, the independent t-test for assessing the status of the variables and their components, the Pearson correlation coefficient for determining the relationship between the study variables and the stepwise regression for predicting the variables. The quantitative data were analyzed and the study hypotheses were tested in SPSSIBM-22. Furthermore, the main study hypothesis was tested, the effectiveness of the components of the independent variable, i.e. EI, was investigated on the dependent variable, i.e. organizational agility, and the fit of the structural model was examined in SMART-PLS using structural equations modeling based on the least squares method. The reliability of the measuring model was also assessed using standard factor loading coefficients, Cronbach’s alpha and combined reliability (CR) (41). In the standard factor loading coefficients, all the factor loading coefficients of the questionnaire items were greater than 0.4, suggesting the appropriateness of this criterion. Moreover, Cronbach’s alpha and combined reliability coefficients were higher than the minimum appropriate value of 0.7 for all the variables, confirming the study reliability. Convergent validity is another criterion used for assessing the fit of measuring models. According to Fornell and Larcker, an average variance exctracted (AVE) greater than 0.5 confirms the convergent validity (41), which also applies to the present study latent variables and confirms its convergent validity. The divergent validity of the study model was also confirmed based on the associated criterion for assessing the fit of measuring models. Divergent validity is assessed by comparing the root of the AVE with the correlation coefficient between latent variables. Divergent validity is confirmed in case the root of the AVE for each of the reflective constructs is greater than the correlation of that construct with other constructs of the model (41).
4. Results
Males accounted for 32.1% of the study subjects and female 67.9%. In terms of age, the highest frequency was associated to the 30 - 40 year-olds (45.3%) and the lowest to those over the age of 50 (3.6%). A total of 56.9% of the subjects had a bachelor’s degree, and 1.5% PhD. In terms of job records, 19% had less than one year of experience and 38.7% more than ten years. Moreover, in terms of occupation, the highest frequency of 73% was associated to the healthcare group.
Given the nature of the study items and that the non-parametric Kolmogorov-Smirnov test confirmed the distribution normality of the data; the independent t-test, the Pearson correlation coefficient and the stepwise regression were used. The mean score of EI was found to be 3.400 in the study participants, and that of its components was 2.870 for self-awareness, 3.150 for self-management, 3.400 for social awareness and 3.210 for relationship management. The independent t-test associated a score of at least 3, which is the minimum acceptable average score, to all the components of EI except for self-management, which was statistically significant (P = 0.05). From the employees’ perspective, the status of EI and all its components was therefore acceptable except for self-management.
In addition, the mean score of organizational agility was found to be 3.470, and that of its components including total quality management was 3.290, human resource management was 2.960 and change management was 3.250. The independent t-test showed that the mean score of all the components of organizational agility is higher than the acceptable average value of 3 except for change management, which was statistically significant (P = 0.05). From the participants’ perspective, organizational agility and its components were therefore acceptable except for change management (Table 1). Given that a five-point Likert scale was used in the questionnaires, and the scores were 1: Very low, 2: Low, 3: Moderate, 4: High and 5: Very high, adding up the scores of the options and dividing the sum by the number of options (5), results in a mean score of 3. µ = 3 was therefore set as the criterion for comparing mean values in the independent t-test to enable statistical deductions and compare quantitative variables with the standard value.
Table 1.
The Independent t-Test for Assessing the Status of the Study Variables and Their Components
| Variable | µ | Standard Deviation | Acceptable Level | t | P |
|---|---|---|---|---|---|
| Self-awareness | 3.400 | 0.918 | 3 | 5.117 | 0.001 |
| Self-management | 2.870 | 0.709 | 3 | -2.133 | 0.350 |
| Social awareness | 3.150 | 0.573 | 3 | 3.170 | 0.002 |
| Relationship management | 3.400 | 0.765 | 3 | 6.080 | 0.001 |
| EI | 3.210 | 0.597 | 3 | 4.039 | 0.001 |
| Total quality management | 3.470 | 0.619 | 3 | 8.870 | 0.001 |
| Human resources management | 3.290 | 0.620 | 3 | 5.545 | 0.001 |
| Change management | 2.960 | 0.660 | 3 | 0.454 | -0.750 |
| Organizational agility | 3.250 | 0.536 | 3 | 5.487 | 0.001 |
Furthermore, the results of the Pearson correlation coefficient showed significant relationships between the components of EI and the components of organizational agility. The results also suggested a positive and significant relationship between the two main study variables, i.e. EI and organizational agility, (r = 0.675, P < 0.01) (Table 2).
Table 2.
The Matrix of Correlation Between the Study Variables and Their Components
| SA | SM | SA | RM | TQM | HRM | CM | EI | OA | |
|---|---|---|---|---|---|---|---|---|---|
| SA | 1 | ||||||||
| SM | 0.524a | 1 | |||||||
| SA | 0.326a | 0.421a | 1 | ||||||
| RM | 0.638a | 0.515a | 0.712a | 1 | |||||
| TQM | 0.476a | 0.322a | 0.467a | 0.618a | 1 | ||||
| HRM | 0.533a | 0.312a | 0.521a | 0.590a | 0.864a | 1 | |||
| CM | 0.461a | 0.703a | 0.131a | 0.325a | 0.467a | 0.389a | 1 | ||
| EI | 0.822a | 0.764a | 0.718a | 0.889a | 0.589a | 0.611a | 0.522a | 1 | |
| OA | 0.568a | 0.532a | 0.439a | 0.603a | 0.920a | 0.878a | 0.737a | 0.675a | 1 |
Abbreviations: CM, change management; EI, emotional intelligence; HRM, human resources management; OA, organizational agility; RM, relationship management; SA, self-awareness; SM, self-management; TQM, total quality management.
a P < 0.01.
As shown in Table 3, the results of the stepwise regression showed that the component of self-awareness entered the prediction equation in the first step and explained 32% of variations in organizational agility, as confirmed by F = 64.248 (P < 0.05). The component of self-management was added to the prediction equation in the second step and explained about 28% of variations in organizational agility, as confirmed by F = 53.256 (P < 0.05). In the third step, the component of social awareness was added to the prediction equation and explained about 19% of variations in organizational agility, as confirmed by F = 32.311 (P < 0.05). In the fourth step, the component of relationship management was added to the prediction equation and explained about 36% of variations in organizational agility, as confirmed by F = 77.065 (P < 0.05). It is worth noting that self-awareness, self-management, social awareness and relationship management constituted the predictor variables, and organizational agility was considered the criterion variable.
Table 3.
Predicting Organizational Agility Based on EI and Its Components
| Variable | F | R | R2 | Adj R2 | Beta | Std. Error | t | P |
|---|---|---|---|---|---|---|---|---|
| Self-awareness | 64.248 | 0.568 | 0.322 | 0.317 | 0.568 | 0.442 | 8.015 | 0.001 |
| Self-management | 53.256 | 0.532 | 0.283 | 0.278 | 0.532 | 0.455 | 7.298 | 0.001 |
| Social awareness | 32.311 | 0.439 | 0.187 | 0.187 | 0.439 | 0.483 | 5.684 | 0.001 |
| Relationship Management | 77.065 | 0.603 | 0.359 | 0.359 | 0.603 | 0.429 | 8.779 | 0.001 |
In the following, the fitness criteria of the structural model were investigated. The path coefficient (β) and its significance (t values) are the same as the standardized β in linear regression, which should be investigated in terms of magnitude, sign and significance. Positive path coefficients indicate positive effects of the independent latent variable on the dependent variable, and negative coefficients show negative effects. The magnitude of the path coefficients also shows the significance of the relationship, which complements the magnitude and direction of the path coefficients. With a significance level of 0.5, a t value of -1.96 - 1.96 rejects the study hypothesis, i.e. the independent variable affects the dependent variable. If the t value lies outside this interval, the effectiveness of the independent variable in the dependent variable is confirmed. According to Figure 1, given that the t values of 2.409 for relationship management and 3.168 for self-awareness exceed 1.96, these two independent variables significantly affect organizational agility with a confidence interval of 95%. Moreover, given that the t values of 1.910 for self-management and 1.427 for social awareness lie in the interval of (-1.96 - 1.96), the study hypothesis suggesting the effectiveness of these two independent variables in the dependent variable of organizational agility is rejected. R2 coefficients associated with the endogenous latent (dependent) variables of the model are the second criterion for assessing the fit of the structural model. This criterion shows the percentage of the changes in the endogenous variable that is explained by the exogenous variable, and the values of 0.19, 0.33 and 0.67 are respectively considered poor, moderate and strong values for R2. According to Figure 2, an R2 value that suggests the model’s ability to describe the construct was approximately calculated as 0.469 for the latent endogenous variable, i.e. organizational agility, which confirms the fit of the structural model, and shows that the dimensions of the EIT predict and estimate 46.9% of the variations in organizational agility based on the three standard values. The relationship predictor of Q2 is another criterion for assessing the fit of the structural model and determining the predictive power of the structural model. Q2 values of 0.02, 0.15 and 0.35 associated with an endogenous construct respectively suggest the poor, moderate and strong predictive power of the construct or the associated exogenous constructs. A Q2 value of 0.30 associated with the study model confirmed the predictive power of the structural model associated with the study endogenous construct, and confirmed the fit of the structural model. Moreover, the effect size criterion (f2) is used to determine the significance of the relationship between the latent variables of the model, and to measure the effect size of an exogenous variable on an endogenous variable in structural equations. The three values of 0.02, 0.15, and 0.35 respectively show a poor, moderate and strong effect size. A calculated f2 of 0.82 for the model confirmed the strong effectiveness of EI in organizational agility. Confirming the fit of the general model, including both the measurement and structural models, completes the investigation of the fit of the model. Goodness of fit (GOF) is the only criterion used to investigate the fit of the general model. This index ranges between 0 and 1, and the values of 0.01, 0.25 and 0.36 respectively suggest poor, moderate and strong GOF. Furthermore, a GOF value of 0.3 confirmed the fit of the general model. Given that a factor loading of over 0.4 and a Cronbach’s alpha and combined reliability of over 0.7 are acceptable, the model had to be modified by eliminating the items of each component with a factor loading of below 0.4 so that the combined reliability of the model is increased. In case other values were still below the acceptable level, items with the least factor loading were eliminated until acceptable values were achieved. The following modified model was therefore obtained by eliminating three items:
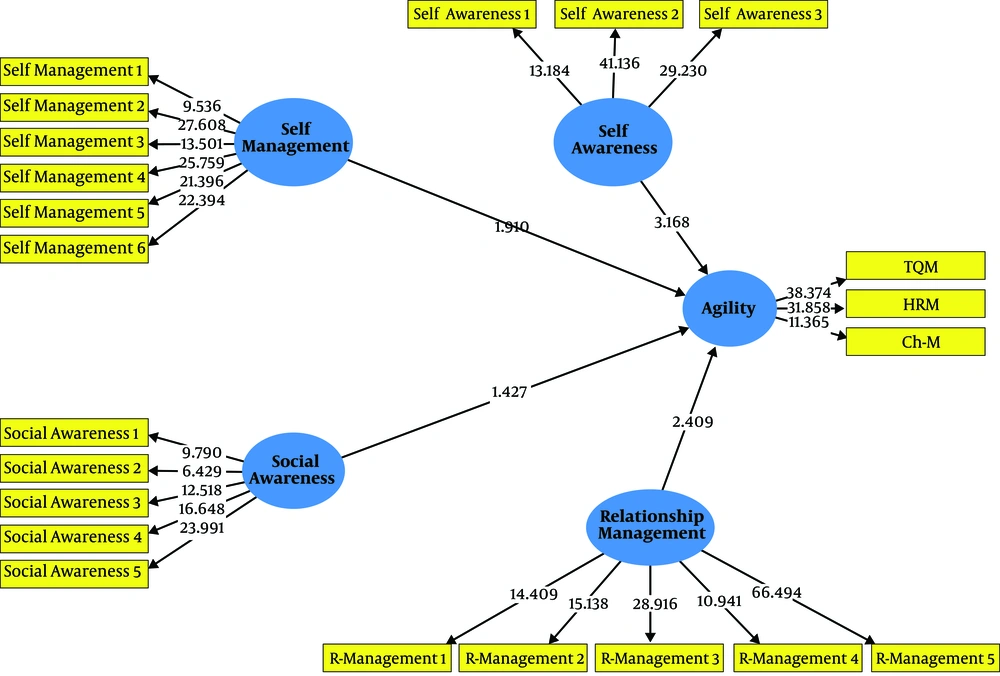
Figure 1.
The modified model of structural equations with significance coefficients of t
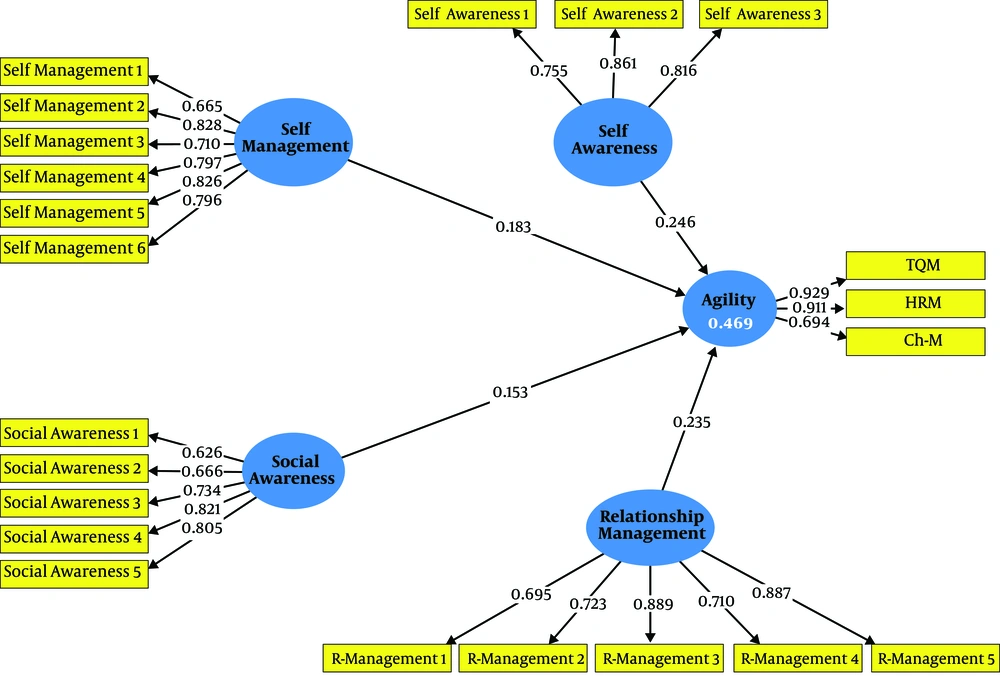
Figure 2.
The modified model of structural equations with standard factor loading coefficients
The coefficient of effectiveness of each variable and the significance of the coefficient were investigated to test the study hypotheses. In SMART-PLS, the value of t shows the significance of the effect of variables on one another. A t value (
Table 4.
The Results of Testing the Study Hypotheses
| Path | Path Coefficient | t | Effect Level | Result |
|---|---|---|---|---|
| Self-awareness → organizational agility | 0.24 | 3.09 | Positive and meaningful | Accept |
| Self-management → organizational agility | 0.18 | 1.80 | Not meaningful | Reject |
| Social awareness → organizational agility | 0.15 | 1.42 | Not meaningful | Reject |
| Relationship management → organizational agility | 0.23 | 2.37 | Positive and meaningful | Accept |
According to Figures 1 and 2 and table 4 and given a t value of 3.09, which is above the significance threshold of 1.96, self-awareness was found to positively and significantly affect organizational agility, and the first hypothesis was therefore confirmed. Moreover, given a t value of 1.8, which is below the significance threshold of 1.96, self-management was found not to significantly affect organizational agility, and the second hypothesis was therefore rejected. In addition, given a t value of 1.42, which is below the significance threshold, social awareness was found not to significantly affect organizational agility, and the third hypothesis was therefore rejected. And finally, given an above-threshold t value of 2.37, relationship management was found to positively and significantly affect organizational agility, and the fourth hypothesis was therefore confirmed.
5. Discussion
The present study was conducted to explain the relationship of the components of EI with organizational agility in the healthcare network of Kangavar. The obtained results showed positive relationships between EI and organizational agility, which is consistent with the studies by Eslampanah Nobari (33), Moshabbaki Esfahani et al. (34), and Hojati (35). In fact, the higher the EI of employees in an organization, the higher the expected agility in that organization. Many researchers have emphasized the importance of the relationship and the significant effect of EI on the majority of organizational variables (27, 28, 31, 32, 34, 36), including organizational agility (33-35). Investing in EI and promoting it among the healthcare network employees can help this organization with the charge of the healthcare promotion of citizens perform with greater agility, and survive and progress in an environment with unpredictable changes, and be able to analyze the current and future situations. Realizing this objective enables the study organization to make correct decisions on the spot about the vague and unknown future, and adjust itself with today’s dynamic environmental changes if required, and respond to the varying needs of patients and their accompaniments. In addition, social awareness, relationship management and self-awareness were found to be the components of EI with respectively the most significant relationship with organizational agility, whereas the relationship of self-management with organizational agility was insignificant. Furthermore, the results showed that the level of self-management as a major component of EI was unacceptable, which is consistent with the study by Kouchakzadeh et al., who found self-management to receive the least score of 18.19 compared to other components of EI (31). The managers and authorities of the healthcare network are therefore strongly recommended to do their best to make plans and hold self-management promotion program. Relationship management and self-awareness were respectively the strongest predictors of changes in organizational agility. Moreover, the EI of the employees of the healthcare network in Kangavar was found to be above average, which is comparable with the EI in other organizations; for instance, nurses working in Alzahra Hospital in Isfahan were reported to have moderate levels of EI (27), while the overall mean score of EI was reported to be desirable in nurses working in the emergency department of hospitals affiliated to Iran University of Medical Sciences (31). The employees of Qazvin Telecom Company were also reported to enjoy a desirable level of EI (3.34) (34). Organizational agility was also found to be higher than average in the healthcare network of Kangavar (3.24), which is comparable with that in other organizations; for instance, the mean level of agility was found to be slightly higher than average (3.2) in hospitals affiliated to Mashhad University of Medical Sciences (5), and to be moderate to high in private and public hospitals of the city of Isfahan, Iran (2). Nasiripour and Akbari also reported relatively desirable levels of agility in the Center for Accidents and Medical Emergencies in the city of Kermanshah, Iran (42). Furthermore, the present study found the level of change management, as a component of organizational agility, to be unacceptable.
5.1. Conclusions
Given that change is a factor that requires agility in organizations (11), paying attention to the speed of changes and the increasing demands of patients and their accompaniments, and managing the changes appear crucial for improving change management in the healthcare network. Similar to other entities, organizations in charge of healthcare should be agile in responding to the varying needs of the community, and be able to adapt themselves to rapid environmental changes in today’s dynamic environment if needed, and respond to patient needs. Given the present findings, the following practical recommendations can help healthcare network authorities with planning and policy-making:
1) Given that EI is an acquired and improvable skill, the authorities of healthcare network in Kangavar are recommended to hold in-service training workshops for employees to help them become more familiarized with EI and its components.
2) Healthcare authorities are recommended to make efforts to promote organizational agility and give proper responses to changes in a timely manner and take advantage of the opportunities obtained from these changes to improve community health, create constructive changes and acquire a sustainable competitive advantage.
Similar to any studies, the present research faced limitations. The present study used questionnaires to explore the context, while some participants might have avoided giving actual responses and provided unreliable data. In addition, the present cross-sectional study was conducted on a limited statistical population of the healthcare network in Kangavar. The findings should therefore be cautiously generalized to other healthcare organizations. To improve the generalizability of the results, further similar studies are recommended to be conducted in other health centers. In addition, the present study explained the interrelationship between two variables of EI and organizational agility irrespective of other effective variables. Future researchers are therefore recommended to explain this relationship while incorporating other effective variables.