
1. Background
Traumatic brain injury (TBI) is a major cause of chronic disability and death, after heart disease and depression worldwide, which is surpassing many diseases in this regard (1).Traumatic brain injury (TBI) is classified into three groups: Mild [Glasgow Coma Scale (GCS) = 13 - 15], moderate (GCS = 9 - 12), and severe (GCS = 3 - 8) (2). After primary damage to the physical tissue of the head, nerve function is impaired. An insult that could be potentially preventable or treatable. If the primary damage is left untreated, it may cause secondary damage to gray and white matter, which may persist for a long time (3). After TBI, several consequences, including cognitive, sensory, motor, behavioral, and hormonal changes, as well as changes in sleep pattern and seizure threshold, may occur (4-7). Thus, a significant financial burden is associated with TBIs due to health care costs and loss of income/productivity (8, 9).
In TBI, apoptosis may lead to neuronal death mediated by N-methyl-D-aspartate (NMDA) glutamate receptors (10-12). One of the aggravating factors of secondary cell damage is the production of nitric oxide (NO) and reactive oxygen species (ROS), which is induced by glutamate by activating NMDA receptors (11-13). To prevent this chronic nerve damage and neurological disorders, researchers have examined various pharmacological strategies for TBI in animal and human models (14). Memantine binds to the Mg2+ region due to its high affinity, blocking the non-competitive open channel and blocking the over activity of NMDA glutamate receptors (13, 15-17). As a non-competitive antagonist, the effect of memantine increases with the addition of glutamate concentration (18).
Various biomarkers, such as neuron-specific enolase (NSE) and S100B, have been used to determine the severity of TBI and its effect on the prognosis of patients as well as clinical evaluation tools, such as sequential organ failure assessment (SOFA) score are used to assess acute morbidity in critically ill patients and to describe their problems in the intensive care unit (ICU), but does not predict the patient’s outcome. However, any functional complication is closely related to mortality (19-22). S100B levels rise immediately and sharply after TBI and are reliable indicators of the severity of the primary damage to the blood-brain barrier. Peak initial concentration reflects a mechanical disturbance in brain tissue (or primary damage). Neuron-specific enolase is a glycolytic enzyme that represents the late event of neuronal differentiation and is useful in quantitative measures of brain damage and also in diagnosis and outcome evaluation of different clinical scenarios such as ischemic stroke, intracerebral hemorrhage, seizures, cardiac arrest, and TBI. Its half-life is about 24 hours (20, 23-26). The APACHE II score is used to predict readmission and mortality in the ICU (27). The Glasgow Outcome Scale Extended (GOSE) is widely used to assess general disability and recovery of a patient after TBI. GOSE 5 - 8 is considered a favorable outcome, and GOSE 1 to 4 is considered an unfavorable outcome (28). In addition, the Rotterdam CT scan classification system is used to predict premature mortality in patients with moderate to severe TBI (29).
2. Objectives
This study aimed to evaluate the benefits of memantine on GCS score, neuronal function improvement, serum NSE levels, and SOFA score in TBI patients with GCS = 6 - 12.
3. Methods
3.1. Experimental
This study is approved under the ethical approval code of IR.MAZUMS.REC. 1399.473. The clinical trial code: IRCT20100107003014N25. Written informed consent was obtained from relatives of patients before enrollment.
3.1.1. Study Design and Setting
A number of 60 eligible adult TBI patients with GCS = 6 - 12 were selected by available sampling method after considering the inclusion criteria in Emam Khomeini Educational Hospital, affiliated with Mazandaran University of Medical Sciences from July 2020 to September 2021. The process of random allocation of patients was done by blocking with random allocation software at the address: https://random-allocationsoftware.software.informer.com/2.0/, and the number of 15 quadruple blocks was determined. The patients were allocated in two groups in these blocks of 4, randomly, to receive the study intervention (Memantine/Placebo) in addition to the standard for TBI according to the guidelines of the Trauma Foundation (30).
Patients in the intervention group (n = 29) received 30 mg of memantine every 12 hours, orally or through a nasogastric tube from the first day of hospitalization for seven days, based on previous human studies, (3, 31, 32), whereas control group (n = 30) received placebo with the similar schedule. This clinical trial was a double-blind study. The patients and the outcome assessor were blinded and did not know about the intervention and placebo groups. Furthermore, the appearance and packaging of the drug and placebo were similar.
Based on their initial GCS, patients were stratified into two subgroups, including GCS 6 - 8 and GCS 9 - 12 (33).
3.1.2. Inclusion/Exclusion Criteria
Traumatic brain injury patients with GCS = 6 - 12 at admission and at least 18 years of age, who were able to receive oral medication were included. Exclusion criteria were concomitant diseases such as uncontrolled diabetes mellitus (BS > 200 mg/dL), acute myocardial infarction in the last 48 hours, ischemic heart disease, acute or chronic kidney and liver disease, autoimmune disorders, and known malignancies.
3.1.3. Assessments
Upon admission, demographic and clinical data such as age, gender, underlying disease, medical history, cause of brain injury, vital signs, and GCS were recorded. Intravenous blood samples were collected from all patients on the first, third, and seventh days after hospitalization. After centrifuging (3,000 rpm for 10 minutes), the serum was isolated and instantly stored at -80°C. Moreover, NSE enzyme serum levels were measured using the human NSE Elisa kit, according to the manufacturer’s instructions. The SOFA score also was calculated. After three months of follow-up, GOSE-90 score was obtained.
3.2. Statistical Analysis
SPSS software version 24 was used to analyze the data. The assumption of having a normal distribution of quantitative variables was performed after conducting Shapiro-Wilk test. The variables were described with percentage, mean, standard deviation (SD), median, and mid-quarter amplitude. Qualitative variables were compared between the two groups by chi-square test or Fisher exact test. Comparison of outcomes was performed separately for each measurement step between the two groups with an independent t-test or its nonparametric equivalent (Mann-Whitney U test). The outcome trend in each group was compared with Friedman test. Also, the trend of changes in outcomes over time between the two groups was compared with the generalized estimating equations (GEE) test. The significance level was less than 0.05.
4. Results
Two hundred and one patients were evaluated for eligibility. Of those, 141 patients were excluded due to GCS being out of the range defined for this study, diabetes mellitus, and other reasons. Sixty patients (nine female) were randomized to receive the memantine or placebo. Finally, 29 and 30 patients completed the trial in the memantine and control groups, respectively (Figure 1). Basic demographics and differences in clinical characteristics between patients in the two groups of this study are shown in Table 1.
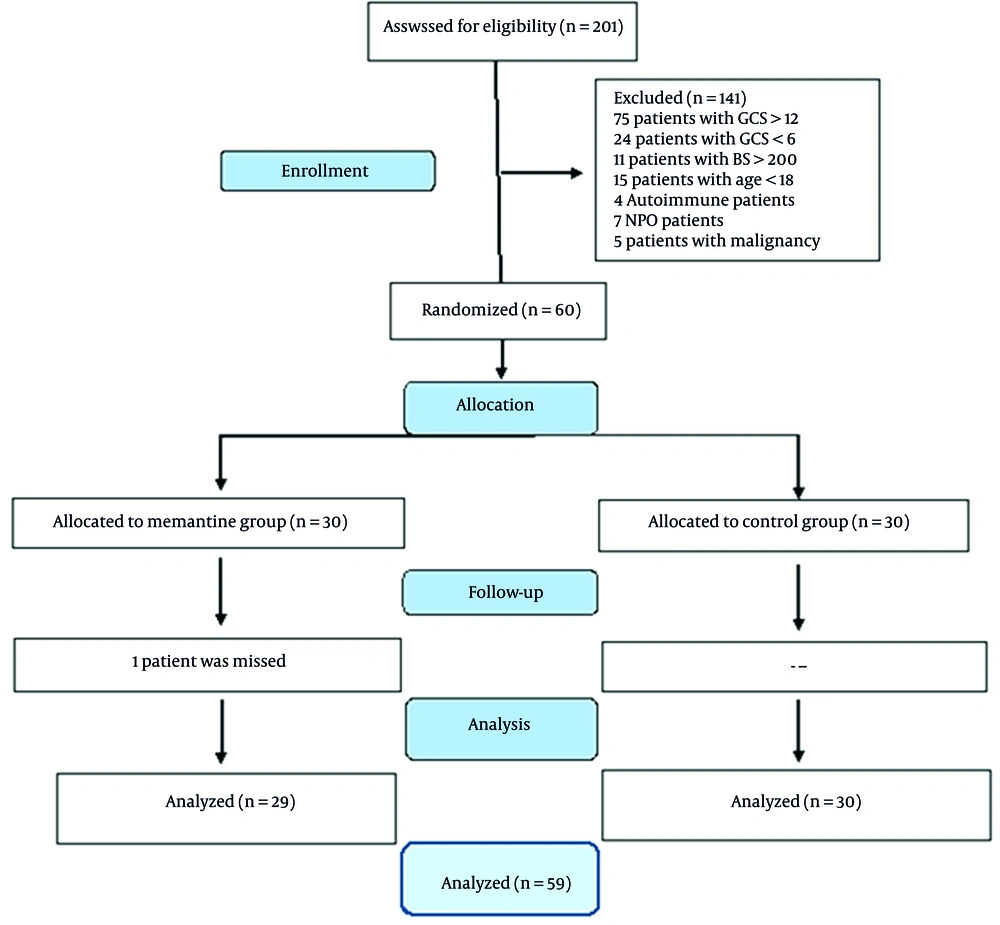
Figure 1.
CONSORT flow diagram
Table 1.
Clinical and Demographic Characteristics of Patients in Memantine and Control Groups a
| Variables | Memantine (n = 29) | Control (n = 30) | P-Value |
|---|---|---|---|
| Gender | 0.73 | ||
| Male | 24 (82.8) | 26 (86.7) | |
| Female | 5 (17.2) | 4 (13.3) | |
| Age (y) | 37 (29 - 64.5) | 44.5 (30.75 - 60.5) | 0.41 |
| Diagnosis | 0.51 | ||
| HT | 10 (34.5) | 8 (26.7) | |
| MT | 19 (65.5) | 22 (73.3) | |
| Mode of ventilation, day 1 | 1.00 | ||
| SIMV | 23 (79.3) | 22 (73.3) | |
| CPAP | 0 (0) | 1 (3.3) | |
| Extubated | 6 (20.7) | 7 (23.3) | |
| Mode of ventilation, day 3 | 1.00 | ||
| SIMV | 18 (62.1) | 18 (60) | |
| CPAP | 2 (6.9) | 2 (6.7) | |
| Extubated | 9 (31) | 10 (33.3) | |
| Mode of ventilation, day 7 | 0.75 | ||
| SIMV | 13 (45) | 16 (53.3) | |
| CPAP | 2 (6.9) | 1 (3.3) | |
| Extubated | 14 (48.3) | 13 (43.3) | |
| GCS. f day 1 | 6 (6 - 8) | 7.5 (6 - 10) | 0.15 |
| GCS day 3 | 7 (6 - 12.5) | 8 (6.75 - 13) | 0.18 |
| GCS day 7 | 8 (6 - 14.25) | 8 (5.25 - 12.75) | 0.45 |
| APACHE II g | 14 (12 - 18.5) | 14 (12 - 16) | 0.83 |
| GOSE- 90h | 6 (1 - 6.5) | 5 (1 - 7) | 0.96 |
| Rotterdam CT score | 3 (2 - 3) | 3 (2 - 4) | 0.46 |
| ICU i stay duration | 9 (6.5 - 23.5) | 10.5 (5 - 22.5) | 0.75 |
| Hospital stay duration | 13 (8 - 28) | 14 (6 - 30.25) | 0.89 |
Abbreviations: IQR, interquartile range; HT, head trauma; MT, multiple trauma; SIMV, synchronized intermittent mandatory ventilation; CPAP, continuous positive airway pressure, GCS, Glasgow Coma Scale; APACHE II, acute physiology and chronic health evaluation; GOSE-90, Glasgow Outcome Scale Extended- 90; ICU, intensive care unit.
a Values are expressed as No. (%) or median (IQR 25 - 75).
4.1. Changes in Serum Neuron-Specific Enolase Levels
The percentage of decrease in the serum NSE levels of the TBI patients with GCS = 6 - 12, between days 1 and 7 was 21% and 12.6% in the memantine and the control groups, respectively. The percentage of changes in the serum NSE levels of the subgroup GCS = 6 - 8, between days 1 and 7 was 19.1% decrease and 8.45% increase in the memantine and the control groups, respectively. The percentage of reduction in the serum NSE levels of the subgroup GCS = 9 - 12 (moderate TBI) between days 1 and 7 was 52.6 % and 24.43 % in the memantine and the control groups, respectively (Table 2 and Figure 2A). Data showed that the percentage of reduction of NSE was higher in subgroup GCS = 9 - 12 compared to subgroup GCS = 6 - 8.
Table 2.
Serum Neuron-Specific Enolase (NSE) Changes on Days 1, 3, and 7 in the Memantine and the Control Groups
| GCS and Days | NSE (ng/mL) | P-Value a | P-Value b | |
|---|---|---|---|---|
| Memantine (Mean ± SD) | Control (Mean ± SD) | |||
| Subgroup GCS = 6 - 8 | 0.67 | |||
| 1 | 5.55 ± 6.3 | 4.14 ± 5.5 | 0.94 | |
| 3 | 5.65 ± 5.8 | 3.56 ± 2.4 | 0.74 | |
| 7 | 4.49 ± 4.4 | 4.49 ± 4.4 | 0.91 | |
| P-value c | 0.94 | 0.55 | ||
| %Change (1 - 7) | 19.1% decrease | 8.45% increase | ||
| Subgroup GCS = 9 - 12 | 0.34 | |||
| 1 | 4.16 ± 4.8 | 2.62 ± 2.4 | 0.69 | |
| 3 | 1.91 ± .9 | 3.99 ± 4.2 | 0.34 | |
| 7 | 1.97 ± 1.0 | 1.98 ± 1.5 | 1.00 | |
| P-value c | 0.60 | 0.16 | ||
| %Change (1 - 7) | 52.6% decrease | 24.43% decrease | ||
| GCS = 6 - 12 | 0.79 | |||
| 1 | 5.29 ± 6.0 | 3.57 ± 4.5 | 0.79 | |
| 3 | 4.96 ± 5.4 | 3.73 ± 3.2 | 0.62 | |
| 7 | 4.18 ± 4.2 | 3.12 ± 2.5 | 0.72 | |
| P-value c | 0.867 | 0.790 | ||
| %Change (1 - 7) | 21% decrease | 12% decrease | ||
Abbreviations: SD, standard deviation; %Change (1 - 7), percentage of changes between days 1 and 7.
a Based on Mann-Whitney U test.
b Based on generalized estimating equation (GEE): Group × time test.
c Based on Fried man test.
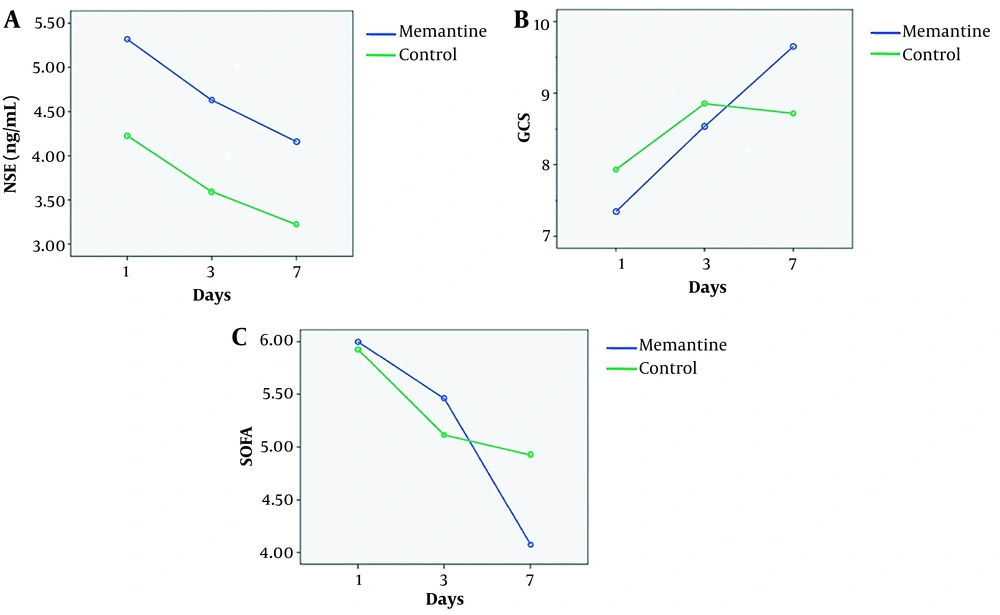
Figure 2.
A, Neuron-specific enolase (NSE) (ng/mL) changes on days 1, 3, and 7 in the memantine and the control groups; B, Glasgow Coma Scale (GCS) changes on days 1, 3, and 7 in the memantine and the control groups; and C, sequential organ failure assessment (SOFA) score changes on days 1, 3, and 7 in the memantine and the control groups.
4.2. Changes in GCS
GEE test in TBI patients with GCS = 6 - 12 revealed a significant improvement in GCS during the seven-day study period in the memantine group compared to the control group (P = 0.007). This improvement was also significant in subgroup GCS = 9 - 12 (P < 0.001) but not significant in subgroup GCS = 6 - 8 (P = 0. 1) (Table 3 and Figure 2B).
Table 3.
Glasgow Coma Scale (GCS) Changes on Days 1, 3, and 7 During Study in the Memantine and the Control groups
| GCS and Days | Memantine GCN (Mean ± SD) | Control GCN (Mean ± SD) | P-Value a | P-Value b |
|---|---|---|---|---|
| Subgroup GCS = 6 - 8 | 0.1 | |||
| 1 | 6.35 ± 0.65 | 6.5 ± 0.79 | 0.55 | |
| 3 | 7.22 ± 2.8 | 7.33 ± 2.4 | 0.62 | |
| 7 | 8.43 ± 3.8 | 7.56 ± 3.1 | 0.60 | |
| P-value c | 0.03 | 0.34 | ||
| Subgroup GCS = 9 - 12 | < 0.001 | |||
| 1 | 11.5 ± 1.22 | 10.75 ± 1.1 | 0.14 | |
| 3 | 13.00 ± 0.0 | 11.92 ± 2.6 | 1.000 | |
| 7 | 14.80 ± 0.4 | 10.80 ± 4.3 | 0.04 | |
| P-value c | 0.05 | 0.46 | ||
| GCS = 6 - 12 | 0.007 | |||
| 1 | 7.41 ± 2.3 | 8.20 ± 2.3 | 0.15 | |
| 3 | 8.25 ± 3.4 | 9.17 ± 3.4 | 0.18 | |
| 7 | 9.60 ± 4.3 | 8.71 ± 3.9 | 0.45 | |
| P-value d | 0.002 | 0.34 | ||
| %Change (1-7) | 29.6% increase | 6.2% increase |
Abbreviations: SD, standard deviation; %Change (1-7), changes percent between days 1 and 7.
a Based on Mann-Whitney U test.
b Based on generalized estimating equation (GEE): Group × time test.
c Based on Wilcoxon test
d Based on Fried man test
4.3. Changes in Sequential Organ Failure Assessment Score
During the seven-day study period, GEE test showed that the decrease of SOFA values in the memantine group was significant, compared to the control group in subgroup GCS = 9 - 12 (P = 0.01), while it was not significant in subgroup GCS = 6 - 8. Moreover, based on Mann-Whitney U test, changes in the mean SOFA values on the 7th day of the study were statistically significant (P = 0.03). The Friedman test compares the intragroup changes in SOFA in subgroups of GCS = 9 - 12 and GCS = 6 - 8, which showed significant improvement during the study in the memantine group (P < 0.001), but not in the control group (P = 0.22). The same was applied in subgroups of GCS = 6 - 8 and GCS = 9 - 12 (Table 4 and Figure 2C).
Table 4.
Sequential Organ Failure Assessment (SOFA) Score Changes on Days 1, 3, and 7 in the Memantine and the Control Groups
| GCS and Days | Memantine SOFA (Mean ± SD) | Control SOFA (Mean ± SD) | P-Value a | P-Value b |
|---|---|---|---|---|
| Subgroup GCS = 6 - 8 | 0.48 | |||
| 1 | 6.08 ± 2.2 | 6.16 ± 1.9 | 0.88 | |
| 3 | 6.04 ± 2.4 | 5.33 ± 1.7 | 0.84 | |
| 7 | 4.66 ± 2.0 | 5.33 ± 2.4 | 0.36 | |
| P-value c | 0.004 | 0.40 | ||
| %Change (1-7) | 23.4% decrease | 13.4% decrease | ||
| Subgroup GCS = 9 - 12 | 0.01 | |||
| 1 | 5.00 ± 1.4 | 5.25 ± 1.3 | 0.77 | |
| 3 | 3.60 ± 1.5 | 4.50 ± 1.7 | 0.33 | |
| 7 | 1.60 ± 0.5 | 4.11 ± 2.2 | 0.03 | |
| P-value c | 0.008 | 0.52 | ||
| %Change (1-7) | 68% decrease | 21.7% decrease | ||
| GCS = 6 - 12 | 0.18 | |||
| 1 | 5.86 ± 2.1 | 5.80 ± 1.7 | 0.98 | |
| 3 | 5.61 ± 2.4 | 4.00 ± 1.8 | 0.81 | |
| 7 | 4.08 ± 2.2 | 4.92 ± 2.4 | 0.2 | |
| P-value c | < 0.001 | 0.22 | ||
| %Change (1-7) | 30.38% decrease | 15.17 decrease |
Abbreviations: SD, standard deviation; %Change (1-7), changes percent between days 1 and 7.
aBased on Mann-Whitney U test.
bBased on generalized estimating equation (GEE): Group × time test.
c Based on Friedman test.
4.4. Outcomes
4.4.1. Primary Outcome
Of TBI patients with GCS = 6 - 12 in the memantine group, 66% survived.
4.4.2. Secondary Outcome
Although GOSE-90 scores obtained after three months of follow-up demonstrated that memantine was useful in these TBI patients, it was not statistically significant.
5. Discussion
To the best of our knowledge, this is the first randomized clinical trial (RCT) evaluating the short-term effects of memantine on serum NSE, GCS, SOFA and GOSE-90 scores in TBI patients with GCS = 6 - 12. We observed a statistically significant increase in GCS score in the memantine group compared with the control group during the seven-day post-TBI study period (Table 3). The percentage of decrease in serum NSE levels in TBI patients was greater in the memantine group than the control group, and in the GCS = 9 - 12 subgroup, it was about twice more compared to GCS = 6 - 8 subgroup (Table 2).
In GCS = 9 - 12 subgroup, a significant decrease in SOFA values was observed during the seven-day study period in the memantine group compared to the control group. Sequential organ failure assessment score analysis showed that there was less reduction in the GCS = 6 - 8 subgroup (Table 4).
As noted, a significant reduction in SOFA values was observed in patients receiving memantine, but the decrease was not significant in serum levels of NSE. In other words, SOFA in patients with TBI was more strongly associated with patients’ recovery rate than NSE. This can be related to variables within the SOFA score calculation formula, such as arterial pressure of oxygen (PaO2), a fraction of inspired oxygen (FiO2), platelet counts, GCS, bilirubin, hypotension, and renal function.
Memantine as an NMDA receptor blocker affects and improves TBI in the following ways: (1) Improves motor function and brain regeneration, learning and memory, cognitive function, tissue reperfusion, space exploration capabilities, and improves symptoms similar to anxiety (34-37); (2) reduces gliosis in the thalamus, neuro-inflammation by inhibition of Ca2+ ion channel, and nerve death and apoptosis (38-41); (3) protects against cognitive deficits (42, 43); (4) prevention of postoperative cognitive dysfunction (POCD) in human (42, 44). In the study by Kim et al. (38), the effects of memantine on thalamic gliosis were investigated in a stroke model of secondary injury. They showed that treatment with memantine reduced gliosis in the thalamus (43, 45). In a rat model of cognitive impairment, Almahozi et al. showed that memantine reduces neuro-inflammation by blocking NMDA receptors by inhibiting the Ca2+ ion channel leading to improved cognitive function (44). In a RCT conducted by Ghaffary et al., it was shown that administration of memantine before cardiac surgery protected patients against POCD and improved cognitive function three months after surgery. Overall, memantine has been shown to be useful in prevention of POCD in humans (42). In the study by Polat et al., the neuroprotective effects of memantine and lacosamide treatment were evaluated in a model of hyperoxia-induced brain injury in premature rats. This study showed that memantine reduced neuronal death and apoptosis in the brains of hyperoxia-induced rats (41, 45). Long et al. examined the effect of methamphetamine (METH) on cognitive and memory impairment. The results of their work showed that pretreatment with memantine reversed METH-induced changes in the expression level of apoptosis-related genes and showed protective effects against cognitive deficits (43). Ma et al. showed that administration of memantine immediately after recurrent mild brain injury resulted in protection against damage-induced changes in oligodendrocyte cell loss and loss of myelin sheath and neurofilament light chain (NF-L). Memantine also improved anxiety-like symptoms (34). Seyedsaadat and Kallmes showed that memantine is safe for treatment of ischemic stroke which improves tissue reperfusion leading to better performance in stroke patients. Continuous use of memantine in the acute and late stages may better improve the motor function and brain regeneration (35). Ji et al. showed that in animals exposed to chronic hypoxia, memantine significantly improves their learning and memory as well as space exploration capabilities (36, 38). In the present study, SOFA was strongly associated with patients’ recovery rates relative to NSE in patients with TBI. Our findings support several previous studies, showing that SOFA scores are generally associated with the severity of brain injury (21, 46, 47). Due to the significance of SOFA (P = 0.01) and GCS (P < 0.001) values, it seems that SOFA score has a performance in predicting patient recovery and consequent mortality. Therefore, it can be easily applied in the emergency ward and it becomes one of the choices for quick guidance of physicians regarding the condition of patients.
5.1. Conclusions
Memantine will most likely be useful in TBI patients, as it was associated with a decrease in serum NSE levels and improvement in GCS, SOFA, and GOSE-90 scores.