1. Background
Traumatic brain injury (TBI) is one of the common causes of long-term disabilities and mortality. Each year, about 50,000 people in the United States alone and 10 million worldwide die due to TBI (1-5). Treatment-related costs in patients with TBI imposes a heavy economic burden on the individual and the society due to poor recovery process, long-term disability, and its higher incidence in young people. Currently, the supportive measures, direct supervision, and surgical interventions are the most basic treatments for patients with TBI, but the therapeutic outcomes following TBI are still poor. Therefore, there is an urgent need to find more effective therapeutic options to promote and improve therapeutic outcomes in these patients.
Brain injury is accompanied by multiple secondary injuries caused by biochemical changes, inflammation, swelling, and ischemic processes, such as intracellular accumulation of potassium and calcium (6, 7), neuroinflammation (8, 9), free radical damage, and excitotoxicity (10), and oxidative stress and apoptosis (11) leading to the higher intensity of the primary injury and secondary hemorrhage. Over the past two decades, the management of TBI has changed with a focus on the prevention and treatment of secondary injuries. Statin or hydroxy-3-methylglutaryl-CoA (HMG-CoA) reductase is an inhibitory enzyme with pleiotropic effects and anti-inflammatory property, which is known for its effect on reducing low-density lipoprotein (LDL) and the improvement of cardiovascular and cerebrovascular diseases. Its anti-inflammatory and anti-apoptotic properties have caused it to receive attention as an interesting medicine that may be useful for the recovery and reduction of secondary hemorrhage in TBI (7, 12-14). The results of animal studies have revealed the association between the use of atorvastatin and the reduction of cerebral edema (12, 15), reduction of parenchymal hemorrhage, improvement of cerebral blood flow, improvement of neurological outcomes, and further maintenance of neurocognitive function (16-18). The use of statins, such as atorvastatin, rosuvastatin, and simvastatin at a daily dose of 20 mg in people with trauma has been reported in several safe clinical trials (19-21). Pre-TBI use of atorvastatin in the elderly caused a reduction in the mortality rate and improved the functional outcomes in this group of patients (22). Despite these promising results, they were slowly transferred to and used in the human populations, and there is still a significant scientific and experimental lack of knowledge in this regard.
The initial studies conducted on statin effectiveness in the human population have been mainly retrospective. In this research, we aimed to prospectively study the statin effects on a human population. While most of the previous clinical studies investigated the statin effects on patients with TBI in western countries, in this study, we investigated an Asian population. The response to treatment in Asian patients may be different from other races. As the results of a meta-analysis of 20 western and Asian clinical trials showed, Asians needed lower doses of statins compared to western populations in the treatment of coronary atherosclerosis (23). Hence, in this research, we focused on the patients with TBI.
2. Objectives
This study aimed to evaluate the effect of atorvastatin administration on the outcomes of patients with TBI.
3. Methods
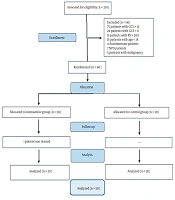
This study was a double-blinded clinical trial conducted from February 2020 to April 2021 in Golestan Hospital of Ahvaz, Iran. The study was approved by the Anesthesiology and Pain Research Center of Ahvaz Jundishapur University of Medical Sciences (ethical code: PAIN-9926 from). Of the 70 patients assessed for eligibility, 60 patients with TBI in the age group of 18 - 75 years who met the inclusion criteria were enrolled in the study and randomly assigned into two equal groups of atorvastatin (n = 30) and control (n = 30). Figure 1 shows the CONSORT flow diagram.
.")
Figure 1.
Seventy subjects were registered in the study, of whom 60 met the inclusion criteria and consented to participate. Patients were divided into two groups (n = 30 in each).
In this research, the patients did not know whether they were receiving a placebo or atorvastatin. The person prescribing the drug and filling out the questionnaires was unaware of the intervention type and the type of drug injected to patients. A nurse who was blind to the study examined the outcomes measures, including Glasgow Coma Scale (GCS), Glasgow Outcome Scale (GOS), and Disability Rating Scale (DRS) (24).
3.1. Inclusion Criteria
Inclusion criteria were as follows: (1) traumatic intracranial hemorrhage with GCS score of 5 - 14 [including moderate (GCS = 9 - 13) and severe (GCS = 5 - 8) TBI based on GCS score] who had brain contusions of 25 - 30 cc volume established by initial brain computed tomography (CT); (2) referring to hospital in < 10 hours from injury time.
3.2. Exclusion Criteria
Exclusion criteria were as follows: (1) GCS score = 3 and 4; (2) grade IV in the initial brain CT-scan or surgically removed brain lesions; (3) spinal Cord Injury (SCI); (4) history of kidney or liver disease; (5) creatinine > 2.5 mg/dL or patients on dialysis; (6) history of brain tumor, stroke, infection, and craniotomy; (7) pregnant and lactating women, patients with systolic blood pressure > 90 mm Hg, history of anticoagulants [e.g., aspirin, warfarin, or low-molecular-weight heparin (LMWH)] within 7 days before hospitalization; and (8) patients with contraindications to receiving oral medication.
3.3. Randomization
Patients were selected using a convenience sampling method and then randomly assigned into an intervention group (atorvastatin recipient) and a control group (placebo recipient) through the random number table by assigning the even-numbered subjects to the intervention group and odd-numbered subjects to the control.
3.4. Calculation of Sample Size
The sample size was calculated by considering the sample size formula, according to the previous study (25). For a 95% confidence interval (CI), the desired power of 80% for detection of 5% difference between primary outcomes measures including the GCS, GOS, and DRS with α = 0.05 and β = 0.2, the minimum sample size was calculated to be 30 for each group. To recompense for non-evaluable patients and those being lost to follow-up, we included a total number of 70 patients (35 in each study group).
3.5. Intervention
For the intervention group, oral atorvastatin with a daily dose of 20 mg in the morning was used (atorvastatin 20 mg tablets, RAHA Pharmaceutical Co., Isfahan, Iran). The control group was administered the same amount of placebo for 10 days. The primary outcomes were changes in the level of consciousness and the functional recovery rate in patients measured by GCS, GOS, and DRS in the third follow-up month. Secondary outcomes were the length of hospital of stay, the length of intensive care unit (ICU) stay, and mortality rate. Injury Severity Score (ISS) and acute physiology and chronic health evaluation (APACHE) were recorded at admission.
3.6. Statistical Analysis
After collecting the statistical data, SPSS software version 22.0 was used to compare the results. The qualitative variables and expected frequencies were compared using the chi-square test. To compare quantitative variables, the independent two-sample t-test, Mann-Whitney, and chi-squared test were used depending on the normality of the data.
4. Results
This double-blinded randomized clinical trial study was performed to evaluate the effect of atorvastatin administration on the outcomes of patients with moderate to severe TBI admitted to the ICU of Golestan Hospital of Ahvaz. The demographic data of both groups can be seen in Table 1. According to the obtained results, the normality of the variables was measured using the Kolmogorov-Smirnov test. For all variables, a significance level above 0.05 was obtained. There was no significant difference between the two groups concerning the patients’ demographic data (e.g., age, gender, weight, ISS, and APACHE II) (P > 0.05).
Table 1.Patients’ Demographic Data in Both Study Groups a
| Variables | Atrovastatin Group (30) | Control Group (30) | P-Value |
|---|---|---|---|
| Age | 38.26 ± 14.774 | 40.63 ± 19.094 | 0.100 |
| Weight | 73.33 ± 2.115 | 68.46 ± 2.662 | 0.219 |
| Gendermale/female (N) | 16/14 | 15/15 | 0.65 |
| ISS | 36.88 ± 12.77 | 34.76 ± 11.85 | 0.65 |
| APACHE II | 28.56 ± 9.82 | 29.77 ± 10.41 | 0.29 |
Abbreviations: ISS, injury severity score; APACHE, acute physiology and chronic health evaluation.
a Values are expressed as mean ± SD unless otherwise indicated.
Changes in the level of consciousness are shown in Table 2 based on the patients’ GCS scores in both groups. As shown in Table 2, there was a significant difference between the two groups in terms of the increased level of GCS at 2 months (13.03 ± 4.097 vs. 11.60 ± 3.27; P = 0.002) and 3 months (13.06 ± 4.093 vs. 11.66 ± 3.294; P < 0.001) post- intervention (P < 0.05).
| Times | Atrovastatin Group (30) | Control Group (30) | P-Value |
|---|---|---|---|
| Prior to intervention | 8.56 ± 3.244 | 8.3 ± 3.108 | 0.919 |
| 5 days post-intervention | 10.13 ± 3.857 | 9.86 ± 2.956 | 0.258 |
| 10 days post-intervention | 11.90 ± 4.062 | 11.10 ± 3.241 | 0.310 |
| 1 month post-intervention | 12.86 ± 4.133 | 11.46 ± 3.350 | 0.612 |
| 2 months post-intervention | 13.03 ± 4.097 | 11.60 ± 3.27 | 0.002 c |
| 3 months post-intervention | 13.06 ± 4.093 | 11.66 ± 3.294 | < 0.001 c |
a Values are expressed as mean ± SD.
b The statistical test used was the t-test.
c Significant.
The functional recovery rate in patients was measured in both groups based on GOS and DRS criteria. Evaluation of the differences between mean DRS scores in patients with TBI in both intervention and control groups revealed a significant difference between the two groups in terms of the increased DRS at 2 months (7.63 ± 7.997 vs. 9.00 ± 6.340; P < 0.001) and 3 months (6.80 ± 8.100 vs. 8.56 ± 6.420; P =0.001) post-intervention, while a significant difference was observed between the two groups in terms of the increased GOS at 10 days (3.50 ± 1.008 vs. 3.60 ± 0.563 P = 0.004), 1 month (3.76 ± 1.006 vs. 3.80 ± 0.805; P < 0.001), 2 months (4.03 ± 1.129 vs. 3.83 ± 0.791; P < 0.001), and 3 months (4.13 ± 1.116 vs. 3.90 ± 0.844; P = 0.001) post-intervention (P < 0.05). The results of this comparison are displayed in Tables 3 and 4.
| Times | Atrovastatin Group (30) | Control Group (30) | P-Value |
|---|---|---|---|
| Prior to intervention | 17.93 ± 6.296 | 16.66 ± 4.482 | 0.201 |
| 5 days post-intervention | 14.86 ± 6.693 | 12.63 ± 5.061 | 0.405 |
| 10 days post-intervention | 11.90 ± 7.475 | 11.10 ± 5.040 | 0.133 |
| 1 month post-intervention | 9.46 ± 8.02 | 9.83 ± 5.931 | 0.167 |
| 2 months post-intervention | 7.63 ± 7.997 | 9.00 ± 6.340 | < 0.001 c |
| 3 months post-intervention | 6.80 ± 8.100 | 8.56 ± 6.420 | 0.001 c |
a Values are expressed as mean ± SD.
b The statistical test used was the t-test.
c Significant.
| Time | Atrovastatin Group (30) | Control Group (30) | P-Value |
|---|---|---|---|
| Prior to intervention | 2.86 ± 0.776 | 3.50 ± 1.479 | 0.538 |
| 5 days post-intervention | 3.23 ± 0.891 | 3.46 ± 0.571 | 0.132 |
| 10 days post-intervention | 3.50 ± 1.008 | 3.60 ± 0.563 | 0.004 c |
| 1 month post-intervention | 3.76 ± 1.006 | 3.80 ± 0.805 | < 0.001 c |
| 2 months post-intervention | 4.03 ± 1.129 | 3.83 ± 0.791 | < 0.001 c |
| 3 months post-intervention | 4.13 ± 1.116 | 3.90 ± 0.844 | 0.001 c |
a Values are expressed as mean ± SD.
b The statistical test used was the t-test.
c Significant.
The results of secondary outcomes of patients in both groups in terms of the length of ICU stay, the length of hospital stay, and mortality rate are shown in Table 5. Significant differences were seen between patients in terms of the length of ICU stay (P = 0.006) and the length of hospital stay (P < 0.0001) (Table 5).
Table 5.Comparison of Secondary Outcomes between the Groups a
Abbreviation: ICU, intensive care unit.
a Values are expressed as mean ± SD.
b Significant.
5. Discussion
The main aim of the present study was to evaluate the effect of atorvastatin administration on the outcomes of patients with TBI. Patients in the intervention and control groups, respectively, received atorvastatin and the same amount of placebo with a daily dose of 20 mg for 10 days.
The results of our study showed that atorvastatin administration improves the level of consciousness and the functional recovery rate in patients. According to the obtained results, patients receiving atorvastatin showed a higher increase in the level of consciousness and the functional recovery rate, especially 2 - 3 months after the intervention, indicating the positive effect of this medicine on brain function after trauma. All the studied indices (GOS, DRS, and GCS) showed statistically significant differences between patients in the intervention and control groups except for the demographic variable.
Statins are medicines that lower cholesterol by inhibiting the HMG-CoA reductase and are widely used in the treatment of dyslipidemia and hypercholesterolemia (26). Various research studies have shown that despite their useful effects on the reduction of blood cholesterol, statines have some anti-oxidative, anti-inflammatory, and neuroprotective effects in some pathological conditions (27).
In the study by Farzanegan et al. in Tehran, to evaluate the atorvastatin effects on the brain contusion volume and the functional outcomes of patients with moderate to severe TBI, 65 patients were randomly assigned into two groups. The intervention group received atorvastatin with a daily dose of 20 mg. The control group was administered the same amount of placebo for 10 days. The functional outcomes, including magnetic resonance spectroscopy (MRS), GOS, and DRS scores, were reported to be significantly better in the atorvastatin-receiving group after 3 months. Finally, they concluded that atorvastatin was accompanied by a significant improvement in the functional outcomes within 3 months post-moderate to severe TBI (25). The results of our research are in agreement with the above mentioned study.
In a similar study in China, Cheng et al. evaluated the effect of atorvastatin on cerebral vasospasm (CVS) and the early complications of brain injury that cause disability or mortality in patients with aneurysmal subarachnoid hemorrhage (SAH). The results of their study reported the reduced brain edema, increased neurological scores, and improved CVS in patients receiving atorvastatin (28), which were in agreement with the present study.
In an animal study in the US on female rats with induced TBI, Qu et al. investigated the effect of atorvastatin administration on the function improvement. According to the obtained results, the restoration of spatial memory was significantly promoted in the atorvastatin group, but the sensorimotor functional deficits did not reduce. Moreover, atorvastatin therapy in TBI increased neuronal survival and prevented the loss of neuronal processes of damaged neurons. They stated that the protective effect of atorvastatin on the damaged neurons may be affected by the increased density of vessels in the lesion boundary zone and the hippocampus (29), supporting the results of the present study.
Sanchez-Aguilar et al. found that despite not affecting other inflammatory cytokines, such as IL-1β, IL-6, and IL-10, the statins administration is accompanied by the reduction of tumor necrosis factor-α (TNF- α) and disability. This study supports the fact that statins may be useful in reducing the brain injuries induced by severe TBI in humans (30).
In another study in the US, Orlando et al. investigated the effect of statin discontinuation on mortality in adult patients with TBI in three trauma centers using statin before the injury. According to the obtained results, in the discontinuation group, there was a greater proportion of patients with moderate to severe brain injury; more patients were intubated in the emergency department (ED); and more patients were transferred to the ICU or operating room. Finally, they found no significant difference in the mortality rate between the elderly patients with a history of statin use, who discontinued the medicine post-injury, and the patients who continued to use statin therapy. However, they did not study whether statin discontinuation could affect the injury severity or the occurrence of the post-injury deleterious effects after hospital discharge or not (31).
In a recent study by Neilson et al. (2016), it was found that the use of statins in patients with severe TBI was not accompanied by functional recovery. The results of their study showed that despite evidence on the usefulness of statin in TBI, their study on an Asian population did not support this evidence, and no significant improvement was observed in the statin group. They suggested further research be conducted to investigate the mechanism and effect of statin in TBI (32).
Soltani et al. demonstrated that atorvastatin reduced the rate of inflammatory factors in TBI patients and improved GCS in TBI patients (33).
The inconsistency of the results of the three above studies with the results of the present research and other related studies may be due to the difference in the amount or number of days of drug administration, the difference in races and different populations studied or using different members of the statins family by patients. Considering these differences and the scant number of the studies conducted in this regard, further investigation of the effect of statins on the brain function post-TBI seems necessary.
5.1. Conclusion
According to the obtained results, atorvastatin administration significantly increased the level of consciousness (GCS) and functional recovery (DRS) within 2 - 3 months post-intervention and improved recovery and ability (GOS) since the tenth day after the study (P < 0.05) compared with the control group, indicating the positive effect of atorvastatin in improving the brain and physical function in patients after moderate and severe TBI.
5.2. Limitations
Among the limitations of this research, we can refer to the small sample size and difficulty in following up patients after discharge for several months. Excluding patients who were on antiplatelet and anticoagulation medications means a very selective group of patients. Therefore, the results cannot be generalized to all TBI patients. This is one of the major limitations.