
1. Background
Unhealthy eating habits among adolescents have become a significant public health concern worldwide, contributing to the increasing prevalence of obesity, diabetes, and other non-communicable diseases (NCDs) (1). According to the World Health Organization, over 340 million children and adolescents globally are classified as overweight or obese, largely due to poor dietary choices that include high consumption of fast food, sugary drinks, and processed snacks (2). Adolescence is a critical stage for establishing lifelong eating patterns; however, various external influences — such as peer pressure, widespread marketing practices, and the accessibility of unhealthy food options — often drive young people towards poor dietary choices (3). It is essential to tackle these trends to prevent long-term health complications and alleviate the burden of NCDs (4, 5).
In Thailand, the food consumption behaviors of adolescents have been significantly influenced by economic and societal transformations, modernization, and technological advancements (6). Urbanization and increased exposure to media have led to higher availability and consumption of processed and convenience foods (7). According to the Thai Health Promotion Foundation (8), approximately 39.3% of adolescents consume fast food more than three times a week, and 19.1% of Thai adolescents aged 11 - 15 are classified as overweight, with 6.8% identified as obese. Poor eating habits, such as skipping breakfast, overindulging in sugary snacks, and favoring fried or high-fat foods, have been recognized as key contributors to these concerning trends (9).
One significant consequence of inadequate nutrition is the rise in overweight and obesity among adolescents worldwide (10). Overweight high school students face an elevated risk of developing chronic conditions such as type 2 diabetes, hypertension, and cardiovascular diseases later in life (11, 12). Moreover, poor dietary habits can lead to deficiencies in essential nutrients like iron and calcium, resulting in issues such as anemia and weakened bone health (13). Beyond physical implications, poor nutrition is also associated with mental health challenges, including increased stress, anxiety, and diminished academic performance (14).
While existing research has investigated adolescent food consumption habits, there is a limited understanding of the complex factors influencing these behaviors, particularly in Thailand. Most studies have tended to focus on dietary habits in a broad sense, without addressing the interplay of predisposing factors (such as knowledge and attitudes) (15), enabling factors (including accessibility and readiness) (16, 17), and reinforcing factors (like peer and media influences) (18-20). This gap in research underscores the need for a thorough examination of how these factors affect food consumption behaviors among Thai adolescents, aiming to inform more targeted and effective interventions.
This study focuses on senior high school students in Samut Songkhram province, a region undergoing significant shifts in adolescent health behaviors resulting from socio-economic changes. By exploring the roles of knowledge, attitudes, accessibility, and external influences such as media and peer interactions, this research aims to comprehensively understand the factors that determine food consumption behavior. Identifying these elements can assist educators, policymakers, and health professionals in developing effective strategies to promote healthier eating habits. The findings from this research intend to contribute to evidence-based interventions that tackle adolescent nutritional challenges in Thailand.
2. Objectives
The present study aims to achieve three primary objectives: Assessing the levels of predisposing, enabling, and reinforcing factors that influence food consumption behaviors among senior high school students, evaluating the current food consumption patterns of these students and analyzing the relationships between these factors and their food consumption behaviors.
3. Methods
3.1. Study Design, Setting, and Participants
This study employed a cross-sectional survey design to investigate the factors influencing food consumption behaviors among senior high school students in the Mueng district of Samut Songkhram province. A structured questionnaire was developed to collect data on predisposing, enabling, and reinforcing factors, in addition to food consumption practices. The research was conducted in two public and two private senior high schools within the Mueng district of Samut Songkhram province, Thailand. As of January 2024, the student population comprised 2,134 senior high school students. Utilizing Krejcie and Morgan's formula (21), a sample size of 326 students was determined, ensuring a 95% confidence level with a margin of error of 5%. Quota sampling was employed to ensure balanced representation across various grades (grade 10 - 12). The inclusion criteria for participants were as follows: Senior high school students (both male and female) aged 16 - 18 years, capable of effectively communicating in Thai, and willing to participate with informed consent. Students with serious illnesses that impeded participation, as well as those who transferred to another school during the data collection period, were excluded from this study.
3.2. Research Instruments
3.2.1. Knowledge of Consumption
This research enhanced our understanding of consumption through a literature review, resulting in a 12-item multiple-choice scale, where responses were coded as 0 (incorrect) and 1 (correct). Scores ranged from 0 to 12, categorizing knowledge as follows: 0 - 7 (low), 8 - 9 (moderate), and 10 - 12 (high). The questionnaire's validity was established through content validation by a panel of three experts in nutrition, public health, and behavioral science, ensuring coverage of essential food consumption knowledge. A pilot study with high school students assessed the scale's construct validity, confirming its effectiveness in measuring knowledge of food consumption behavior among adolescents. The scale's reliability, measured by Cronbach's alpha, was 0.92.
3.2.2. Attitudes toward Consumption
In this study, we developed and validated an attitude scale designed to quantitatively assess individual attitudes, grounded in a comprehensive literature review. The scale consists of 18 distinct items, each rated on a 3-point scale (high = 3, moderate = 2, low = 1), resulting in total scores ranging from 18 to 54. These scores classify attitudes into three categories: 18 - 30 (low), 31 - 42 (moderate), and 43 - 54 (high). The validity of the questionnaire was confirmed through content validation by three experts. A pilot study with high school students established its construct validity for assessing attitudes toward consumption among adolescents. The scale's reliability, measured by Cronbach's alpha, was found to be 0.90.
3.2.3. Accessibility and Readiness of Food Consumption Scale
In this research, we developed a food consumption scale based on a literature review featuring 5 items rated on a 3-point scale (high = 3, moderate = 2, low = 1). Total scores range from 5 to 15, categorized as follows: 5 - 8 (extremely low), 9 - 12 (moderate), and 13 - 15 (high) accessibility and readiness. The questionnaire's validity was verified through content validation conducted by three specialists. A pilot study involving high school students established its construct validity for evaluating the accessibility and readiness of food consumption among adolescents. The scale's reliability, measured by Cronbach's alpha, is 0.89.
3.2.4. Influence from Peers and Media Scale
We developed a consumption scale through an extensive literature review, resulting in 11 items rated on a 3-point scale: High (3), moderate (2), and low (1). The scale includes 6 items assessing influence from peers and 5 items evaluating influence from media. According to Bloom (22), the mean scores divided the levels of influence into three ranges: Low (15 - 59), moderate (60 - 79), and high (80 - 100), with higher scores indicating greater influence from friends and media. In this study, the validity of the questionnaire was confirmed through content validation performed by three specialists. A pilot study involving high school students established its construct validity for assessing the influence of friends and media on adolescents. The Cronbach’s alpha for the influence from friends and media questionnaire was 0.80.
3.2.5. Food Consumption Behavior
In this study, we created a scale to assess food consumption behavior based on a literature review, resulting in 19 items rated on a 3-point scale: Always (3), sometimes (2), and never (1). Total scores range from 19 to 57, and behavior is categorized as follows: 19 - 31 indicates extremely low accessibility, 32 - 44 indicates moderate accessibility, and 45 - 57 indicates high consumption behavior. In this study, the validity of the questionnaire was established through content validation conducted by three specialists. A pilot study with high school students demonstrated its construct validity for evaluating adolescents' food consumption behaviors. Additionally, the scale’s reliability, assessed using Cronbach's alpha, was found to be 0.90.
3.2.6 Sociodemographic Information
The sociodemographic information consisted of eight multiple-choice or open-ended questions, which included gender, age, education level, GPA, family size, parental occupation, monthly household income, and weekly income from parents.
3.3. Data Collection
Data were collected from June to October 2024. Questionnaires were distributed in classrooms, and students were given 20 to 30 minutes to complete them under the supervision of the researchers. To ensure the completeness of the data, the questionnaires were checked immediately upon submission.
3.4. Ethical Considerations
The study was approved by the Institutional Review Board (IRB) at Suan Sunandha Rajabhat University (Approval No. COA.1-031/2024) and was conducted in accordance with the Declaration of Helsinki. Participants were thoroughly informed about the study's purpose, procedures, and confidentiality measures. Written informed consent was obtained from all participants, as well as from their legal guardians. To safeguard participant privacy, confidentiality was maintained, and data were anonymized.
3.5. Data Analysis
Data were entered and analyzed utilizing the Statistical Package for the Social Sciences (SPSS) version 26. Descriptive statistics, such as mean, standard deviation, frequency, and percentage, were employed to summarize participant demographics, as well as predisposing, enabling, and reinforcing factors related to food consumption behaviors. A multiple regression analysis was conducted to identify significant predictors of food consumption behavior, with statistical significance established at P < 0.05.
4. Results
4.1. Characteristics of the Participants
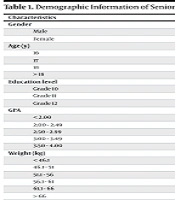
The study involved 326 participants, predominantly female students (68.71%), with an average age of 17 years. Most participants were in grade 11 (38.96%), and 45.40% had a GPA between 3.00 and 3.49. In terms of physical attributes, 23.62% weighed between 51.1 and 55.9 kg, and 39.57% were 161 to 165 cm tall. The average family size was five members (27.61%), with 41.41% living with parents or guardians. Notably, 36.20% of parents were business owners, and 34.36% reported a monthly income of 15,000 to 20,000 Baht. Most parents had a junior high school education (33.74%), and 86.81% of students received less than 5,000 Baht weekly from their parents. Additionally, 74.85% of parents lived together (Table 1).
Table 1.
Demographic Information of Senior High School Students (n = 326)
| Characteristics | No. (%) |
|---|---|
| Gender | |
| Male | 102 (31.29) |
| Female | 224 (68.71) |
| Age (y) | |
| 16 | 87 (26.69) |
| 17 | 114 (34.97) |
| 18 | 108 (33.13) |
| > 18 | 17 (5.21) |
| Education level | |
| Grade 10 | 76 (23.31) |
| Grade 11 | 127 (38.96) |
| Grade 12 | 123 (37.73) |
| GPA | |
| < 2.00 | 4 (1.23) |
| 2.00 - 2.49 | 14 (4.29) |
| 2.50 - 2.99 | 36 (11.04) |
| 3.00 - 3.49 | 148 (45.40) |
| 3.50 - 4.00 | 124 (38.04) |
| Weight (kg) | |
| < 46.1 | 38 (11.66) |
| 46.1 - 51 | 60 (18.40) |
| 51.1 - 56 | 77 (23.62) |
| 56.1 - 61 | 71 (21.78) |
| 61.1 - 66 | 52 (15.95) |
| > 66 | 28 (8.59) |
| Height (cm) | |
| < 151 | 13 (3.99) |
| 151 - 155 | 50 (15.34) |
| 156 - 160 | 63 (19.33) |
| 161 - 165 | 129 (39.57) |
| 166 - 170 | 44 (13.50) |
| > 171 | 27 (8.27) |
| Number of family members | |
| 1 | 12 (3.68) |
| 2 | 22 (6.75) |
| 3 | 83 (25.46) |
| 4 | 75 (23.01) |
| 5 | 90 (27.61) |
| > 6 | 44 (13.49) |
| Place of residence | |
| Dormitory | 81 (24.85) |
| Friend’s house | 74 (22.70) |
| With parents or guardian | 135 (41.41) |
| Own house | 36 (11.04) |
| Occupation of the parents | |
| Government official | 56 (17.18) |
| Business owner | 118 (36.20) |
| Freelance | 92 (28.22) |
| Agriculturist | 43 (13.19) |
| Other (e.g., unemployed) | 17 (5.21) |
| Monthly income of the parents (Baht) | |
| < 5,000 | 21 (6.44) |
| 5,001 - 10,000 | 31 (9.51) |
| 10,001 - 15,000 | 82 (25.15) |
| 15,000 - 20,000 | 112 (34.36) |
| > 20,000 | 80 (24.54) |
| Education level of the parents | |
| No education | 18 (5.52) |
| Primary school | 45 (13.80) |
| Junior high school | 110 (33.74) |
| High school | 58 (17.79) |
| Diploma | 19 (5.83) |
| Bachelor’s degree | 66 (20.25) |
| Postgraduate degree | 10 (3.07) |
| Weekly income received from the parents (Baht) | |
| < 5,000 | 283 (86.81) |
| 5,001 - 10,000 | 37 (11.35) |
| 10,001 - 15,000 | 4 (1.23) |
| > 15,000 | 2 (0.61) |
| Status of the family | |
| Living together | 244 (74.85) |
| Separated or divorced | 57 (17.48) |
| Parents passed away | 25 (7.67) |
4.2. Predisposing, Enabling, and Reinforcing Factors
The average levels of various predisposing and enabling factors related to consumption were assessed. The average knowledge of consumption factors was found to be high at 44.11%, while the average attitude towards consumption factors was at a moderate level of 87.12%. Accessibility and readiness of food consumption showed an average moderate level of 50.93%. The impact of media was rated at a moderate average of 64.42%, and the influence from peers was similarly moderate at 70.86%. Overall, consumption behavior averaged at a moderate level of 78.83%, as detailed in Table 2.
Table 2.
Analysis of Predisposing, Enabling, and Reinforcing Factors among Participants (n = 326)
| Factors | No. (%) | Mean ± SD |
|---|---|---|
| Predisposing Factors | ||
| Knowledge of consumption | 0.75 ± 0.33 | |
| Low-level of knowledge | 45 (13.60) | |
| Moderate level of knowledge | 135 (40.79) | |
| Low-level of knowledge | 146 (44.11) | |
| Attitude of consumption | 2.12 ± 0.33 | |
| Low-level of attitude | 1 (0.31) | |
| Moderate level of attitude | 284 (87.12) | |
| Low-level of attitude | 41 (12.57) | |
| Enabling factors-accessibility | 2.47 ± 0.51 | |
| Low-level of accessibility | 2 (0.61) | |
| Moderate level of accessibility | 166 (50.92) | |
| Low-level of accessibility | 158 (48.47) | |
| Reinforcing Factors | ||
| Influence from media | 2.26 ± 0.53 | |
| Low-level of effect from media | 15 (4.60) | |
| Moderate level of effect from media | 210 (64.42) | |
| Low-level of effect from media | 101 (30.98) | |
| Influence from peers | 2.05 ± 0.53 | |
| Low-level of effect from peers | 38 (11.66) | |
| Moderate level of effect from peers | 231 (70.86) | |
| Low-level of effect from peers | 57 (17.48) | |
| Food consumption behavior | ||
| Low-level of food consumption behavior | 2 (0.61) | |
| Moderate level of food consumption behavior | 257 (78.83) | |
| Low-level of food consumption behavior | 67 (20.56) |
4.3. Predictors of Food Consumption Behavior
In our study, we analyzed the prediction of food consumption behavior using hierarchical regression analysis. As shown in Table 3, several factors emerged as significant predictors of food consumption behavior among students: The accessibility and readiness of food (β = 0.129, P < 0.020), peer influence (β = 0.161, P = 0.004), and media influence (β = 0.149, P = 0.007).
Table 3.
Predictors of Food Consumption Behavior (n = 326)
| Factors Affecting the Behaviors | Unstandardized Coefficients | Standardized Coefficients (β) | t | P-Value | |
|---|---|---|---|---|---|
| B | SE | ||||
| Model 1: Predisposing factors a | |||||
| Constant | 1.744 | 0.230 | - | 7.567 | < 0.001 |
| Knowledge of consumption | 0.0043 | 0.033 | 0.072 | 1.303 | 0.194 |
| Attitude of consumption | 0.009 | 0.006 | 0.088 | 1.579 | 0.115 |
| Model 2: Enabling factors b | |||||
| Constant | 1.941 | 0.113 | - | 17.180 | < 0.001 |
| Accessibility and readiness of food consumption | 0.104 | 0.045 | 0.129 | 2.335 | 0.020 |
| Model 3: Reinforcing factors c | |||||
| Constant | 1.679 | 0.119 | - | 14.134 | < 0.001 |
| Influence from friends | 0.125 | 0.043 | 0.161 | 2.924 | 0.004 |
| Influence from medias | 0.115 | 0.043 | 0.149 | 2.710 | 0.007 |
a R2 = 0.015, adjusted R2 = 0.008, F = 2.379, P < 0.05.
b R2 = 0.017, adjusted R2 = 0.014, F = 5.451, P < 0.05.
c R2 = 0.058, adjusted R2 = 0.052, F = 9.963, P < 0.05.
5. Discussion
This study sought to explore the factors that influence food consumption behaviors among senior high school students, emphasizing predisposing, enabling, and reinforcing elements. The findings provide valuable insights into the eating habits of adolescents and underscore the necessity for targeted interventions to combat unhealthy consumption patterns.
5.1. Knowledge and Attitude (Predisposing Factors)
The results show that while knowledge of food consumption was relatively high at 44.11%, attitudes toward it were moderate at 87.12%. This aligns with global research indicating that knowledge alone is insufficient for sustainable behavioral change. Adolescents often understand nutrition but struggle to apply this knowledge due to a lack of intrinsic motivation or external support (23). In Thailand, national initiatives like "Healthy Thailand 2020" have raised awareness about nutritional guidelines, yet moderate attitudes reflect gaps in motivation and reinforcement (24, 25). The moderate attitude score (mean ± SD = 2.12 ± 0.33) highlights influences such as socioeconomic disparities, cultural preferences, and media exposure, consistent with Southeast Asian studies that show cultural acceptance of unhealthy foods complicates dietary changes (26).
Furthermore, standardized regression analysis indicated that knowledge did not significantly predict food consumption behavior, illustrating the "intention-behavior gap" noted in Ajzen's theory of planned behavior (27). Therefore, while knowledge is important, positive attitudes and external motivation are needed to foster healthy behaviors. Interventions must focus on motivational interviewing, goal setting, and behavior change techniques to drive meaningful behavior change (28, 29).
5.2. Accessibility and Readiness (Enabling Factors)
The findings reveal that accessibility and readiness for food consumption are significant predictors of adolescent eating behaviors. With a moderate mean score, accessibility reflects the inconsistent availability of healthy food options in both schools and communities. Research has consistently demonstrated that access to nutrient-dense foods directly impacts eating behaviors, particularly among adolescents (30). A lack of availability or affordability of healthy food, coupled with widespread exposure to inexpensive fast food, can contribute to the perpetuation of unhealthy consumption patterns (31). This trend is notably pronounced in low- and middle-income countries, where economic disparities limit access to fresh fruits, vegetables, and whole grains. Thailand is no exception to these challenges in fostering an environment conducive to healthy food choices.
The findings of this study highlight systemic barriers, including limited financial resources, parental influence, and inadequately managed school food environments. For instance, many school canteens prioritize profitability over nutrition, resulting in the sale of calorie-dense, low-nutrient foods instead of healthier alternatives. The mean score for accessibility emphasizes the urgent need to tackle both physical and economic barriers, echoing findings by Phulkerd et al. that highlight socioeconomic disparities in Thailand's dietary landscape (26). The concept of "food readiness" encompasses adolescents' capacity to access and prepare healthy meals, which may be influenced by factors such as parental involvement, food skills, and home environments (32). The limited level of readiness observed in this study indicates a need for comprehensive strategies to enhance the food ecosystem.
Globally, successful interventions — including policies promoting subsidized school meals, improved food distribution systems, and enhanced school garden programs — have been shown to effectively improve food accessibility and dietary behaviors (33).
5.3. Influence of Media and Peers (Reinforcing Factors)
Reinforcing factors, such as media influence and peer influence, were found to be significant predictors of food consumption behavior. These findings underscore the influential role of social and environmental reinforcements in shaping adolescents' eating habits. The impact of media (mean = 64.42%) illustrates the prevalence of advertisements promoting unhealthy food choices, including fast food, sugary beverages, and processed snacks. Additionally, peer influence (mean = 70.86%) highlights how adolescents’ food choices are strongly shaped by social norms and peer behaviors. In Thailand, the extensive marketing of calorie-dense, nutrient-poor foods exacerbates unhealthy consumption trends. This challenge is further intensified by peer influence, as adolescents often adopt food choices that align with social norms and group behaviors (34). These findings resonate with Bandura's social learning theory, which emphasizes the importance of observational learning in shaping behavior.
5.4. Overall Food Consumption Behavior
The food consumption behavior observed in this study was moderate, indicating a blend of both healthy and unhealthy eating patterns. Although knowledge levels were high and enabling and reinforcing factors were moderate, it underscores the complex nature of food consumption behavior. Similar trends have been noted globally, where individual-level factors such as knowledge alone are insufficient to instigate behavior change without supportive environmental and social contexts (33). These findings highlight the necessity of a multi-level approach to effectively address food consumption behaviors among adolescents. Environmental modifications, such as enhancing school food environments, alongside policy interventions to limit the marketing of unhealthy foods, are crucial strategies.
5.5. Implications for Policy and Practice
The findings of this study carry important implications for both policy and practice. Firstly, enhancing access to healthy food options in schools and homes should be a top priority. Implementing policies promoting affordable, nutritious meals and regulating unhealthy food advertisements is crucial. Secondly, employing behavior change strategies that address attitudes and external reinforcements, such as peer-led initiatives and media literacy education, can help cultivate a supportive environment for adolescents. Collaborative efforts among schools, families, and public health agencies will be vital in achieving sustainable improvements in food consumption behaviors.
5.6. Conclusions
This study highlights key factors influencing food consumption among senior high school students, focusing on predisposing, enabling, and reinforcing elements. While knowledge of healthy eating is high, attitudes towards healthy choices are moderate, indicating a persistent intention-behavior gap. Accessibility and readiness for healthy food are significant determinants, emphasizing the need to address environmental barriers like availability and affordability. Media and peer influence further shape adolescents' dietary decisions. Future interventions should integrate media literacy, peer-led health programs, and access to affordable, nutritious foods. Collaborative efforts among schools, families, public health authorities, and government agencies are crucial for fostering healthier eating habits and reducing noncommunicable disease burdens among youth.
5.7. Limitations and Future Research
This study has some notable limitations. First, the cross-sectional design restricts our ability to determine causality between various factors and food consumption behaviors. Longitudinal studies would be beneficial to examine the temporal relationships and monitor behavioral changes over time. Second, the reliance on self-reported data may introduce response bias, especially concerning individuals' food consumption habits. Future research should consider incorporating objective measures, such as dietary recall logs or school-based food audits. Finally, broadening the sample to include diverse geographic and socioeconomic populations would improve the generalizability of the findings.