


1. Background
Job performance in healthcare, especially among nurses, plays a pivotal role in organizational productivity and patient outcomes. Nurses, as the largest group within the healthcare system, directly interact with patients and their families and are essential in promoting health, preventing disease, and alleviating suffering (1-3). This role becomes even more critical in intensive care units (ICUs), where nurses face high workloads due to critically ill patients, ethical dilemmas, and emotionally demanding conditions (4, 5). The resulting stress contributes to absenteeism, burnout, and job turnover, imposing heavy costs on the healthcare system (6, 7). A meta-analysis conducted by Xu et al. showed that turnover intention among ICU nurses can reach 27.7% (8), with high caregiver burden identified as a key contributing factor (9).
Caregiver burden arises when there is an imbalance between caregiving demands and available resources. It includes objective dimensions (e.g., time, effort, financial costs) and subjective aspects (e.g., psychological pressure, emotional distress), which may involve compassion fatigue, hope, and religious beliefs (10). A high caregiver burden can lead to physical problems (e.g., musculoskeletal pain, hypertension), psychological issues (e.g., anxiety, depression), and reduced quality of care, such as longer hospital stays and increased hospital-acquired infections (11, 12). Therefore, it is essential to pay attention to the factors influencing nurses’ caregiver burden, especially psychological factors such as compassion fatigue, hope, and religious beliefs, which have received relatively little attention in previous research.
Compassion fatigue, as described by Figley, occurs when nurses experience emotional exhaustion from helping those who suffer (13). It is seen as "the cost of caring" and can result in psychological harm, decreased performance, and emotional detachment if left unaddressed (14-16). Although many studies have focused on non-nursing populations, compassion fatigue is highly prevalent among healthcare workers, particularly nurses (17). A study by Alharbi et al. revealed that many nurses are at risk but remain unaware of it (18), especially in ICUs where prolonged patient contact increases the risk (19).
Hope is another psychological factor that supports resilience under stress. Nurses not only draw strength from their own hope but also transfer it to patients, helping facilitate recovery. Studies have shown that early assessment and support of hope can help reduce caregiver burden (20-22).
Among the key influences on hope are religious beliefs and spiritual well-being. These factors have been increasingly recognized as essential components of mental health (23, 24). A study by Harris and Tao found that religion and spirituality were negatively associated with emotional exhaustion and positively linked to personal accomplishment (25). Similarly, Ibrahim et al. reported that positive religious behaviors were key coping strategies among nurses for occupational stress (26). Furthermore, Heidari et al. demonstrated that spiritual well-being in nurses plays a crucial role in delivering spiritual care and addressing patients’ spiritual needs (27).
Given the significant impact of caregiver burden on ICU nurses, which can result in physical, psychological, and social challenges and ultimately reduce the quality of nursing care, it is essential to investigate this burden and the factors that influence it. Although many organizational and occupational factors have been widely studied, the psychological and spiritual dimensions have received relatively little attention, particularly in the ICU setting.
2. Objectives
Therefore, this study was conducted in 2024 in Ahvaz to examine the relationship between caregiver burden and three key variables: Religious beliefs, hope, and compassion fatigue among ICU nurses.
3. Methods
3.1. Study Design
This research is a descriptive cross-sectional study that examines the relationship between caregiver burden and the roles of religious beliefs, hope, and compassion fatigue among nurses working in ICUs at hospitals affiliated with Ahvaz Jundishapur University of Medical Sciences in the city of Ahvaz during the year 2024.
3.2. Recruitment and Eligibility
The required sample size was estimated at 175 participants using MedCalc statistical software, based on the findings of the study by Hosseinjanizadeh et al. (28). In their study, a significant correlation was reported between compassion fatigue and work-family conflict (R = 0.32, P < 0.05). Based on this effect size, with a significance level of α = 0.05 and a statistical power of 90%, the sample size was determined for the current study.
To obtain a representative sample, 175 ICU nurses were selected using stratified random sampling with proportional allocation from hospitals affiliated with Ahvaz Jundishapur University of Medical Sciences. Each hospital with an ICU was considered a stratum, and the number of participants from each hospital was determined proportionally to the number of ICU nurses employed there (Imam Khomeini Hospital: 48 nurses, Golestan Hospital: 55, Razi Hospital: 23, Karami Hospital: 18, Sina Hospital: 21, and Taleghani Hospital: 10). Eligible nurses in each stratum were then selected through simple random sampling using random number generation.
Inclusion criteria were: Informed consent and willingness to participate, at least six months of work experience in an ICU, holding a Bachelor’s degree in nursing or higher, and no history of psychiatric illness. Participants were excluded during the study if they withdrew at any stage or submitted incomplete questionnaire responses.
3.3. Data Collection Tools and Procedures
After obtaining the necessary approvals, the researcher visited the teaching hospitals affiliated with Ahvaz Jundishapur University of Medical Sciences with an official letter of introduction. Following coordination with the hospital directors, director of nursing, and ICU head nurses, eligible nurses were identified. After providing them with detailed information about the study and ensuring confidentiality, written informed consent was obtained from all participants. Data collection was conducted continuously on working days (Saturday to Thursday) from September to December 2024.
The data collection instruments included a demographic questionnaire, the Zarit Burden Interview (ZBI), the Compassion Fatigue Short Scale, Snyder’s Hope Scale, and the Allport-Ross Religious Beliefs Scale, all of which were self-administered by the nurses. During this process, the researcher was present in the ICU wards to address any questions from the participants. Due to the impossibility of having all nurses present during the morning shifts, data collection was carried out in a rotating manner across different shifts.
The ZBI consists of 22 items rated on a five-point Likert scale ranging from "never" to "always", assessing the personal, social, emotional, and financial dimensions of caregivers. The total score ranges from 0 to 88. The validity and reliability of this instrument were confirmed in a study conducted by Navidian and Bahari in Iran, reporting a test-retest reliability coefficient of 0.71 and internal consistency (Cronbach’s alpha) of 0.91 (29).
The Allport-Ross Religious Beliefs Questionnaire includes 21 four-choice items measuring religious beliefs across two dimensions: Intrinsic and extrinsic orientation. Some items are reverse-scored. The Persian version was translated and standardized by Jan Bozorgi (1999), with a Cronbach’s alpha of 0.71 and a test-retest reliability coefficient of 0.74 (30).
The Snyder Hope Scale comprises 12 items rated on a five-point Likert scale ranging from “strongly disagree” to “strongly agree”. It includes two subscales: Agency thinking and pathways thinking. Items 3, 7, and 11 are reverse-scored. Internal consistency (Cronbach’s alpha) has been reported to range from 0.74 to 0.84, with test-retest reliability between 0.80 and 0.85 (31).
Additionally, the Compassion Fatigue Questionnaire, developed by Figley in 1995, contains 30 items across three subscales: Compassion satisfaction, burnout, and compassion fatigue, rated on a six-point Likert scale (from 0 to 5). Each subscale yields a score between 0 and 50, with a total score range of 0 to 150. The Persian version was translated and validated by Mohammadi et al. (2015), showing a content validity of 87% and internal consistency of 0.80 (32).
3.4. Data Analysis
Data were analyzed using SPSS version 22 (IBM Corp., Armonk, NY, USA), with statistical significance set at p < 0.05. The normality of continuous variables was assessed using Shapiro-Wilk tests (P > 0.05 for all variables), confirming normal distribution. Descriptive statistics included means ± standard deviations for normally distributed continuous variables and frequencies (percentages) for categorical variables. Bivariate analyses included the following: (1) Pearson's correlation for continuous variables, and (2) independent t-tests for group comparisons of normally distributed data. Multivariable linear regression models adjusted for clinically relevant covariates (age, sex, comorbidities) were constructed to identify independent predictors of clinical outcomes. Effect sizes were reported with 95% confidence intervals. Bonferroni correction addressed multiple comparisons where appropriate. All analyses were conducted as intention-to-treat with two-tailed significance testing.
4. Results
Table 1 presents descriptive statistics related to the demographic and occupational characteristics of the participants. The mean age of the participants was 33.59 ± 6.32 years, and their average work experience was 9.81 ± 5.91 years, indicating a mix of relatively young employees with moderate work experience. Regarding gender, the majority of participants were female 128 (73.1%), while males comprised 47 (26.9%). In terms of marital status, more than half of the individuals 93 (53.1%) were single, and 82 (46.9%) were married. Additionally, in examining the type of work shift, most participants 144 (82.3%) worked in rotating shifts, whereas only 31 (17.7%) worked fixed shifts.
Table 1.Baseline Characteristics Information a
| Variables | Values |
|---|---|
| Age | 33.59 ± 6.32 |
| Work experience | 9.81 ± 5.91 |
| Gender | |
| Male | 128 (73.1) |
| Female | 47 (26.9) |
| Marital status | |
| Single | 93 (53.1) |
| Married | 82 (46.9) |
| Shift type | |
| Fixed | 31 (17.7) |
| Rotational | 144 (82.3) |
a Values are expressed as mean ± SD or No. (%).
Table 2 provides an overview of the psychological, spiritual, and caregiver burden status of the participants. The mean total caregiver burden score was 43.66 ± 11.90, with the majority of participants 149 (85.1%) experiencing a moderate level of caregiver burden, while only 20 (11.4%) reported a low burden and 6 (3.4%) reported a high burden. Regarding hope for life, the mean score was 45.93 ± 5.86, and more than 90% of the participants 163 (93.1%) exhibited a high level of hope. The mean total compassion fatigue score was 106.46 ± 13.99. Breaking down the subscales, compassion fatigue due to occupational burnout had a mean score of 39.62 ± 6.80, fatigue scored 35.95 ± 4.57, and compassion satisfaction was reported with a mean of 31.50 ± 7.63. Furthermore, the mean total religious beliefs score was 60.14 ± 7.90, which included the extrinsic religious beliefs dimension with a mean of 35.13 ± 5.93 and the intrinsic religious beliefs dimension with a mean of 25.64 ± 3.77. Regarding religious beliefs, 147 (84%) of participants were classified as having a high level of religiosity, while only 28 (16%) scored low. These data indicate a relatively favorable psychological and spiritual status among the participants, along with a moderate level of caregiver burden.
Table 2.Descriptive Statistics of Studied Outcomes a
| Variables | Values |
|---|---|
| Caregiver burden score | |
| Total | 43.66 ± 11.90 |
| Low | 20 (11.4) |
| Moderate | 149 (85.1) |
| High | 6 (3.4) |
| Hope score | |
| Total | 45.93 ± 5.86 |
| Low | 2 (1.1) |
| Moderate | 10 (5.7) |
| High | 163 (93.1) |
| Compassion fatigue score | |
| Total | 106.46 ± 13.99 |
| Burnout from compassion | 39.62 ± 6.80 |
| Fatigue from compassion | 35.95 ± 4.57 |
| Compassion satisfaction | 31.50 ± 7.63 |
| Religious beliefs score | |
| Total | 60.14 ± 7.90 |
| External religious beliefs | 35.13 ± 5.93 |
| Internal religious beliefs | 25.64 ± 3.77 |
| Low | 28 (16.0) |
| High | 147 (84.0) |
a Values are expressed as mean ± SD or No. (%).
Table 3 examines a comparative analysis of the mean scores of the main study variables, including components of religiosity, compassion, hope, and caregiver burden, based on demographic variables (gender, type of work shift, and marital status) using independent t-tests. The comparative analysis between males and females revealed no significant differences between the groups for any of the variables (P > 0.05), although females had slightly higher mean scores in compassion fatigue due to occupational burnout (41.28 ± 5.33 vs. 39.02 ± 7.19) and extrinsic religious beliefs (36.45 ± 5.66 vs. 34.64 ± 5.98). Similarly, the analysis based on shift type (fixed or rotating) showed no significant differences in any variables (P > 0.05), although those working fixed shifts scored marginally higher in hope and lower in caregiver burden. Finally, the comparison between married and single participants also showed no statistically significant differences in any variables (P > 0.05), although singles had a slightly higher mean score in intrinsic religious beliefs. Overall, the results of the table indicate no significant differences in psychological, spiritual, and caregiver burden indices based on the examined demographic variables.
Table 3.Comparison of Caregiver Burden, Religious Beliefs, Compassion Fatigue, and Hope Components Based on Demographic Characteristics a
| Variables | Caregiver Burden | Hope | Total Compassion Fatigue | Burnout from Compassion | Fatigue from Compassion | Compassion Satisfaction | Total Religious Beliefs | External Religious Beliefs | Internal Religious Beliefs |
|---|---|---|---|---|---|---|---|---|---|
| Gender | |||||||||
| Male | 43.19 ± 11.65 | 46.08 ± 6.01 | 106.21 ± 14.48 | 39.02 ± 7.19 | 36.07 ± 4.22 | 31.33 ± 7.38 | 60.58 ± 8.05 | 34.64 ± 5.98 | 25.77 ± 3.71 |
| Female | 44.94 ± 12.59 | 45.49 ± 5.48 | 107.15 ± 12.67 | 41.28 ± 5.33 | 35.64 ± 5.47 | 31.96 ± 8.32 | 58.95 ± 7.42 | 36.45 ± 5.66 | 25.30 ± 3.97 |
| t | -0.863 | 0.588 | -0.394 | 0.552 | -0.483 | -1.965 | 1.215 | -1.795 | 0.725 |
| df | 173 | 173 | 173 | 173 | 173 | 173 | 173 | 173 | 173 |
| P-value | 0.389 | 0.557 | 0.694 | 00.51 | 0.582 | 0.630 | 0.226 | 0.074 | 0.470 |
| Shift type | |||||||||
| Rotational | 44.18 ± 11.96 | 45.78 ± 5.33 | 107.10 ± 13.85 | 39.23 ± 7.30 | 36.08 ± 4.57 | 31.30 ± 7.54 | 60.30 ± 7.79 | 34.90 ± 6.29 | 25.35 ± 3.79 |
| Fixed | 41.27 ± 11.49 | 46.58 ± 7.27 | 103.51 ± 14.47 | 41.45 ± 3.13 | 35.35 ± 4.62 | 32.42 ± 8.05 | 59.39 ± 8.47 | 36.19 ± 3.77 | 27.00 ± 3.45 |
| t | 1.235 | -0.681 | 1.296 | -0.741 | 0.803 | -1.659 | 0.582 | -1.105 | -2.234 |
| df | 173 | 173 | 173 | 173 | 173 | 173 | 173 | 173 | 173 |
| P-value | 0.219 | 0.497 | 0.197 | 0.099 | 0.423 | 0.460 | 0.561 | 0.271 | 0.270 |
| Marital status | |||||||||
| Single | 44.75 ± 11.69 | 45.79 ± 5.59 | 106.48 ± 12.89 | 38.88 ± 7.75 | 36.18 ± 4.67 | 31.77 ± 7.91 | 59.95 ± 8.21 | 34.85 ± 6.71 | 25.54 ± 3.71 |
| Married | 42.43 ± 12.09 | 46.08 ± 6.19 | 106.45 ± 15.22 | 40.46 ± 5.44 | 35.70 ± 4.48 | 31.18 ± 7.32 | 60.36 ± 7.57 | 35.44 ± 4.92 | 25.76 ± 3.86 |
| t | 1.290 | 0.678 | 0.015 | 0.510 | 0.702 | -1.541 | -0.347 | -0.655 | -0.381 |
| df | 173 | 173 | 173 | 173 | 173 | 173 | 173 | 173 | 173 |
| P-value | 0.199 | 0.750 | 0.988 | 0.125 | 0.484 | 0.610 | 0.729 | 0.514 | 0.704 |
a Values are expressed as mean ± SD.
The results of the Pearson correlation test in Table 4 indicated significant relationships between the total caregiver burden score and some independent variables. The total compassion fatigue score showed a positive and significant correlation with the total caregiver burden score (R = 0.554, P < 0.01), meaning that as the total compassion fatigue score increases, the total caregiver burden score also increases (Figure 1). Additionally, a significant negative correlation was observed between the total religious beliefs score and the total caregiver burden score (R = -0.454, P < 0.01), indicating that higher religious beliefs scores are associated with lower caregiver burden scores (Figure 2). The total hope score also demonstrated a weak but significant negative correlation with the total caregiver burden score (R = -0.242, P < 0.01) (Figure 3). On the other hand, age (R = 0.233, P = 0.002) and work experience (R = 0.234, P = 0.002) both showed weak yet significant positive correlations with the total caregiver burden score. Regarding the relationships among the independent variables themselves, a very strong and significant correlation was found between age and work experience (R = 0.952, P < 0.01), indicating a high collinearity between these two demographic variables. Moreover, a positive and significant correlation existed between the total hope score and the total religious beliefs score (R = 0.210, P < 0.01). Other relationships among the independent variables were either statistically nonsignificant or exhibited low correlation strength.
Table 4.Correlation Between Individual Characteristics and Psychological Variables Among Caregivers
| Variables | Age | Work Experience | Hope | Caregiver Burden | Compassion Fatigue | Religious Beliefs |
|---|---|---|---|---|---|---|
| Age | ||||||
| Pearson correlation | 1 | 0.952 | 0.061 | 0.233 | -0.035 | -0.037 |
| P-value | - | < 0.001 | 0.419 | 0.002 | 0.647 | 0.629 |
| Work experience | ||||||
| Pearson correlation | 0.952 | 1 | 0.083 | 0.234 | -0.029 | -0.032 |
| P-value | < 0.001 | - | 0.275 | 0.002 | 0.708 | 0.676 |
| Hope | ||||||
| Pearson correlation | 0.061 | 0.083 | 1 | -0.242 | -0.046 | 0.210 |
| P-value | 0.419 | 0.275 | - | 0.001 | 0.549 | 0.005 |
| Caregiver burden | ||||||
| Pearson correlation | 0.233 | 0.234 | -0.242 | 1 | 0.554 | -0.454 |
| P-value | 0.002 | 0.002 | 0.001 | - | 0.001 > | 0.001 > |
| Compassion fatigue | ||||||
| Pearson correlation | -0.035 | -0.029 | -0.046 | 0.554 | 1 | 0.237 |
| P-value | 0.647 | 0.708 | 0.549 | 0.001 > | - | 0.002 |
| Religious beliefs | ||||||
| Pearson correlation | -0.037 | -0.032 | 0.210 | -0.454 | 0.237 | 1 |
| P-value | 0.629 | 0.676 | 0.005 | 0.001 > | 0.002 | - |
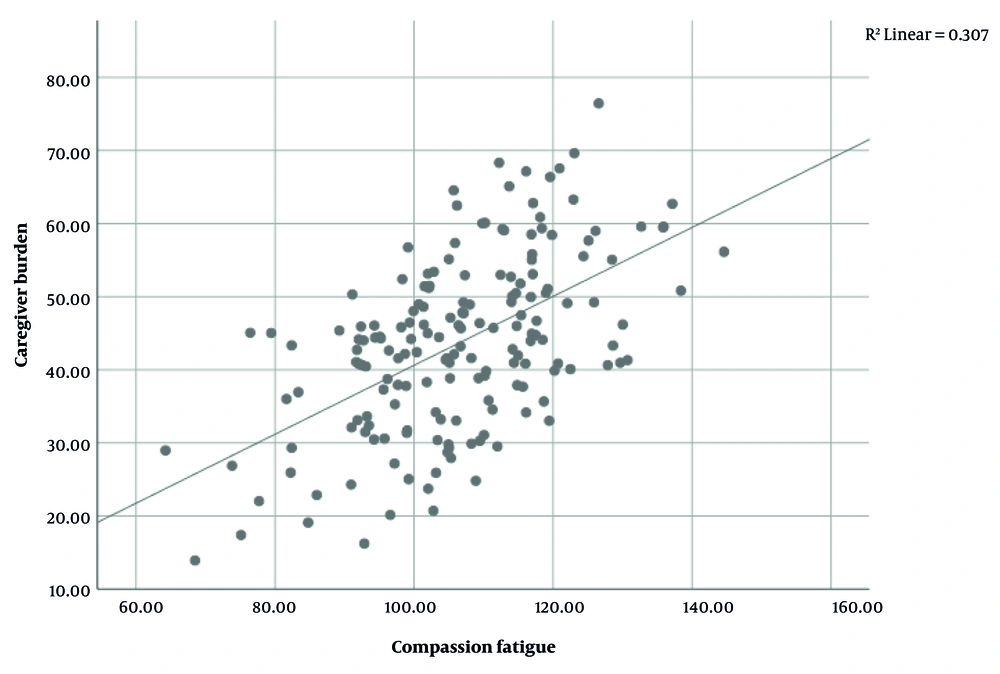
Figure 1.
Simple scatter with fit line of caregiver burden by compassion fatigue
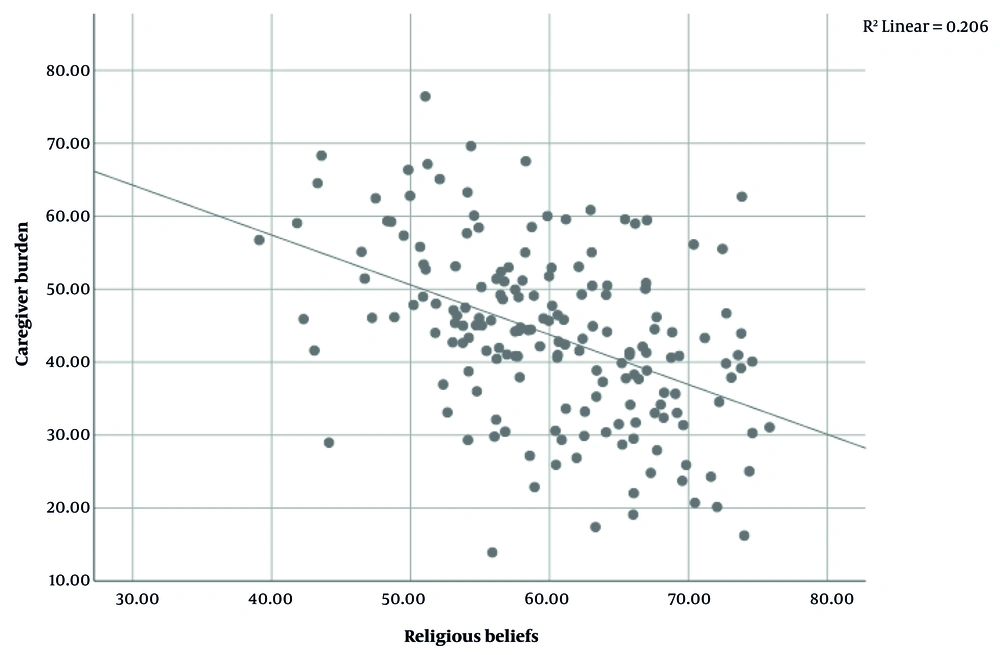
Figure 2.
Simple scatter with fit line of caregiver burden by religious beliefs
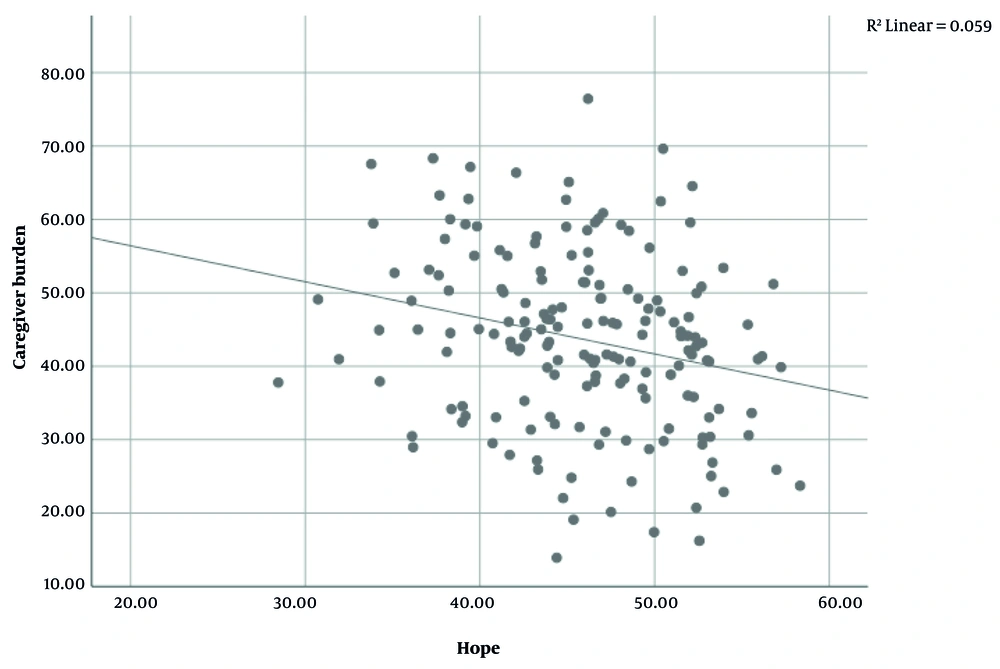
Figure 3.
Simple scatter with fit line of caregiver burden by hope
The results of the multiple regression analysis indicated that the model had a high overall predictive power, explaining approximately 74.3% of the variance in the total caregiver burden score (R² = 0.743). Among the variables included in the model, the total compassion fatigue score (β = 0.593, P < 0.001), total religious beliefs score (β = -0.888, P < 0.001), and total hope score (β = -0.213, P = 0.011) had significant effects on caregiver burden. Specifically, each one-unit increase in the compassion fatigue score corresponded to an average increase of 0.593 units in caregiver burden. Conversely, a one-unit increase in religious beliefs was associated with an approximate decrease of 0.888 units in caregiver burden, indicating a strong and meaningful effect of religious beliefs in alleviating caregiver stress and burden. Additionally, each one-unit increase in hope score resulted in a decrease of 0.213 units in caregiver burden. Other variables such as gender, shift type, marital status, age, and work experience did not have significant effects. Thus, religious beliefs were identified as the most influential factor in reducing caregiver burden. Further details are provided in Table 5.
| Parameters | B | Std. Error | t | P-Value | 95% Confidence Interval | |
|---|---|---|---|---|---|---|
| Lower Bound | Upper Bound | |||||
| Intercept | 32.663 | 8.325 | 3.923 | 0.000 | 16.225 | 49.100 |
| Sex | ||||||
| Male | 0.808 | 1.068 | 0.756 | 0.451 | -1.301 | 2.917 |
| Female | 0 c | - | - | - | - | - |
| Shift type | ||||||
| Fix | 0.002 | 1.381 | 0.001 | 0.999 | -2.724 | 2.728 |
| Rotating | 0 c | - | - | - | - | - |
| Marital status | ||||||
| Single | 1.812 | 1.030 | 1.760 | 0.080 | -0.221 | 3.845 |
| Married | 0 c | - | - | - | - | - |
| Age | 0.196 | 0.248 | 0.790 | 0.431 | -0.294 | 0.685 |
| Work experience | 0.291 | 0.264 | 1.101 | 0.273 | -0.231 | 0.813 |
| Compassion fatigue | 0.593 | 0.035 | 17.025 | 0.000 | 0.525 | 0.662 |
| Religious beliefs | -0.888 | 0.063 | -14.065 | 0.000 | -1.012 | -0.763 |
| Hope | -0.213 | 0.083 | -2.575 | 0.011 | -0.376 | -0.050 |
a Parameter estimates; dependent variable: Caregiver burden.
b Computed using alpha = 0.05
c R-squared = 0.743 (adjusted R-squared = 0.730)
5. Discussion
The present study aimed to examine the relationships between religious beliefs, compassion fatigue, and hope with caregiver burden among ICU nurses. Most participants were young females with under 10 years of work experience. Although this demographic might indicate physical capability, it could also imply increased vulnerability to psychological stressors. The majority (82.3%) worked rotating shifts; however, shift type did not significantly impact caregiver burden. While Shahriari et al. (33) reported higher occupational burnout among nurses on fixed shifts, our findings did not support this association. Over half of the nurses were single (53.1%), which might relate to social support differences, yet marital status was not a significant predictor in this study.
Given these demographic variables showed no significant effects on caregiver burden, the discussion focuses primarily on psychological factors, aligning with Alharbi et al. (18), who emphasized the stronger influence of psychological over demographic factors in occupational stress. Although Kartsonaki et al. (34) found some demographic associations, our findings suggest that the lack of significant demographic effects may stem from the relatively uniform work environment in Middle Eastern healthcare settings, where nurses share similar stressors, responsibilities, and organizational systems. Cultural factors such as hierarchical structures, collectivist norms, and defined role expectations likely contribute to this homogeneity, reducing the impact of variables like gender or shift type on caregiver burden. This contrasts with Western contexts, where individual autonomy and flexible roles often amplify demographic differences. Thus, the limited role of demographic factors in our study appears culturally contextual and highlights the greater relevance of psychological and spiritual resources in shaping caregiver burden.
The average caregiver burden was moderate (mean: 43.66 ± 11.90), which may reflect the protective effects of religious beliefs and hope observed in the sample. Nurses’ hope levels were high (mean: 45.93 ± 5.86), contrasting with Yanık et al. and Ediz, who found low happiness levels in Turkish nurses (20). This discrepancy might be explained by cultural and religious differences affecting coping mechanisms. Compassion fatigue was notably high (mean burnout subscale: 39.62 ± 6.80), consistent with Erbay (35), who emphasized the need for psychological support for ICU nurses. However, compassion satisfaction and religiosity were also elevated, supporting Yesil and Polat’s (36) findings that religious beliefs can bolster resilience against occupational stress.
The results showed that compassion fatigue, as an independent predictor, has a strong positive relationship with caregiver burden, meaning that increased emotional and psychological fatigue leads to a higher caregiving burden. This finding aligns with the report by Jarrad and Hammad (37), who identified compassion fatigue as a predictor of occupational burnout among oncology nurses. In ICU settings, repeated emotional stressors reduce moral resilience and increase moral distress (38, 39). Compassion fatigue may also contribute to decreased job satisfaction and reduced quality of care (40). Given its strong predictive power, compassion fatigue highlights the urgent need for interventions focused on psychological resilience rather than simply modifying work structures or schedules.
Religious beliefs showed a strong negative correlation with caregiver burden, emphasizing their protective role. In this context, Rafati et al. reported that spiritual well-being serves as a negative predictor of caregiver burden among hemodialysis caregivers (41). Similarly, positive religious coping lowers anxiety and depression, which are known to increase caregiver burden (42). In high-stress ICU environments, religiosity offers a vital internal resource that promotes meaning and resilience (12). The positive correlation between hope and religiosity further supports the notion that spiritual beliefs enhance psychological coping resources (43). In this context, religiosity acts as a “psychological anchor” amid persistent exposure to death and suffering. Therefore, integrating spiritual support into institutional interventions could help mitigate caregiver burden more effectively than strategies based solely on demographic distinctions.
Hope was also significantly negatively associated with caregiver burden, confirming its protective and motivational role. This is consistent with García-Castro et al. (44), who identified hope as a key mediator between stress and caregiver burden, and with Kagan et al. (45), who linked hope to improved professional performance and work meaning in ICU nurses. Promoting hope can thus improve nurses’ work life quality and serve as an effective strategy to alleviate caregiver burden in critical care settings.
Overall, these findings underscore the central role of psychological and spiritual factors — particularly religious beliefs, compassion fatigue, and hope — in influencing caregiver burden, beyond the impact of demographic variables. In contrast to Western studies, such as Rickard et al. (46), which often emphasize institutional or policy-level interventions, our results point to the stronger influence of culturally embedded spiritual resources within Middle Eastern contexts. These findings suggest that effective strategies to reduce caregiver burden should be culturally sensitive, acknowledging the vital role of internal belief systems and psychological resilience in supporting healthcare professionals.
5.1. Conclusions
Overall, based on the findings of the present study, psychological and spiritual factors — particularly religious beliefs, hope, and compassion fatigue — play a crucial role in predicting the level of caregiver burden among nurses working in ICU settings. In such high-stress environments, where emotional strain, critical decision-making, and frequent exposure to patient death are prevalent, managing these factors can serve as vital internal and protective resources in mitigating the adverse effects of chronic stress and occupational burnout. Therefore, these factors may serve as appropriate targets for clinical and organizational interventions. Implementing programs aimed at enhancing spirituality, organizing compassion fatigue management workshops, and strengthening coping skills grounded in hope could significantly reduce caregiver burden and improve the overall quality of care delivery. Moreover, given the cultural context of this study, where religious and collectivist values are prominent, these interventions should be culturally tailored to maximize their effectiveness. Future research should explore how such interventions can be adapted across different cultural and institutional settings.
5.2. Limitations
This study has several limitations. First, relying on self-report questionnaires may have introduced response bias. Second, the cross-sectional design limits causal interpretations, as it is unclear whether the identified factors are causes or consequences of caregiver burden; longitudinal studies are recommended to address this. Third, the lack of significant effects for some demographic variables may reflect sample size limitations or low subgroup diversity. Fourth, advanced analyses (e.g., mediation or moderation) were not applied, which could have revealed deeper relational patterns. Lastly, although factors like salary, staffing, and welfare services were not examined, the relative uniformity of organizational conditions in the study setting may have reduced their impact. Future research should explore these factors in more diverse healthcare environments.


