
1. Background
Type 1 diabetes is one of the most common endocrine and metabolic disorders of childhood, and its global prevalence continues to rise (1). Approximately 18% of new type 1 diabetes diagnoses occur in children younger than nine years old (2). Type 1 diabetes is a serious chronic condition, and individuals diagnosed in childhood are at increased risk of early complications, comorbidities, and premature mortality.
Currently, diabetes mellitus ranks as the fifth leading cause of death in Iran, as projected by the World Health Organization (WHO), though this prediction has materialized sooner than expected. According to WHO estimates, diabetes will become the fifth leading cause of death worldwide by 2030 (3). Clinical diagnosis of diabetes can be challenging, making it a relatively common yet often hidden childhood illness. Despite the availability of various insulin formulations for type 1 diabetes, the risk of serious complications and mortality remains high (2). Children with type 1 diabetes face multiple management challenges due to their dependence on parents, emotional instability, and difficulties with eating, sleeping, and physical activity. These challenges impose heavy demands on caregivers, leading to diabetes-related distress — particularly in the initial months after diagnosis. Evidence shows that mothers of children with type 1 diabetes experience elevated stress, which may undermine their caregiving capacity (4-7).
Many clinical programs for type 1 diabetes do not provide tailored education for young patients. Because of their unique developmental and psychosocial needs, parents — especially mothers — of young children are increasingly targeted for behavioral and educational interventions (2).
Adopting healthy lifestyles and behaviors is fundamental to achieving optimal well-being across all age groups. The WHO defines health promotion as the process of enabling individuals to increase control over and improve their health (8). Health promotion is considered a key tool in public health initiatives (9). A health-promoting lifestyle empowers individuals to reach optimal health and prevent illness. According to the health promotion model, these behaviors include adopting healthy habits that improve function and quality of life, thereby enabling healthcare providers to support sustainable, health-enhancing practices (10, 11). Health-promoting behaviors typically cover six dimensions: nutrition, physical activity, stress management, health responsibility, interpersonal relationships, and spiritual growth (8).
Lifestyle encompasses daily habits that influence health (12). A healthy lifestyle requires replacing unhealthy habits with beneficial behaviors. Enhancing social support also plays an important role in strengthening parent and child psychosocial adjustment (2).
Although the concept of health promotion has long been discussed in nursing, its definition remains under debate. Nevertheless, over 80% of chronic diseases, including diabetes, can be managed through health-promoting behaviors such as regular exercise, balanced nutrition, and adherence to medical treatment, all of which slow disease progression and reduce healthcare expenditure. Family caregivers — particularly mothers in countries like Iran — often neglect their own self-care; however, adopting these behaviors can enhance empowerment and self-efficacy. In this context, nurse-patient partnerships play a central role in promoting health and self-reliance by supporting individualized health plans (13-16).
A review of previous studies shows that caring for a child with type 1 diabetes is highly demanding. In most societies, especially in Middle Eastern countries, mothers serve as the primary caregivers (17, 18). Promoting health-enhancing behaviors can help these mothers adapt more effectively and provide better care for their children.
However, mothers of children with type 1 diabetes often face a heavy caregiver burden because of their child’s inability to self-manage and the lack of adequate caregiver education. Limited family support further compounds these challenges. The Healthy Lifestyle Empowerment Program (HLEP) is designed to strengthen caregivers’ skills and their adherence to health-promoting behaviors, yet its effectiveness among mothers of children with type 1 diabetes in Tehran has not been previously examined.
2. Objectives
This study aims to evaluate the effect of the HLEP on care burden and adherence to health-promoting behaviors in this population.
3. Methods
3.1. Study Design and Setting
This experimental study included control and intervention groups recruited from the Iranian Diabetes Association in Tehran, Iran.
3.2. Study Participants and Sampling
The study sample consisted of mothers of children with type 1 diabetes, with a confirmed diagnosis of at least six months and a maximum of two years, who visited the Iranian National Diabetes Association in 2024. Inclusion criteria for mothers included literacy, having a child under 12 years of age with a definitive diagnosis of diabetes for at least six months and a maximum of two years, no other chronic disease in the child, and no participation in another educational session during the past year. Exclusion criteria included the mother’s failure to participate in one of the educational sessions of the HLEP and the child’s occurrence of another chronic disease during the intervention.
Based on the study by Rostampour Brenjestanaki et al. in 2022, considering the mean social pressure of 11.7 ± 3.5 for the control group and 8.6 ± 3.5 for the intervention group, and assuming a minimum power of 80%, the sample size was determined to be 64 (32 in each group) (19). The sample size was calculated using STATA version 14, and the power analysis for this sample size was 97%. The final sample size accounted for a 30 percent dropout rate:
3.3. Data Collection Tool and Technique
The sample selection process was conducted in collaboration with the Iranian Diabetes Association. The principal investigator directly visited the Association in Tehran on specific days. After explaining the research method and purpose, mothers were invited to participate and provided written informed consent.
Participants were recruited from the Iranian Diabetes Association, with eligible mothers of children with type 1 diabetes invited to join upon their physician’s approval. After giving informed consent, 64 mothers meeting inclusion criteria were conveniently sampled and then randomly assigned to intervention (n = 32) and control (n = 32) groups.
For randomization, mothers were assigned numbers from 1 to 64 and allocated to groups based on the roll of a die: Odd numbers (1, 3, 5) were placed in the control group, and even numbers (2, 4, 6) in the intervention group.
Baseline data were collected on the child’s age, gender, and illness duration, as well as the mother’s age, education, and occupation. Adherence to health-promoting behaviors was assessed using the Health-Promoting Lifestyle Profile II (HPLP-II) Questionnaire before, immediately after, and 12 weeks post-intervention. The CONSORT flow chart is illustrated in Figure 1.
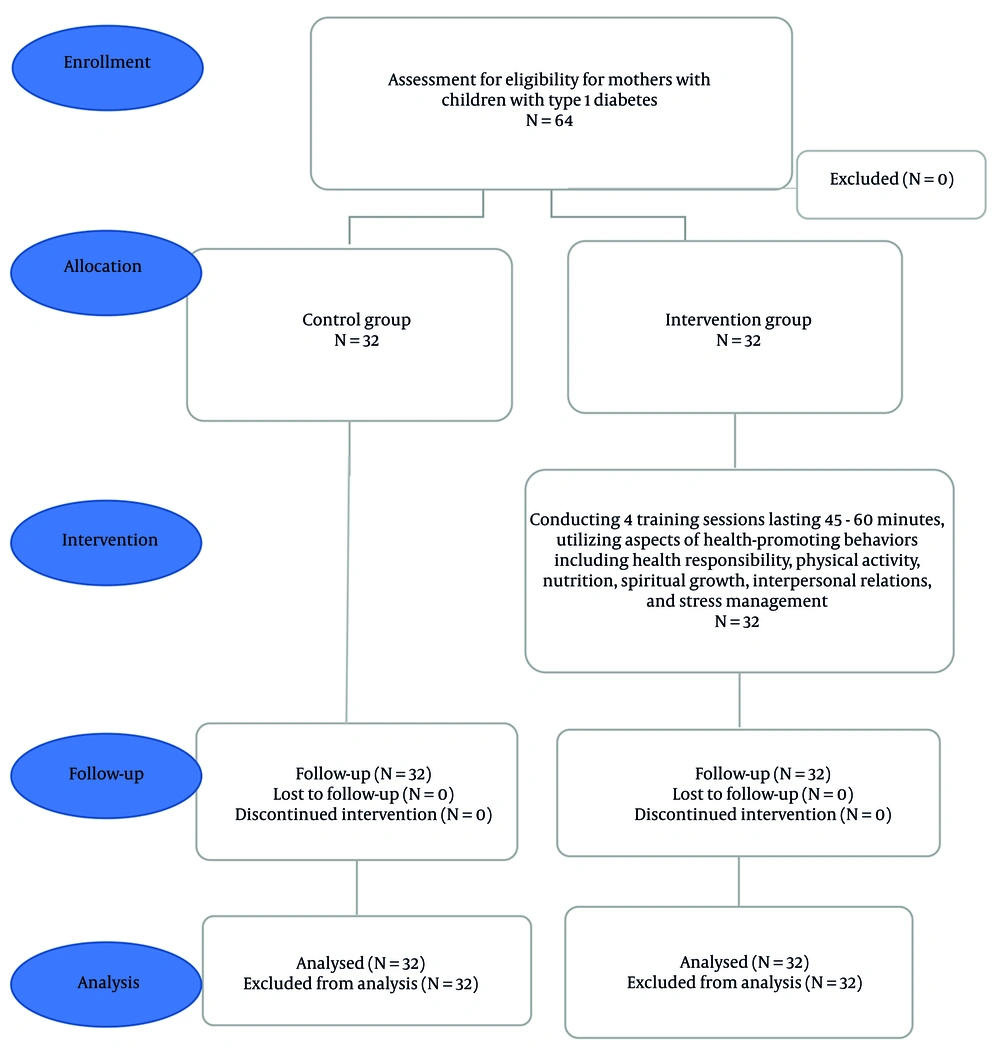
Figure 1.
CONSORT flow chart of the study
3.4. Health-Promoting Lifestyle Profile II Questionnaire
The HPLP-II Questionnaire was developed by Walker et al. in 1987 and contains 52 questions. Respondents choose one of four options on a Likert scale for each question. The questionnaire’s items are categorized into six areas: Responsibility (accepting responsibility for one’s health) with 12 questions; physical activity (measuring regular exercise patterns) with 7 questions; nutrition (assessing dietary patterns and choices) with 9 questions; spiritual growth (assessing the level of spiritual growth) with 11 questions; stress management (measuring the ability to cope with stress) with 8 questions; and interpersonal relationships (identifying effective communication) with 5 questions. The overall score range for a health-promoting lifestyle is 52 to 208, with higher scores indicating a better health-promoting lifestyle.
In 2020, Hossein Abbasi and Agha Amiri used the Health-Promoting Lifestyle Questionnaire to examine the relationship between health-promoting lifestyles and job satisfaction among male nurses in Ahvaz. The reliability of the questionnaire was estimated at 94% by Walker et al. (20). It was validated in Iran by Mohammadi Zeidi et al., reporting Cronbach’s alpha coefficients of 64% for spiritual growth, 86% for taking responsibility for health, 75% for interpersonal relationships, 91% for stress management, 79% for physical activity, 81% for nutrition, and 82% for the overall questionnaire. In this study, Cronbach’s alpha was 90% on a sample of 25 individuals, indicating good internal consistency (20).
3.5. Intervention
Weekly sessions of 45 - 60 minutes were conducted at the Iranian Diabetes Association using videos, PowerPoint presentations, brochures, and handouts by the principal investigator. The meetings were held in Tehran. Mothers’ adherence was monitored through weekly contacts. The educational content was reviewed and approved by the Iranian National Diabetes Association. The control group received routine training without the educational package and was contacted at weeks 1, 2, and 3 to ensure no lifestyle changes occurred. The content of the sessions is detailed in Table 1.
Table 1.
Healthy Lifestyle Empowerment Program for Mothers with Children with Type 1 Diabetes in the Intervention Group
| Sessions | Objectives | Content |
|---|---|---|
| 1 | Improving health-promoting behaviors in the aspect of health responsibility | |
| 2 | Improving health-promoting behaviors in the areas of physical activity and nutrition | Benefits of increasing the quantity and quality of physical activity, simple ways to increase physical activity, feasible exercise programs, principles of healthy nutrition and how to healthily cook consumed foods, avoiding the consumption of unsaturated fatty acids and preventing weight gain |
| 3 | Improving health-promoting behaviors in the areas of spiritual growth, interpersonal relationships, and stress management | The impact of prayer on physical and mental health, the role of spirituality in facilitating disease treatment, ways to achieve peace through worship, appropriate communication methods, the benefits of interpersonal relationships within the family, the definition of stress, the causes of stress, and teaching simple stress management techniques |
| 4 | Improving all aspects of health-promoting behaviors | Improvement of all aspects related to health-promoting behaviors: Reviewing all previous materials, Q&A to clarify ambiguities, providing educational handouts for better understanding, and presenting videos and clips regarding the taught materials |
3.6. Ethical Considerations
This study was conducted after receiving approval ID (IR.USWR.REC.1403.074) from the Research Ethics Committees. Participants gave written informed consent after being informed of the study’s purpose, procedures, benefits, risks, and confidentiality assurances.
3.7. Statistical Analysis
Data were analyzed using SPSS version 18 with a significance level of 0.05. Repeated measures analysis of variance was used to compare adherence to health-promoting behaviors between the two groups over time. Chi-square statistical tests, Fisher’s exact test for qualitative variables, and independent t-tests were also used.
4. Results
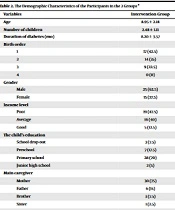
This study included 64 mothers of children with type 1 diabetes, equally divided into control and intervention groups (32 each). All participants completed the study, and their data were analyzed. Demographic characteristics are detailed in Table 2.
Table 2.
Frequency Distribution of the Personal Characteristics of Mothers of Children with Type 1 Diabetes in the Intervention and Control Groups a
| Patients’ Personal Information | Intervention Group | Control Group | Test Result (P-Value) |
|---|---|---|---|
| Gender | 0.611 | ||
| Boy | 18 (56.2) | 20 (62.5) | |
| Girl | 14 (43.8) | 12 (37.5) | |
| Total | 32 (100) | 32 (100) | |
| Age of patient (y) | 0.800 | ||
| Less than 9 | 19 (59.4) | 18 (54.5) | |
| 9 to 12 | 13 (40.6) | 14 (42.4) | |
| Total | 32 (100) | 32 (100) | |
| Duration of illness | 0.802 | ||
| 6 mo | 17 (53.1) | 18 (56.3) | |
| 6 mo to 5 y | 15 (46.9) | 14 (43.7) | |
| Total | 32 (100) | 32 (100) | |
| Mother’s age (y) | 0.865 | ||
| 15 to 25 | 6 (18.8) | 5 (15.6) | |
| 25 to 40 | 24 (75) | 24 (75) | |
| 40 to 55 | 2 (6.3) | 3 (9.4) | |
| Total | 32 (100) | 32 (100) | |
| Mother's occupation | 0.861 | ||
| Homeowner | 15 (25) | 14 (33.3) | |
| Employee | 12 (12.5) | 14 (12.1) | |
| Self-employed | 5 (6.2) | 4 (6.07) | |
| Total | 32 (100) | 32 (100) | |
| Mother's education level | 0.962 | ||
| Below associate degree | 7 (21.8) | 6 (18.8) | |
| Associate degree | 9 (28.1) | 8 (25) | |
| Bachelor's degree | 12 (37.5) | 12 (37.5) | |
| Master's degree | 3 (9.4) | 4 (12.5) | |
| Doctorate | 1 (3.1) | 2 (6.3) | |
| Total | 32 (100) | 32 (100) | |
| Family income (millionToman) | 0.871 | ||
| Between 20 to 30 | 18 (56.3) | 20 (62.5) | |
| Between 30 to 40 | 9 (28.1) | 8 (25) | |
| More than 40 | 5 (15.6) | 4 (12.5) | |
| Total | 32 (100) | 32 (100) | |
| Insurance | 1.00 | ||
| Yes | 31 (96.9) | 31 (96.9) | |
| No | 1 (3.1) | 1 (3.1) | |
| Total | 32 (100) | 32 (100) | |
| Supplementary insurance | 0.277 | ||
| Yes | 22 (68.8) | 20 (62.5) | |
| No | 10 (31.2) | 12 (37.5) | |
| Total | 32 (100) | 32 (100) |
a Values are expressed as No. (%).
Based on Table 2, most children with type 1 diabetes in the intervention group (56.2%) and the control group (62.5%) were boys, with no statistically significant difference between the two groups according to the chi-square test (P = 0.611). Almost all participants in both groups (96.9%) were insured. The majority of children in the intervention group (59.4%) and the control group (54.5%) were younger than nine years, with no significant difference between groups (P = 0.800). Regarding disease duration, most children in the intervention group (53.1%) and the control group (56.3%) had been diagnosed for approximately six months, and this difference was not statistically significant (P = 0.802). The majority of mothers in both groups (75%) were between 25 and 40 years old, with no significant difference in this variable (P = 0.865). Similarly, there was no significant difference between the two groups in terms of maternal employment status (P = 0.861). Based on Fisher’s exact test, there was no significant difference in mothers’ educational level (P = 0.962). Most families reported a monthly income between 20 and 30 million Toman in both the intervention (56.3%) and control (62.5%) groups, with no significant difference (P = 1.00). Additionally, 68.8% of participants in the intervention group and 62.5% in the control group had supplementary insurance.
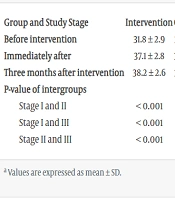
According to Table 3, before the intervention, there was no significant difference between the two groups in the mean score of the Health-Promoting Lifestyle Scale (P = 0.688). Immediately after the intervention, the intervention group showed a significantly higher mean score compared with the control group (P = 0.010), and this difference remained significant 12 weeks after the intervention (P = 0.027). Repeated-measures analysis showed a significant within-group change in the intervention group over time (P < 0.001), indicating a progressive increase in the mean health-promoting lifestyle score following the intervention.
Table 3.
| Variables | Pre-test | Post-test | After 12 Weeks | P-Value c |
|---|---|---|---|---|
| HPLP | ||||
| Intervention | 126.34 ± 20.12 | 132.87 ± 20.35 | 132.34 ± 20.24 | 0.00 |
| Control | 128.03 ± 12.48 | 120.59 ± 16.79 | 122.25 ± 14.93 | 0.017 |
| P-value d | 0.688 | 0.011 | 0.027 | - |
a Values are expressed as mean ± SD.
b Repeated measurements ANOVA.
c Paired t-test.
d Independent sample t-test.
5. Discussion
This study demonstrated that the HLEP effectively improved adherence to health-promoting behaviors among mothers of children with type 1 diabetes. The program also enhanced mothers’ attitudes, self-care behaviors, and child-care performance.
The results are consistent with previous research. Homayouni et al. (12) showed that empowerment-based interventions similar to the HLEP reduced caregiver burden and improved health-promoting behaviors among family caregivers of patients with multiple sclerosis. Similarly, Borges Rodrigues et al. (21) reported that empowering children and their families increased the effectiveness of health interventions and promoted participation in healthcare decisions, leading to more positive outcomes. Lok and Bademli (22) also found that health-promotion-based programs improved adherence to health-promoting behaviors among caregivers of individuals with dementia.
Health-promoting behaviors are crucial in preventing non-communicable diseases such as cancer, cardiovascular disorders, and diabetes, and access to accurate health information substantially influences their adoption (23). Empowerment — though still a challenging concept in terms of definition and measurement — serves as a valuable framework for promoting health and advancing women’s equity when applied contextually (24).
Conversely, some findings differ from the present results. Tandon et al. (25) found that a 12-month lifestyle intervention focused on diet and physical activity, despite incorporating individual, group, and remote components, did not prevent deterioration in glycemic status among women with recent gestational diabetes in South Asia. The authors suggested that additional preventive strategies, including pharmacological approaches, might be necessary for this high-risk group. Likewise, Singh et al. (26), in a systematic review, concluded that lifestyle modification programs that involve regular patient engagement over at least one year result in clinically significant weight loss and may reduce long-term mortality. However, shorter and less frequent interventions yield only moderate benefits, and evidence regarding cardiovascular and cancer population remains insufficient.
Overall, the findings of the current study suggest that a HLEP — particularly when it involves active family participation — can sustainably strengthen mothers’ engagement in health-promoting behaviors, thereby improving both their self-care and child-care capacity. Applying this approach in the management of chronic childhood illnesses may enhance the quality of family caregiving and adherence to healthy lifestyle practices.
5.1. Conclusions
In the Iranian context, the primary responsibility for managing the care of children with type 1 diabetes often rests with mothers, largely due to children’s limited capacity for self-care. This caregiving role imposes substantial physical and emotional demands that may adversely affect mothers’ own health and well-being.
The findings of this study indicate that the HLEP effectively enhances mothers’ adherence to health-promoting behaviors, supporting self-care and psychological well-being. These improvements may indirectly contribute to better management of the child’s condition and overall family health. Therefore, integrating structured empowerment and self-care programs into routine healthcare services is strongly recommended, particularly for mothers caring for children with chronic illnesses such as type 1 diabetes.
Demographically, most children with type 1 diabetes in both the intervention and control groups were boys, with an average age below nine years and a mean disease duration of approximately six months. The majority of participating mothers were between 25 and 40 years old. These characteristics reflect the population most likely to benefit from targeted empowerment programs that emphasize health-promoting behaviors and family-centered care.
5.2. Limitations and Recommendations
Despite significant results, this study has several limitations. Selection bias may exist, as participants voluntarily joined the program and might have been more motivated than non-participants. The sample was limited to mothers attending the Iranian Diabetes Association in Tehran, which may limit generalizability. Sample retention was challenging, but most mothers continued after the first session.