
1. Background
Day-case surgery is a clinical pathway in which carefully selected patients undergo planned, non-emergency procedures and are discharged on the same day and has become the dominant model of surgical delivery worldwide (1). This approach is driven by efforts to reduce healthcare costs, relieve hospital overcrowding, and minimise healthcare-associated infections and is now well established in developed healthcare systems (2). Recent evidence indicates that outpatient surgical procedures now exceed inpatient surgeries in volume (3). Despite these advantages, the rapid transition from hospital to home transfers responsibility for postoperative recovery to patients and their families. In contrast to inpatient care, patients undergoing day-case surgery must independently manage symptoms such as pain, nausea, and fatigue immediately after discharge (4). This shift may increase anxiety and discomfort, potentially compromising overall quality of recovery (QoR) (5), and has expanded the nursing role from immediate safety monitoring to discharge education and self-management support. Patient-reported assessment of recovery is essential to ensure safety and a timely return to normal function. The Quality of Recovery-15 (QoR-15) is a globally validated patient-reported outcome measure that evaluates multidimensional recovery following anesthesia and surgery (6). In Vietnam, day-case surgery is rapidly expanding across provincial and central hospitals to address substantial patient overload, particularly for carefully selected procedures such as hemorrhoidectomy, minor orthopaedic surgery, plastic surgery, and some thoracic or vascular procedures (7). However, evidence on postoperative QoR among day-case surgery patients remains limited.
2. Objectives
This prospective observational study, conducted in 2024, aimed to assess perioperative QoR in adult patients undergoing day-case surgery in Vietnam and to identify demographic and clinical factors associated with postoperative recovery.
3. Methods
3.1. Study Design and Setting
This prospective observational study was conducted at the Day Surgery Unit of the University Medical Center Ho Chi Minh City, Vietnam, from August to December 2024. The study protocol was approved by the institutional ethics committee.
3.2. Participants
Adult patients scheduled for day-case surgery, including orthopedic, thoracic and vascular, plastic, urologic, neurosurgical, oral and maxillofacial, and abdominal procedures, were identified through daily screening of the surgical schedule and were consecutively approached for participation during the study period until the required sample size was achieved. Eligible patients were recruited preoperatively by the research team and provided written informed consent before data collection. Inclusion criteria were: (1) age ≥ 18 years; (2) Vietnamese nationality; (3) scheduled for a day-case surgical procedure; (4) ability to communicate effectively; and (5) provision of written informed consent. Patients were excluded from the final analysis if they required unplanned overnight admission or were lost to follow-up at 24 hours after discharge. The sample size was calculated to estimate the mean postoperative QoR-15 score. Based on a standard deviation of 17 points, a 95% confidence level (Z = 1.96), and a margin of error of two points, the minimum required sample size was 278 patients. A larger sample was targeted to account for potential dropouts (8).
3.3. Quality of Recovery
Quality of recovery was assessed using the Vietnamese version of the QoR-15, a 15-item patient-reported outcome measure scored on an 11-point scale (0 - 10). The questionnaire includes five domains: physical comfort, emotional state, physical independence, psychological support, and pain, with a total score ranging from 0 to 150. Five negatively worded QoR-15 items (moderate pain, severe pain, nausea or vomiting, feeling worried or anxious, and feeling sad or depressed) were reverse-scored before summing the total score. Recovery was categorised as excellent (136 - 150), good (122 - 135), moderate (90 - 121), or poor (≤ 89). Domain- and item-level recovery deficits were calculated as the percentage shortfall from the optimal score (9).
3.4. Data Collection
Data were collected at three time points. Patients received routine perioperative care according to the day-case surgery pathway of the study hospital. Anaesthesia and perioperative management were determined by the attending clinical team based on the type of surgery and patient condition. Preoperatively, baseline sociodemographic and clinical characteristics, American Society of Anesthesiologists (ASA) physical status, comorbidities, and baseline QoR-15 scores were obtained through face-to-face interviews. Intraoperative and postoperative data, including type of surgery, anaesthesia technique, incision type, and analgesics prescribed after discharge, were extracted from electronic medical records. Postoperative assessment was performed 24 hours (± 4 hours) after surgery via telephone interview, during which the QoR-15 questionnaire and Numerical Rating Scale (NRS) for pain were administered. Patients who could not be contacted at follow-up were excluded from the final analysis.
3.5. Statistical Analysis
Statistical analyses were performed using R software (version 4.3.2). Continuous variables were summarized as mean ± standard deviation (SD) or median with interquartile range (IQR), as appropriate, while categorical variables were presented as frequencies and percentages. Data normality was assessed using graphical methods and the Kolmogorov–Smirnov test. Comparisons between preoperative and postoperative QoR-15 scores were performed using paired t-tests or Wilcoxon signed-rank tests, as appropriate. Changes in categorical recovery levels were analysed using the Stuart-Maxwell test. Associations between postoperative QoR-15 scores and continuous variables, including surgical duration and postoperative pain scores, were assessed using Spearman’s correlation. Comparisons of postoperative QoR-15 scores across demographic and clinical subgroups were conducted using independent t-tests, one-way ANOVA, or their non-parametric equivalents, as appropriate. A two-sided P-value < 0.05 was considered statistically significant.
4. Results
4.1. Participant Characteristics
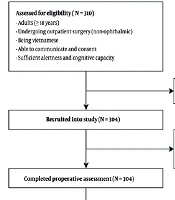
Between August and December 2024, 310 patients were screened for eligibility. Of these, 297 completed the study and were included in the final analysis. Thirteen patients were excluded due to unplanned overnight admission (n = 6) or loss to follow-up at 24 hours (n = 7) (Figure 1).

Figure 1.
Flowchart of participant recruitment and follow-up
The median age of participants was 45 years, with 79.4% younger than 60 years. Females accounted for 71.0% of the study population. Most patients were classified as ASA physical status I (45.8%) or II (47.1%) (Table 1).
Table 1.
Baseline Demographics of Study Participants (N = 297)
| Demographics | No (%) |
|---|---|
| Age group | |
| < 40 | 115 (38.7) |
| 40 - 60 | 121 (40.7) |
| > 60 | 61 (20.6) |
| Gender | |
| Female | 211 (71.0) |
| Male | 86 (29.0) |
| Occupation | |
| Office worker | 60 (20.2) |
| Student | 14 (4.7) |
| Trader | 111 (37.4) |
| Farmer | 22 (7.4) |
| Worker | 15 (5.1) |
| Housekeeper | 58 (19.5) |
| Retired | 17 (5.7) |
| Educational level | |
| Literate | 8 (2.7) |
| Primary school | 33 (11.1) |
| Lower secondary school | 84 (28.3) |
| High school | 60 (20.2) |
| University | 104 (35.0) |
| Postgraduate | 8 (2.7) |
| Marital status | |
| Single | 57 (19.2) |
| Living with spouse | 207 (69.7) |
| Separated / Divorced | 12 (4.0) |
| Widowed | 21 (7.1) |
| Economic status | |
| Financially independent | 232 (78.1) |
| Dependent on family | 65 (21.9) |
| Primary caregiver | |
| Parents | 40 (13.5) |
| Spouse | 148 (49.8) |
| Child | 77 (25.9) |
| Sibling | 16 (5.4) |
| Friend | 10 (3.4) |
| Others | 6 (2.0) |
| Comorbidities | |
| Hypertension | 61 (20.5) |
| Diabetes | 19 (6.4) |
| Asthma | 4 (1.3) |
| ASA physical status | |
| ASA I | 136 (45.8) |
| ASA II | 140 (47.1) |
| ASA III | 21 (7.1) |
Orthopaedic surgery (35.4%), thoracic and vascular surgery (28.6%), and plastic surgery (22.6%) were the most frequent procedures. General anaesthesia was used in 61.3% of cases, while local or regional techniques were applied in 38.7%. The median duration of surgery was 40 minutes. At discharge, nearly all patients received paracetamol, with non-steroidal anti-inflammatory drugs (NSAIDs) (ibuprofen, diclofenac, celecoxib, meloxicam) prescribed in 68.4% and opioids (tramadol, codeine) in 10.8% (Table 2).
Table 2.
Intraoperative and Postoperative Interventions on Study Participants (N = 297) a
| Characteristics | Values |
|---|---|
| Type of surgery | |
| Orthopedic surgery | 105 (35.4) |
| Thoracic and vascular surgery | 85 (28.6) |
| Plastic surgery | 67 (22.6) |
| Urologic surgery | 17 (5.7) |
| Neurosurgery | 16 (5.4) |
| Oral and maxillofacial surgery | 5 (1.7) |
| Abdominal surgery | 2 (0.7) |
| Duration of surgery | 40 (26 - 60); (10 - 180) |
| Type of incision | |
| Puncture wound | 16 (5.4) |
| Endoscopic incision | 34 (11.4) |
| Open incision | 247 (83.2) |
| Type of anesthesia | |
| Local or regional anesthesia | 115 (38.7) |
| Intravenous anesthesia | 3 (1.0) |
| Laryngeal Mask Airway anesthesia | 108 (36.4) |
| Endotracheal intubation anesthesia | 71 (23.9) |
| Analgesics after discharge | |
| Paracetamol | 296 (99.7) |
| Non-steroidal anti-inflammatory drugs (NSAIDs) | 203 (68.4) |
| Opioids | 32 (10.8) |
a Values are as expressed as No. (%) or median (IQR); (min-max).
4.2. Overall Quality of Recovery
The overall QoR-15 score declined significantly from a preoperative median of 145 to a postoperative median of 139 (P < 0.001). Despite this decline, the proportion of patients achieving good or excellent recovery remained high, decreasing slightly from 99.7% preoperatively to 98.0% postoperatively.
4.3. Domain-Specific Recovery
At 24 hours postoperatively, four QoR-15 domains showed significant deterioration compared with baseline: physical comfort, physical independence, psychological support, and pain (all P < 0.001). In contrast, the emotional state domain improved significantly after surgery (P < 0.001).
4.4. Postoperative Pain
Postoperative pain scores ranged from 2 to 6, with a mean NRS score of 3.3 (SD 0.8). Most patients reported mild pain (66.7%), while 33.3% experienced moderate pain.
4.5. Factors Associated with Postoperative Recovery
Postoperative total QoR-15 scores were significantly associated with educational level (P = 0.004), type of surgery (P < 0.001), and type of anaesthesia (P = 0.006). Patients undergoing thoracic and vascular surgery and those receiving local or laryngeal mask airway anaesthesia demonstrated higher recovery scores. No significant associations were observed with age, sex, BMI classification, ASA physical status, or comorbidities (Table 3 and Table 4). Postoperative pain showed a strong negative correlation with postoperative total QoR-15 score (rₛ = -0.69, P < 0.001), whereas surgical duration was not significantly correlated with recovery outcomes (Table 5).
Table 3.
Relation Between Total Quality of Recovery and Baseline Characteristics
| Items | No (%) | Postoperative total QoR a | P-Value |
|---|---|---|---|
| Age group | 0.932 | ||
| < 40 | 115 (38.7) | 138.3 ± 6.6 | |
| 40 - 60 | 121 (40.7) | 138.7 ± 6.1 | |
| > 60 | 61 (20.6) | 138.9 ± 4.8 | |
| Gender | 0.590 | ||
| Male | 86 (29.0) | 139.0 ± 5.0 | |
| Female | 211 (71.0) | 138.4 ± 6.4 | |
| Occupation | 0.052 | ||
| Office worker | 60 (20.2) | 139.5 ± 6.4 | |
| Student | 14 (4.7) | 135.5 ± 5.9 | |
| Trader | 111 (37.4) | 139.1 ± 5.6 | |
| Farmer | 22 (7.4) | 140.9 ± 4.1 | |
| Worker | 15 (5.1) | 137.1 ± 6.7 | |
| Housekeeper | 58 (19.5) | 137.4 ± 7.4 | |
| Retired | 17 (5.7) | 139 ± 5.6 | |
| Educational level | 0.004 b | ||
| Literate | 8 (2.7) | 136.5 ± 5.2 | |
| Primary school | 33 (11.1) | 136.8 ± 6.1 | |
| Lower secondary school | 84 (28.3) | 137.9 ± 5.1 | |
| High school | 60 (20.2) | 138.7 ± 7.5 | |
| University | 104 (35.0) | 138.8 ± 5.8 | |
| Postgraduate | 8 (2.7) | 144.5 ± 2.4 | |
| Marital status | 0.708 | ||
| Single | 57 (19.2) | 138.3 ± 6.9 | |
| Living with spouse | 207 (69.7) | 138.8 ± 5.8 | |
| Separated/divorced | 12 (4.0) | 136.6 ± 8.3 | |
| Widowed | 21 (7.1) | 138.5 ± 4.8 | |
| Primary caregiver | 0.729 | ||
| Parents | 40 (13.5) | 138.9 ± 5.3 | |
| Spouse | 148 (49.8) | 138.6 ± 6.2 | |
| Child | 77 (25.9) | 138.8 ± 4.7 | |
| Sibling | 16 (5.4) | 137.3 ± 8.0 | |
| Friend | 10 (3.4) | 133.5 ± 14.2 | |
| Others | 6 (2.0) | 140.7 ± 5.7 |
Abbreviation: QoR, quality of recovery.
a Values are as expressed as mean ± SD.
b P ≤ 0.05 statistically significant.
Table 4.
Relation Between Postoperative Total Quality of Recovery and Medical Data
| Items | No (%) | Postoperative total QoR a | P-Value |
|---|---|---|---|
| BMI classification | 0.283 | ||
| Underweight | 18 (6.1) | 137.1 ± 9.9 | |
| Normal | 150 (50.5) | 138.0 ± 6.3 | |
| Overweight | 59 (19.9) | 139.9 ± 4.1 | |
| Obesity | 70 (23.5) | 139.0 ± 5.5 | |
| ASA physical status | 0.35 | ||
| ASA I | 136 (45.8) | 138.5 ± 6.2 | |
| ASA II | 140 (47.1) | 138.8 ± 6.2 | |
| ASA III | 21 (7.1) | 138 ± 3.8 | |
| Comorbidities | |||
| Hypertension | 61 (68.5) | 138.6 ± 6.3 | 0.75 |
| Diabetes | 19 (21.3) | 137.5 ± 5.2 | 0.220 |
| Asthma | 4 (4.5) | 138.3 ± 6.4 | 0.83 |
| Type of surgery | < 0.001 b | ||
| Orthopedic surgery | 105 (35.4) | 137.2 ± 6.1 | |
| Thoracic and vascular surgery | 85 (28.6) | 140.4 ± 4.7 | |
| Plastic surgery | 67 (22.6) | 139.2 ± 7.3 | |
| Urologic surgery | 17 (5.7) | 139.4 ± 3.1 | |
| Neurosurgery | 16 (5.4) | 134.9 ± 6.5 | |
| Oral and maxillofacial surgery | 5 (1.7) | 137.6 ± 3.8 | |
| Abdominal surgery | 2 (0.7) | 138.0 ± 1.4 | |
| Type of anesthesia | 0.006b | ||
| Local or regional anesthesia | 115 (38.7) | 139.1 ± 5.8 | |
| Intravenous anesthesia | 3 (1.0) | 137.3 ± 11.5 | |
| Laryngeal Mask Airway anesthesia | 108 (36.4) | 139.5 ± 5.4 | |
| Endotracheal intubation anesthesia | 71 (23.9) | 136.4 ± 6.7 | |
| Analgesics after discharge | |||
| Paracetamol | 296 (99.7) | 138.6 ± 6.0 | 0.085 |
| NSAIDs | 203 (68.4) | 138.4 ± 6.5 | 0.518 |
| Opioids | 32 (10.8) | 134.3 ± 6.7 | 0.475 |
Abbreviation: QoR, quality of recovery.
a Values are as expressed as mean ± SD.
b P ≤ 0.05 statistically significant.
Table 5.
Correlation Between Postoperative Total Quality of Recovery and Surgery Duration and Postoperative Pain Score
| Items | 1 | 2 | 3 |
|---|---|---|---|
| 1. Postoperative total QoR | - | ||
| 2. Surgery duration | -0.01 | - | |
| 3. Postoperative pain score | -0.69 a | 0.02 | - |
| Median | 139 | 40 | 3 |
Abbreviation: QoR, quality of recovery.
a P-value for Spearman’s correlation < 0.001.
5. Discussion
This study provides evidence on early postoperative recovery among day-case surgery patients in Vietnam. In Vietnam, perioperative outcome data remain limited, and available studies have mainly focused on major inpatient surgery. A recent Vietnamese pre-ERAS study also underscored the role of multimodal pain relief and perioperative physical therapy in improving postoperative outcomes (10). Overall QoR declined significantly within 24 hours after surgery; however, most patients continued to achieve good or excellent recovery. This finding is consistent with the study by Chazapis et al., who found that QoR-15 scores decreased significantly at 24 hours after day-case orthopaedic surgery, returned to preoperative levels by 48 hours, and exceeded baseline values by postoperative day 7 (11).
This pattern suggests that early QoR deterioration is usually transient and likely reflects the immediate effects of surgery and anaesthesia, particularly pain, physical discomfort, reduced independence, and temporary limitations in usual activities. The observed reduction in the total QoR-15 score from 145 to 139 approached the minimal clinically important difference (MCID) of 6 - 8 points but should be interpreted in the context of a notably high preoperative baseline in this predominantly healthy cohort (ASA I–II) (12). For such patients, maintenance of functional recovery rather than absolute score improvement may represent the primary clinical goal. Confessor de Sousa et al. reported no significant change in QoR-15 scores after outpatient laparoscopic cholecystectomy, with 75% of patients achieving good or excellent recovery (13). Although postoperative recovery was preserved in both studies, the higher proportion of favourable recovery in our study (98%) may be explained by higher baseline QoR scores, supporting the influence of preoperative recovery status on postoperative outcomes. Compared with reports from other developing countries, including Colombia and India, where postoperative QoR-15 scores were substantially lower (14, 15), our findings suggest that careful patient selection and specialised perioperative care in a tertiary Vietnamese centre may contribute to superior early recovery outcomes. Consistent with previous literature, physical domains of recovery — including physical comfort, physical independence, and pain—deteriorated significantly within 24 hours after surgery (6, 12, 16).
These findings reflect the expected physiological stress of surgery and anaesthesia, leading to postoperative pain, reduced mobility, and discomfort. Similar reductions in physical independence have been reported in outpatient surgery cohorts (13). Although most patients in our study reported only mild to moderate pain, the significant decline in the pain domain score underscores the need for continued optimisation of postoperative analgesic strategies. In contrast, emotional state improved significantly after surgery, despite concurrent physical deterioration. This paradoxical finding has also been observed in previous studies (13) and may be explained by Response Shift Theory (RST), which posits that major health events can recalibrate patients’ internal standards, values, and perceptions of well-being (17, 18). The successful completion of surgery and safe discharge may alleviate preoperative anxiety and uncertainty, resulting in emotional relief and improved psychological resilience. Preoperative anxiety has been widely recognised as a key determinant of postoperative recovery, and its resolution may contribute substantially to early emotional improvement (19).
Postoperative pain levels in this study were relatively low, with a mean NRS score of 3.3, which may facilitate early mobilisation and resumption of daily activities (20). Effective pain management through pharmacological and supportive strategies likely contributed to improved comfort and emotional well-being, reinforcing the critical role of postoperative pain control in enhancing overall recovery quality. Educational level emerged as a significant predictor of postoperative QoR, consistent with previous studies demonstrating poorer recovery outcomes among patients with lower educational attainment (21, 22). Higher educational levels may enhance patients’ ability to understand postoperative instructions, adhere to recovery plans, and engage proactively in symptom management (23). These findings highlight the importance of identifying patients with lower educational backgrounds and providing tailored discharge education using simplified language, visual aids, or multimedia resources to promote equitable recovery outcomes. Type of anaesthesia was also significantly associated with postoperative recovery, with higher QoR scores observed among patients receiving local or laryngeal mask airway anaesthesia compared with endotracheal general anaesthesia. This finding is also consistent with a prospective observational study in day-case surgery, which highlighted the importance of anaesthetic strategy in influencing perioperative outcomes and recovery (24). This finding aligns with previous evidence indicating poorer recovery following endotracheal intubation (25). Endotracheal anaesthesia may be associated with postoperative sore throat, hoarseness, coughing, and airway discomfort, which can negatively affect postoperative comfort and recovery domains related to eating and drinking (26). In contrast, less invasive airway management techniques may reduce respiratory complications and facilitate faster emergence and recovery (27).
These findings suggest that nurses should provide targeted monitoring and supportive care for patients undergoing endotracheal intubation. Type of surgery was another significant factor influencing postoperative recovery. Patients undergoing thoracic and vascular or plastic surgery demonstrated better recovery outcomes than those undergoing orthopaedic procedures, consistent with previous reports (28). Orthopaedic surgery is often associated with higher pain intensity and reduced mobility, contributing to prolonged recovery (29). Finally, postoperative pain showed a strong negative correlation with overall recovery, indicating that patients experiencing greater pain were less likely to mobilise and resume normal activities, leading to delayed recovery. This finding is consistent with previous studies reporting pain as a major determinant of postoperative dissatisfaction and impaired recovery (9, 30, 31). From a nursing perspective, these findings emphasise the importance of targeted perioperative care, particularly optimised pain management, enhanced discharge education for patients with lower educational levels, and focused support for those receiving endotracheal general anaesthesia. In addition, interventions aimed at improving preoperative emotional resilience and patients’ self-management capacity may further enhance recovery outcomes in resource-limited settings. Although several demographic and clinical variables were analysed in relation to postoperative QoR-15 scores, the present study primarily relied on univariate analyses to explore these associations. In addition, because participants were recruited from a tertiary day-case surgery unit, some degree of selection bias related to discharge eligibility, procedure type, and scheduling may have occurred. Consequently, the potential influence of residual confounding factors cannot be completely excluded. Future studies using multivariable analytical models are warranted to better clarify the independent contributions of perioperative factors to postoperative recovery in day-case surgery populations.
5.1. Conclusions
In this prospective study of Vietnamese day-case surgery patients, postoperative early QoR showed a statistically significant decline compared with baseline, although most patients still achieved good or excellent recovery. Changes in recovery were mainly observed in physical independence and pain-related domains, while emotional state improved postoperatively. Educational level, type of anesthesia, type of surgery, and postoperative pain were identified as significant factors associated with postoperative QoR.