1. Background
Breast cancer is the most commonly diagnosed cancer worldwide, with an estimated 2.26 million new cases reported annually, accounting for 11.7% of all new cancer diagnoses (1). Advances in breast cancer screening and therapeutic management have substantially improved patient survival; however, patients receiving chemotherapy often experience persistent psychological challenges. Prolonged treatment, severe adverse effects, and financial burden contribute to anxiety, depression, fear, and self-blame, which significantly compromise quality of life (QoL) and psychological recovery (2, 3).
In recent years, attention has shifted from reducing negative psychological symptoms to enhancing positive psychological adaptation. Key constructs in this domain include psychological resilience and posttraumatic growth (PTG). Resilience, defined as the ability to adapt positively to adversity, has been associated with reduced anxiety and depression, improved treatment adherence, and enhanced well-being (4-6). Moreover, resilience may facilitate PTG by helping individuals reframe traumatic experiences and find meaning in adversity (7). PTG, defined as positive psychological change following struggle with highly challenging circumstances, is often observed at moderate levels in patients with breast cancer (8, 9), but can be enhanced through targeted interventions (10). In addition, meaning in life (MIL), defined as the perception of purpose and coherence, has emerged as a protective factor associated with lower psychological distress and greater emotional stability (11, 12).
However, most psychosocial interventions remain focused on symptom reduction rather than cultivating positive outcomes. Internationally, mindfulness-based and acceptance and commitment therapies have demonstrated benefits (13, 14); however, in China, psychological care remains underdeveloped. Although existing studies have confirmed that psychological interventions can effectively reduce anxiety and depression in patients with cancer (15-17), most remain symptom-focused. Few studies have progressed to developing or evaluating structured, theory-driven interventions (15, 18, 19). Given the evolving patient-centered care model and the integration of humanistic and scientific approaches in nursing, there is an urgent need for interventions that foster positive psychological transformation.
Narrative nursing, a structured, person-centered psychological intervention, offers a promising approach to address this gap (20, 21). Grounded in narrative therapy principles, it facilitates the externalization of problems, the reconstruction of personal meaning, and the rediscovery of individual strengths (22). Preliminary evidence from narrative-based interventions in oncology, including telephone-delivered narrative programs for patients with advanced cancer (23) and targeted narrative nursing interventions that improve emotional processing and resilience in cancer cohorts (24), suggests the potential to enhance emotional adaptation. However, empirical studies evaluating the efficacy of narrative nursing in improving resilience and PTG among patients with breast cancer undergoing chemotherapy remain scarce.
2. Objectives
This study aimed to determine the short-term effects of a nurse-led narrative intervention on psychological resilience (the primary outcome) and on PTG and MIL (secondary outcomes) in breast cancer patients receiving chemotherapy.
3. Methods
3.1. Study Design
This single-center, parallel-group randomized controlled trial (ChiCTR2500095635) was conducted in the oncology department of a Grade A tertiary hospital in the Inner Mongolia Autonomous Region, China, from May 15, 2025 to August 31, 2025. The study was conducted in accordance with the CONSORT guidelines (25).
3.2. Participants
Women diagnosed with breast cancer and receiving postoperative chemotherapy were recruited from the oncology department of the participating tertiary hospital during the study period. The inclusion criteria were as follows: (1) histopathologically confirmed stage I–III breast cancer; (2) age 20 - 65 years; (3) scheduled to receive at least 3 consecutive cycles of chemotherapy at the study site; (4) no planned radiotherapy during the intervention period; (5) awareness of their diagnosis; (6) hospitalization for at least 3 days; and (7) ability to read and write. The age range of 20 - 65 years was prespecified as an eligibility criterion to include adult women and reduce age-related clinical and psychosocial heterogeneity. The exclusion criteria were as follows: (1) presence of major comorbidities; (2) impaired consciousness, cognitive dysfunction, communication barriers, or psychiatric disorders; and (3) participation in other ongoing clinical trials or receipt of ongoing psychological counseling or psychotherapy. The withdrawal criteria were as follows: (1) discontinuation of chemotherapy at the study hospital for any reason; (2) missing two or more intervention sessions; or (3) voluntary withdrawal from the study.
3.3. Sample Size
The sample size was estimated using a two-sample mean comparison formula, with psychological resilience specified as the primary outcome (26), as follows:
Here, n1 and n2 represent the required numbers of participants in the intervention and control groups, respectively; δ represents the between-group difference in mean scores; and σ represents the standard deviation of the outcome variable. Zα/2 refers to the standard normal value corresponding to the two-sided significance level, whereas Zβ corresponds to the desired statistical power. Based on α = .05, power = 90.0%, Zα/2 = 1.96, Zβ = 1.28, δ = 10.34, and σ = 11.65, the estimated minimum sample size was 27 participants per group (27). Allowing for a 20.0% attrition rate, we aimed to recruit 68 participants in total, with 34 participants in each group.
3.4. Randomization
All eligible patients (n = 68) were numbered sequentially according to the order of hospital admission. A corresponding list of 68 unique random numbers was generated using a random number table (starting from row 16, column 11) and assigned to patients. These numbers were sorted in descending order. With equal allocation, the 68 eligible participants were assigned to two study arms: 34 to the narrative nursing group and 34 to the control group.
A statistician independent of the study team generated the randomization list. Allocation concealment was ensured by placing group assignments in sequentially numbered, sealed, opaque envelopes. The study coordinator opened the next envelope only after participant enrollment. Given the interactive nature of the narrative nursing program, blinding of participants and intervention nurses was not feasible. However, outcome evaluation and statistical analysis were conducted by personnel who were not informed of participants’ group assignments.
3.5. Intervention
3.5.1. Intervention Fidelity and Quality Control
All intervention providers completed a six-week standardized training program covering narrative nursing principles, communication skills, role-play simulations, and supervised practice. Only providers who passed competency assessments were qualified to deliver the intervention. During the study, intervention fidelity was monitored through random audits, supervision meetings, and case-note review. Any deviations from the intervention manual were documented, discussed during supervision, and corrected to maintain consistency across sessions and participants.
The intervention was delivered using a brief manual and session-specific adherence checklists. Participant-level adherence was recorded after each face-to-face session. The checklist documented whether the session was completed, session duration, whether the core narrative tasks were delivered, whether a family member or other significant support person participated in the witnessing component of Session 3 when feasible, and whether a therapeutic document was provided. Participants who missed two or more narrative sessions were considered to have received an insufficient intervention dose and met the withdrawal criterion specified in the protocol. All participants included in the final analysis completed the intended three-session intervention dose.
3.5.2. Control Group
The control group received routine psychological care, including admission orientation, education on breast cancer and treatment side effects, coping strategies, and dietary guidance. Nurses monitored patients’ psychological status, provided emotional support using active listening, and addressed common concerns such as fear of recurrence and body image. At discharge, patients received personalized follow-up instructions.
3.5.3. Narrative Nursing Group
Participants in the narrative nursing group received the same routine psychological care as the control group, supplemented with a nurse-led narrative intervention program. The narrative nursing intervention was implemented by a multidisciplinary team comprising a clinical psychologist, head nurse, oncology physician, oncology nurse specialist, primary nurses, and a graduate research assistant. Trained oncology nurses conducted all face-to-face sessions, the psychologist provided supervision, and the research assistant coordinated scheduling and documentation.
The program comprised three individual face-to-face sessions, each lasting 30 - 60 minutes, delivered once during each of chemotherapy cycles 1 - 3. Sessions were conducted in a private counseling room whenever feasible or at the bedside when clinical conditions required.
A brief manual, developed with reference to narrative therapy principles and previous cancer-related narrative intervention studies, guided the three sessions (23, 28). It outlined the objectives, procedures, guiding questions, and documentation requirements for each session. The intervention progressed from naming and externalizing the patient’s main concern, to exploring and re-authoring the problem story, and finally to reinforcing preferred meanings through external-witness responses and therapeutic documentation.
Session 1, delivered during the first chemotherapy cycle, focused on rapport building and externalizing the patient’s main concern. At the beginning of the session, the nurse explained the purpose and process of the narrative conversation. Patients were then guided to discuss their diagnosis and treatment experiences, family circumstances, educational background, and sources of social support, and to identify the most distressing issue they faced during chemotherapy. They were subsequently encouraged to name this concern and explore how it affected their emotions, daily life, interpersonal relationships, and treatment experience. Guiding questions included: “What worries you most during chemotherapy?”, “Which concern affects you the most?”, and “How has this problem influenced your mood and daily life?”
Session 2, delivered during the second chemotherapy cycle, focused on deconstructing and re-authoring the problem story. The nurse helped the patient examine when the named problem appeared, which factors aggravated or relieved it, and how it affected self-perception, relationships, and confidence in treatment. The conversation then shifted to identifying overlooked coping experiences, personal strengths, and exception events. Patients were guided to recall previous difficulties they had overcome, the resources they used, and the personal qualities that supported them. Guiding questions included: “When does this problem usually become stronger or weaker?”, “Have you faced similar difficulties before?”, “What helped you overcome them?”, and “What strengths did you use at that time that may also help you now?” This session was designed to support patients in reshaping their self-understanding and enhancing their confidence in managing chemotherapy-related challenges.
Session 3, delivered during the third chemotherapy cycle, focused on affirming growth, reconstructing identity, and involving an external witness. A significant support person, usually a family member identified by the patient, was invited to participate when feasible. The nurse guided the patient to review the concerns, strengths, coping progress, and meaningful changes identified during the previous sessions. The external witness was then invited to listen and respond to the patient’s story using a structured narrative process of telling, retelling, and retelling. Guiding questions for the witness included: “Which part of her story impressed you most?”, “What came to mind when you heard this experience?”, and “What changes have you noticed in her during treatment?” At the end of the session, the nurse summarized the patient’s progress and provided a brief therapeutic document, such as a handwritten affirmation card or supportive message, highlighting the patient’s strengths, coping efforts, and positive changes.
Between chemotherapy cycles, participants in both groups received routine follow-up contacts via WeChat or telephone. Four contacts were scheduled in total, specifically 1 - 2 days after discharge and 1 - 2 days before the next chemotherapy cycle. These contacts were used to assess the patient’s general condition, answer routine care questions, and provide guidance for discomfort or unexpected problems. In the narrative nursing group, follow-up contacts did not replace the face-to-face narrative sessions and were not used to deliver additional structured narrative therapy; rather, they supported continuity of care and helped maintain attendance at the scheduled sessions.
3.6. Instruments
Baseline demographic and clinical characteristics were collected using a structured questionnaire. Psychological resilience, PTG, and MIL were assessed at admission and after completion of the third chemotherapy cycle using standardized instruments.
3.6.1. Baseline Characteristics Questionnaire
The questionnaire comprised two domains: (1) sociodemographic information — age, ethnicity, education, marital status, occupational category, employment status, per capita household income, number of children, and primary inpatient caregiver; and (2) clinical-related information — payment source for medical expenses, type of surgery received, disease duration, recurrence status (presence or absence), and disease stage.
3.6.2. Connor-Davidson Resilience Scale (CD-RISC)
Psychological resilience was assessed using the Chinese version of the CD-RISC, originally developed by Connor and Davidson and cross-culturally adapted by Yu and Zhang (29). This 25-item scale measures an individual's capacity to "bounce back" from traumatic events. Scores range from 0 to 100, with higher values indicating stronger psychological resilience: 0 - 56 indicates low resilience, 57 - 70 indicates moderate resilience, and 71 - 100 indicates high resilience. The Chinese version has been validated in Chinese populations and demonstrated acceptable internal consistency in previous studies (Cronbach’s α = 0.91) (29).
3.6.3. Posttraumatic Growth Inventory (PTGI)
PTG was assessed using the Chinese version of the PTGI, originally developed by Tedeschi and Calhoun and adapted by Wang et al. (30). This version includes 20 items after removal of item 18 from the original inventory and covers five dimensions: appreciation of life, personal strength, new possibilities, relationships with others, and spiritual change. Items are rated on a 6-point Likert scale, yielding a total score of 0 - 100; higher scores indicate more pronounced PTG. The Chinese version has demonstrated acceptable reliability and construct validity, with Cronbach’s α values ranging from .611 to .874 and exploratory factor analysis supporting a five-factor structure (30).
3.6.4. Meaning in Life Questionnaire (MLQ)
MIL was measured using the MLQ developed by Steger in 2006 and translated into Chinese by Liu in 2010 (31). This version includes two subscales: presence of meaning and search for meaning. Each item is rated on a 7-point scale, from 1 (“strongly disagree”) to 7 (“strongly agree”), with summed scores ranging from 9 to 63; higher scores indicate greater MIL. All items are positively scored except for item 2, which is reverse-scored. The Chinese version has shown acceptable reliability and validity, with Cronbach’s α values ranging from 0.71 to 0.81 across the total scale and subscales. Exploratory and confirmatory factor analyses supported its two-factor structure, comprising presence of meaning and search for meaning (31).
3.7. Statistical Analysis
Data analysis was performed using IBM SPSS Statistics version 22.0. Continuous variables were summarized as means and standard deviations, whereas categorical variables were summarized as frequencies and percentages. Before parametric analyses, normality and homogeneity of variance were assessed using the Shapiro–Wilk test and Levene’s test, respectively. No major violations of homogeneity of variance were identified for the main outcome comparisons. Between-group differences in baseline characteristics and outcome measures were examined using independent-samples t tests or χ² tests, as appropriate. The primary analysis evaluated the between-group difference in the change in psychological resilience from admission to the assessment after completion of the third chemotherapy cycle. The treatment effect was calculated as the change score in the narrative nursing group minus the change score in the control group. Secondary outcomes, including PTG and MIL, were analyzed using the same approach. Treatment effects were reported as mean differences with 95% confidence intervals and p values. All tests were two-sided, with statistical significance set at P < 0.050.
3.8. Ethical Considerations
This study protocol was reviewed and approved by the Institutional Review Board of Ordos Central Hospital on May 7, 2025 (approval no. 2025 - 362). Before participation, all eligible patients received information about the study and provided written informed consent. Participants were informed that participation was voluntary and that they could withdraw from the study at any stage without affecting their treatment. Participant information was handled confidentially, and the study was conducted in accordance with the Declaration of Helsinki.
4. Results
4.1. Baseline Characteristics of Participants
A total of 100 patients were screened for eligibility, and 68 were randomly allocated to the narrative nursing group or the control group. Overall, 66 patients completed the study and were included in the final analysis, with 33 participants in each group. Participant flow is shown in Figure 1.
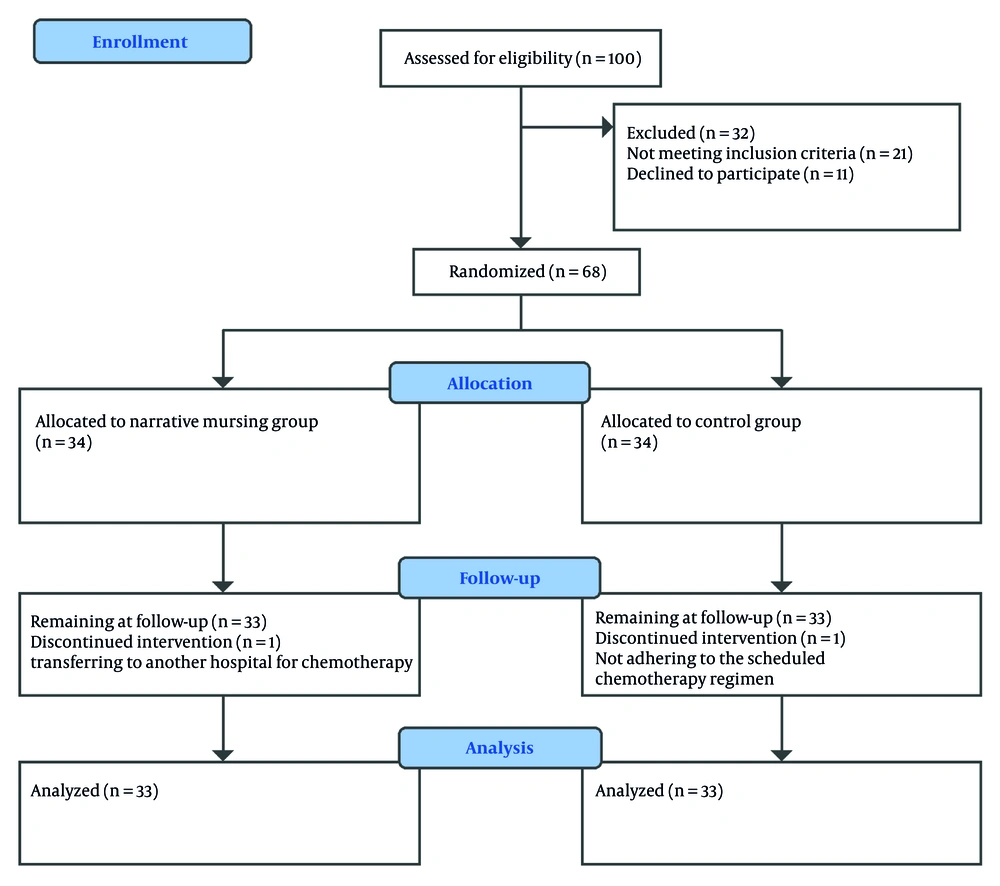
Figure 1.
CONSORT flow diagram
The two groups had comparable demographic and clinical characteristics at baseline, with no statistically significant differences (all P > 0.05). Most participants were married and of Han ethnicity, with broadly similar distributions of education, occupation, and insurance status between the groups.
Disease-related characteristics also did not differ significantly between the groups. Surgical methods were similarly distributed between the groups. Most patients had a disease duration of less than two years, no recurrence at enrollment, and stage II breast cancer. Baseline characteristics are provided in Table 1.
Table 1.
Baseline Sociodemographic and Clinical Characteristics in the Control and Narrative Nursing Groups a
| Characteristic | Control Group (n = 33) | Narrative Nursing Group (n = 33) | χ2/t | P-Value |
|---|---|---|---|---|
| Age (y) | 49.64 ± 7.97 | 49.55 ± 10.01 | 0.04 | 0.968 |
| Income (Chinese yuan) | 5969.70 ± 1754.19 | 6072.73 ± 1789.43 | -0.24 | 0.814 |
| Ethnicity | 0.25 | 0.618 | ||
| Han | 27 (81.8) | 28 (84.8) | ||
| Mongolian | 6 (18.2) | 5 (15.2) | ||
| Education level | 1.13 | 0.771 | ||
| Primary or below | 7 (21.2) | 9 (27.3) | ||
| Junior high school | 13 (39.4) | 9 (27.3) | ||
| Senior high school | 5 (15.2) | 6 (18.2) | ||
| College or above | 8 (24.2) | 9 (27.3) | ||
| Marital status | 0.64 | 0.424 | ||
| Married | 28 (84.8) | 31 (93.9) | ||
| Divorced or widowed | 5 (15.2) | 2 (6.1) | ||
| Occupation | 0.95 | 0.813 | ||
| Farmer | 9 (27.3) | 11 (33.3) | ||
| Self-employed | 8 (24.2) | 5 (15.2) | ||
| Company employee | 8 (24.2) | 8 (24.2) | ||
| Retired or unemployed | 8 (24.2) | 9 (27.3) | ||
| Medical Insurance Type | 2.84 | 0.416 | ||
| Urban resident basic medical insurance | 11 (33.3) | 9 (27.3) | ||
| Own pay | 11 (33.3) | 12 (36.4) | ||
| Employee basic medical insurance | 9 (27.3) | 6 (18.2) | ||
| Other | 2 (6.1) | 6 (18.2) | ||
| Primary Caregiver | 0.79 | 0.675 | ||
| Spouse | 13 (39.4) | 15 (45.5) | ||
| Relative | 11 (33.3) | 12 (36.4) | ||
| None | 9 (27.3) | 6 (18.2) | ||
| Surgical Method | 1.96 | 0.375 | ||
| Modified radical mastectomy | 24 (72.7) | 20 (60.6) | ||
| Breast-conserving surgery | 6 (18.2) | 6 (18.2) | ||
| Extended radical mastectomy | 3 (9.1) | 7 (21.2) | ||
| Disease Duration (y) | 4.23 | 0.237 | ||
| < 1 | 11 (33.3) | 15 (45.5) | ||
| 1 - 2 | 10 (30.3) | 11 (33.3) | ||
| 3 - 5 | 6 (18.2) | 1 (3.0) | ||
| > 5 | 6 (18.2) | 6 (18.2) | ||
| Recurrence | 2.73 | 0.099 | ||
| Yes | 8 (24.2) | 3 (9.1) | ||
| No | 25 (75.8) | 30 (90.9) | ||
| Cancer Stage | 0.69 | 0.710 | ||
| Stage I | 6 (18.2) | 4 (12.1) | ||
| Stage II | 19 (57.6) | 22 (66.7) | ||
| Stage III | 8 (24.2) | 7 (21.2) |
a Values are expressed as mean ± SD or No. (%). Independent-samples t-tests were used for continuous variables and χ2 tests for categorical variables.
4.2. Primary Outcome: Psychological Resilience
At baseline, the two groups had comparable scores for tenacity, optimism, self-reliance, and overall psychological resilience (all P > 0.05). After the intervention, participants in the narrative nursing group had significantly higher scores than those in the control group across all psychological resilience domains and in total psychological resilience (all P < 0.05).
Analyses of changes from baseline to post-intervention also showed greater improvements in the narrative nursing group than in the control group for tenacity, optimism, self-reliance, and total psychological resilience (all P < 0.05). Psychological resilience outcomes are summarized in Table 2.
Table 2.
Comparison of Psychological Resilience Between the Narrative Nursing Group and the Control Group a
| Dimensions and Time Points | Narrative Nursing Group (n = 33) | Control Group (n = 33) | Between-Group P Value | Treatment Effect MD (95% CI) | P Value for Treatment Effect |
|---|---|---|---|---|---|
| Tenacity | |||||
| T0 | 32.94 ± 2.85 | 32.91 ± 2.47 | 0.963 | 1.66 (0.94, 2.38) | < 0.001 |
| T1 | 35.42 ± 2.24 | 33.73 ± 1.96 | 0.002 b | 1.66 (0.94, 2.38) | < 0.001 |
| Optimism | |||||
| T0 | 6.97 ± 1.93 | 7.18 ± 1.59 | 0.628 | 1.12 (0.53, 1.71) | < 0.001 |
| T1 | 9.70 ± 1.53 | 8.79 ± 1.56 | 0.020 b | 1.12 (0.53, 1.71) | < 0.001 |
| Self-reliance | |||||
| T0 | 17.15 ± 1.64 | 16.36 ± 1.71 | 0.061 | 0.99 (0.23, 1.75) | 0.012 |
| T1 | 18.36 ± 2.26 | 16.58 ± 1.66 | 0.001 b | 0.99 (0.23, 1.75) | 0.012 |
| Total score | |||||
| T0 | 57.06 ± 5.16 | 56.45 ± 4.15 | 0.601 | 3.87 (2.72, 5.02) | < 0.001 |
| T1 | 63.48 ± 4.11 | 59.00 ± 3.64 | < 0.001 b | 3.87 (2.72, 5.02) | < 0.001 |
a Values are expressed as mean ± SD unless otherwise indicated. The treatment effect was estimated as the between-group mean difference in change from baseline, calculated as (T1 - T0) in the narrative nursing group minus (T1 - T0) in the control group. Abbreviations: MD, mean difference; T0, at admission; T1, after completion of the third chemotherapy cycle; CI, confidence interval.
b P < 0.050 was considered statistically significant.
4.3. Secondary Outcome: PTG
At baseline, the two groups were comparable in overall PTG and across all PTG domains (all P > 0.05). After the intervention, participants in the narrative nursing group had significantly higher scores than those in the control group across all PTG domains and in overall PTG (P < 0.05).
Analyses of changes from baseline to post-intervention showed statistically significant improvements across all PTG domains and overall PTG, favoring the narrative nursing group (all P < 0.05). Table 3 summarizes the treatment effects for PTG domains and overall PTG.
Table 3.
Comparison of PTG Between the Narrative Nursing Group and the Control Group a
| Dimensions and Time Points | Narrative Nursing Group (n = 33) | Control Group (n = 33) | Between-Group P Value | Treatment Effect MD (95% CI) | P Value for Treatment Effect |
|---|---|---|---|---|---|
| Appreciation of life | |||||
| T0 | 17.76 ± 2.67 | 17.73 ± 2.35 | 0.961 | 2.88 (2.41, 3.35) | < 0.001 |
| T1 | 20.88 ± 2.37 | 17.97 ± 2.35 | < 0.001 b | 2.88 (2.41, 3.35) | < 0.001 |
| Personal strength | |||||
| T0 | 8.76 ± 2.18 | 8.27 ± 2.02 | 0.352 | 0.75 (0.23, 1.27) | 0.006 |
| T1 | 10.33 ± 1.78 | 9.09 ± 1.77 | 0.006 b | 0.75 (0.23, 1.27) | 0.006 |
| New possibilities | |||||
| T0 | 9.27 ± 2.41 | 9.00 ± 2.41 | 0.648 | 0.70 (0.10, 1.30) | 0.022 |
| T1 | 10.61 ± 1.80 | 9.64 ± 2.09 | 0.048 b | 0.70 (0.10, 1.30) | 0.022 |
| Relating to others | |||||
| T0 | 8.03 ± 2.22 | 7.64 ± 2.03 | 0.454 | 1.52 (0.96, 2.08) | < 0.001 |
| T1 | 10.36 ± 1.78 | 8.45 ± 2.03 | < 0.001 b | 1.52 (0.96, 2.08) | < 0.001 |
| Spiritual change | |||||
| T0 | 11.76 ± 3.13 | 10.85 ± 2.99 | 0.232 | 0.64 (0.21, 1.07) | 0.004 |
| T1 | 12.52 ± 2.56 | 10.97 ± 2.91 | 0.025 b | 0.64 (0.21, 1.07) | 0.004 |
| Total PTG score | |||||
| T0 | 55.58 ± 9.11 | 53.79 ± 8.34 | 0.409 | 6.79 (4.83, 8.75) | < 0.001 |
| T1 | 64.70 ± 7.16 | 56.12 ± 7.85 | < 0.001 b | 6.79 (4.83, 8.75) | < 0.001 |
a Values are expressed as mean ± SD unless otherwise indicated. The treatment effect was estimated as the between-group mean difference in change from baseline, calculated as (T1 - T0) in the narrative nursing group minus (T1 - T0) in the control group. Abbreviations: MD, mean difference; CI, confidence interval; T0, at admission; T1, after completion of the third chemotherapy cycle.
b P < 0.050 was considered statistically significant.
4.4. Secondary Outcome: MIL
Baseline scores for presence of meaning, search for meaning, and overall MIL were similar between the two groups (all P > .05). After the intervention, participants in the narrative nursing group had significantly higher scores for presence of meaning and overall MIL than those in the control group (all P < .05). The narrative nursing group also had a higher score for search for meaning, although this post-intervention between-group difference did not reach statistical significance.
Analyses of changes from baseline to post-intervention indicated greater improvements in the narrative nursing group for presence of meaning, search for meaning, and overall MIL (all P < 0.05). These findings suggest that the narrative nursing program produced measurable improvements in patients’ perceived MIL, particularly in the presence of meaning and overall MIL. Detailed results are presented in Table 4.
Table 4.
Comparison of MIL Between the Narrative Nursing Group and the Control Group a
| Dimensions and Time Points | Narrative Nursing Group (n = 33) | Control Group (n = 33) | Between-Group P Value | Treatment Effect MD (95% CI) | P Value for Treatment Effect |
|---|---|---|---|---|---|
| Presence of meaning | |||||
| T0 | 21.18 ± 5.00 | 21.48 ± 4.53 | 0.797 | 3.27 (2.23, 4.31) | < 0.001 |
| T1 | 28.03 ± 3.05 | 25.06 ± 4.49 | 0.003 b | 3.27 (2.23, 4.31) | < 0.001 |
| Search for meaning | |||||
| T0 | 18.42 ± 2.02 | 18.30 ± 2.46 | 0.829 | 0.94 (0.37, 1.51) | 0.002 |
| T1 | 20.36 ± 1.73 | 19.30 ± 2.63 | 0.058 | 0.94 (0.37, 1.51) | 0.002 |
| Total MIL score | |||||
| T0 | 39.61 ± 6.00 | 39.79 ± 5.72 | 0.900 | 4.24 (3.02, 5.46) | < 0.001 |
| T1 | 48.39 ± 4.00 | 44.33 ± 6.00 | 0.002 b | 4.24 (3.02, 5.46) | < 0.001 |
a Values are expressed as mean ± SD unless otherwise indicated. The treatment effect was estimated as the between-group mean difference in change from baseline, calculated as (T1 - T0) in the narrative nursing group minus (T1 - T0) in the control group. Abbreviations: MD, mean difference; CI, confidence interval; T0, at admission; T1, after completion of the third chemotherapy cycle.
b P < 0.050 considered statistically significant.
5. Discussion
In this single-center randomized trial, we evaluated the short-term effects of a nurse-led narrative intervention program on psychological adaptation in patients receiving chemotherapy for breast cancer. Compared with routine psychological care alone, adding narrative nursing was associated with greater improvements in psychological resilience, PTG, and MIL from admission to the assessment after completion of the third chemotherapy cycle.
5.1. Enhancing Psychological Resilience
Our study showed that patients with breast cancer undergoing chemotherapy face substantial challenges to psychological resilience, with baseline findings indicating moderate-to-low levels in both groups. This baseline pattern is broadly consistent with previous evidence from mainland China, which reported a mean CD-RISC score of 60.97 ± 12.30 among women newly diagnosed with breast cancer (32). Compared with that study, the slightly lower baseline resilience observed in our sample may reflect the additional psychological and physical burdens associated with postoperative chemotherapy. After completion of the third chemotherapy cycle, participants receiving narrative nursing had higher psychological resilience than those receiving routine psychological care alone, and the treatment effect indicated greater short-term improvement in the narrative nursing group. These results suggest a potential added benefit of narrative nursing beyond routine psychological care within the present trial context. These post-intervention findings are broadly consistent with previous narrative-based oncology studies suggesting that narrative interventions may improve resilience, psychosocial well-being, quality of life, and emotional adjustment among patients with cancer (21-33).
Narrative nursing, rooted in postmodern constructivist psychology, guides patients to externalize problems (view difficulties as separate from the self), deconstruct underlying causes (analyze triggers and maintaining factors), and reconstruct meaning by drawing on unique coping experiences (34). Through these procedural steps, patients identify strengths and enhance emotion regulation and problem-solving, thereby consolidating agency through cognitive restructuring and emotional processing. This pattern aligns with resilience-enhancing pathways identified in cancer care research (35).
In contrast to protocol-driven psychosocial interventions, narrative nursing adopts a dialogical and personalized approach that directly addresses existential crises, body image concerns, and fluctuations in treatment adherence among patients with cancer. Emerging evidence indicates that narrative-oriented interventions are associated with reduced emotional distress and enhanced resilience-related functioning among patients with cancer (36, 37).
5.2. Promoting PTG
At baseline, both groups showed relatively low PTG scores, which were slightly below the normative score reported among Chinese trauma survivors (30). This difference may be explained by differences in cancer type, disease stage, and cultural context (38). Patients with breast cancer are frequently exposed to a wide range of negative emotions during diagnosis, treatment, and recovery; however, many are also able to develop positive psychological changes, such as closer interpersonal relationships, greater appreciation of life, and enhanced inner strength.
Post-intervention findings showed that the narrative nursing group achieved higher PTG scores than the control group, and the treatment effect based on change from baseline indicated greater improvement in PTG. These results suggest that narrative nursing may support short-term improvement in PTG during chemotherapy, although the durability of this effect requires confirmation in studies with longer follow-up. This observed improvement aligns with prior studies reporting PTG and psychosocial adaptation benefits from narrative interventions in oncology settings (39, 40).
The underlying mechanisms may be understood through modifiable PTG determinants, particularly cognitive processing/meaning-making and social support (41, 42). By providing empathic listening, emotional and informational support, and structured opportunities for therapeutic witnessing with external witnesses, narrative nursing enhances perceived social support and facilitates growth-oriented reappraisal and identity reconstruction (43). By addressing these determinants, narrative nursing promotes positive psychological growth and may contribute to long-term well-being in patients receiving chemotherapy.
5.3. Improving MIL
At baseline, participants showed relatively low MIL scores compared with those reported in postoperative but non-chemotherapy patients with breast cancer and other breast cancer cohorts (44). This finding suggests that the adverse effects of chemotherapy may negatively affect patients’ sense of MIL, leading to feelings of uncertainty, emptiness, and loss of purpose.
Our findings suggest that narrative nursing was associated with greater short-term improvement in MIL than routine psychological care, as indicated by the between-group treatment effect based on change from admission. This provides preliminary interventional evidence that meaning-oriented nursing strategies may help strengthen patients’ perceived meaning during chemotherapy. These findings align with earlier evidence suggesting that a stronger sense of meaning in life is linked to reduced distress and more adaptive adjustment in patients with cancer (45, 46). While most prior studies have provided correlational evidence for the protective role of MIL (45, 47, 48), the present study extends this literature by offering preliminary evidence that MIL may be improved through narrative nursing interventions. Thus, our results not only corroborate the theoretical and empirical links between MIL and psychological well-being but also provide novel evidence that meaning-oriented nursing strategies can actively enhance patients’ existential resources during chemotherapy. This progression from correlation to intervention highlights the clinical significance of targeting MIL as a modifiable factor in oncology care.
5.4. Limitations
This trial should be interpreted in light of several limitations. First, recruitment was limited to one tertiary hospital, and the final analytic sample was relatively small, potentially reducing the external validity and precision of the effect estimates. Second, outcomes were assessed only from admission to the assessment after completion of the third chemotherapy cycle; therefore, the findings should be interpreted as short-term post-intervention effects rather than evidence of sustained effectiveness.
Third, outcome assessment relied on participant-completed questionnaires, making the results susceptible to reporting bias and social desirability bias. Fourth, although outcome assessment and data analysis were blinded, participants and intervention nurses could not be blinded because of the interactive nature of the intervention. Finally, intervention effects may be influenced by contextual and professional factors, including the clinical environment, nurse training, and fidelity of narrative nursing delivery. Future multicenter trials with larger samples, longer follow-up, and additional objective or clinician-rated outcomes are needed.
5.5. Strengths
The present trial also has several strengths. First, it is one of the few randomized controlled trials to evaluate narrative nursing in patients with breast cancer receiving chemotherapy, providing preliminary randomized evidence of feasibility and short-term effects. Second, a trained multidisciplinary team implemented the narrative nursing program using a standardized protocol, which helped ensure consistency across participants. Third, the study used validated instruments (CD-RISC, PTGI, MLQ) with good psychometric properties, enhancing the reliability of the findings. Finally, by simultaneously focusing on resilience, PTG, and MIL, the study provides a comprehensive assessment of psychological adaptation and offers practical insights for integrating narrative nursing into oncology nursing practice.
5.6. Conclusions
In this single-center randomized controlled trial, participants who received a nurse-led narrative intervention in addition to routine psychological care showed greater short-term improvements in psychological resilience, PTG, and MIL than those who received routine psychological care alone. These findings suggest that a nurse-led narrative intervention may be a practical psychosocial strategy for patients with breast cancer undergoing chemotherapy. Larger multicenter trials with longer follow-up and more diverse outcome measures are needed to confirm the durability and generalizability of these effects.