Tables
Last Update: 21 August, 2024 | 13:03
Tables
- The best way to prepare a table in a manuscript is using the Microsoft Word Table function. Tables will not be accepted as an image file.
- Place each table in your manuscript Full-text file directly after the paragraph in which it is first cited. If a table presents results but is first mentioned in the Methods section, do not move the table. Instead, remove the in-text mention in the Methods, leave an explanation for the authors, and retain the table in the Results section.
- Do not submit tables in a separate file(s). Only upload tables as separate files if they are intended to be an appendix.
- Each table should have borders with normal style without any colored row or column.
- The style of a table should be simple. Each cell must contain only one paragraph or one line.
- Do not use the Space or Enter keys to align content across the table or to create a new line, indent, or justify the content.
- For ease of reading and formatting reasons, large tables covering several pages should, if possible, be divided into 2 or more smaller tables.
Table Components
- Values for sample sizes and percents should be presented in the same column as "No. (%)".
- The unit of measurement is usually presented in the column heading; however, if the unit differs for each row, the unit of measurement can be presented in the left-most column of the row. Units of measurement are separated from the column description or row heading with a comma.
- Category headings must be in marked in bold (eg, race, age groups, and gender).
Table Footnotes
- The footnotes should appear in alphabetical order from left to right, top to bottom within the table.
- All footnote symbols within a table are superscripted letters (a-z). The use of *, **, *** footnotes to mark significance levels (eg, P < .05, P < 0.01, P < 0.001) is discouraged. Authors are asked to provide exact P values instead. While we prefer the exact P values, there are exceptions to this general rule:
- In tables of systematic reviews, which tend to be busy and where the original P values can't be found in the original publications
- When odds ratios instead of P values are presented
- If for any reason authors are unable to provide the exact P values
- Footnotes are placed in a list directly after the table. All footnotes presented in this list require a corresponding letter within the table.
How to draw a standard table:
- A sample of the table:
| Header 1 | Header 2 | Header 3 | Header 4 |
| First Column 1 | Cell 1 | Cell 2 | Cell 3 |
| First Column 2 | Cell 4 | Cell 5 | Cell 6 |
| First Column 3 | Cell 7 | Cell 8 | Cell 9 |
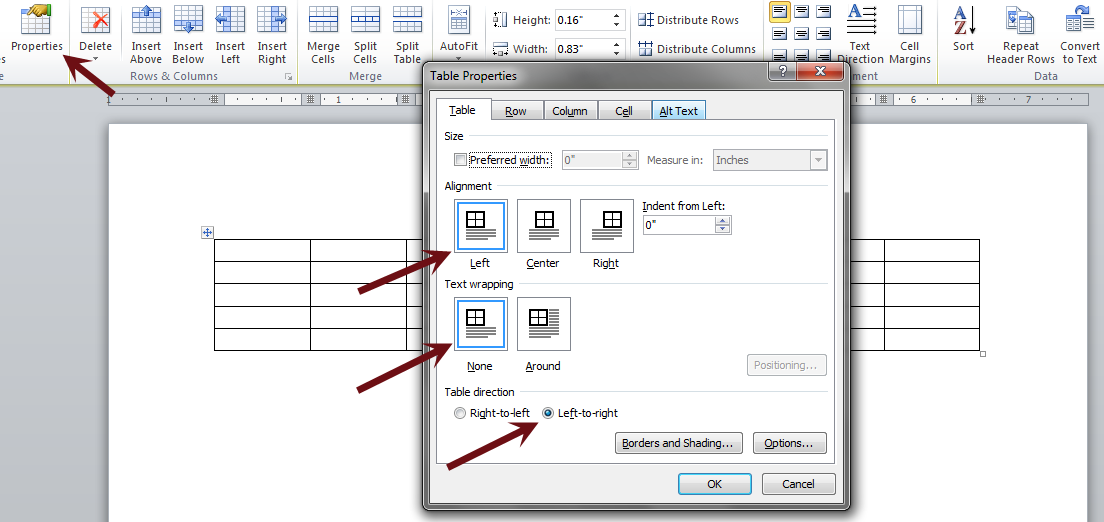
- The text direction of the table should be Left-to-Right as the whole manuscript (Red Arrow).
- Align text should be on the left also (Green Arrow).
- If you have already drawn your table, you should apply the above steps in addition to changing table properties, as shown in the figure below.

