1. Background
The medicinal herb Withania somnifera, widely known as Ashwagandha, “Indian ginseng,” or “Indian winter cherry,” holds a significant place in traditional Indian medicine systems such as Ayurveda. This herb, a member of the Solanaceae family, has been utilized in both standalone and polyherbal Ayurvedic formulations for treating a variety of ailments for thousands of years (1). Recognized as an adaptogenic herb, it is also consumed as a dietary supplement to enhance overall health and well-being. Ashwagandha is a key ingredient in several important traditional Ayurvedic preparations, including Ashwagandharishta, Ashwagandhaleha, and Ashwagandhachoornam (2). Traditionally, this plant has been used for its immunomodulatory, anti-stress, and neuroprotective effects, as well as for enhancing physical strength, stamina, and cognition, and as an aphrodisiac, classifying it as a rasayana or health rejuvenator owing to its wide range of health benefits (3). Clinical trials have validated its efficacy in managing stress, anxiety, fatigue, sleep disturbances, lower back pain, strengthening bones and muscles, treating neurodegenerative diseases, improving fertility, athletic performance, and memory, as well as in conditions like Parkinson's disease and thyroid disorders (4-6). Reported pharmacological properties of Ashwagandha include anti-inflammatory, anticancer, anti-rheumatoid arthritis, chemoprotective, antidepressant, anti-stress, adaptogenic, anxiolytic, neuroprotective, nootropic, antioxidant, cardioprotective, immunomodulatory, treatment of cerebral ischemia, and antiviral activities (5-10). Major phytoconstituents identified from the plant, such as alkaloids, flavonoids, and steroidal lactones, including withaferins, withanolides, and withanolide glycosides, known as withanosides, are responsible for its diverse biological activities (11-13). Traditionally and in modern pharmacological studies, the roots are predominantly used. However, with the increasing global demand for W. somnifera roots, recent research has also focused on its other aerial parts, such as leaves and stems.
2. Objectives
The current study aims to apply high-performance thin layer chromatography (HPTLC) for fingerprinting, along with evaluating physicochemical parameters and conducting preliminary phytochemical analyses of various parts of W. somnifera, including seeds, stems, leaves, and roots. This approach is intended to detect any adulteration in the herbal raw material, ensuring better quality and safety.
3. Methods
P-anisaldehyde, sulfuric acid, acetic acid, formic acid, ethyl acetate, chloroform, and methanol of analytical grade were procured from Loba Chemicals (India), Rankem (India), and Qualigens (USA). The herbal raw materials were sourced from the local market and authenticated by the botanist, Mr. Patchaimal. A herbarium specimen was archived for future reference in the herbarium of the AVN Ayurveda Formulation, Quality Control Department, under the voucher specimen number AVN/QC/WS/05.
3.1. Preparation of Sample Solution
Five grams of each raw material, including leaves, roots, stems, and seeds, was extracted with methanol using reflux. The extracts were prepared at a concentration of 100 mg/mL in methanol for HPTLC analysis. This same extract was utilized for UV analysis and preliminary phytochemical analysis (Figure 1).
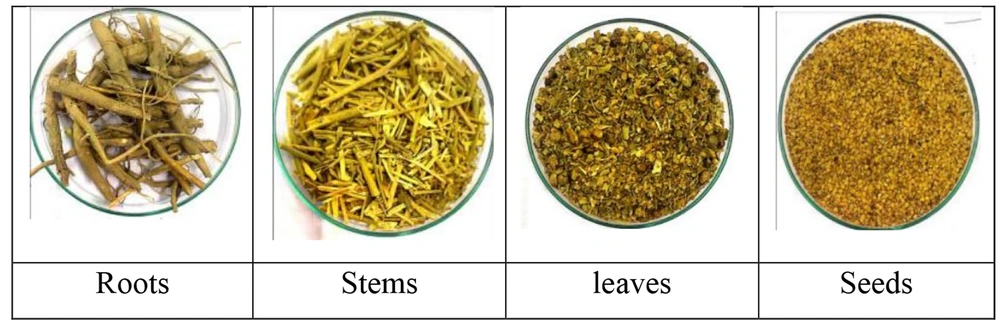
Figure 1.
Different parts of Withania somnifera
3.2. Preparation of Derivatization Reagents
The anisaldehyde-sulfuric acid reagent (AS) was prepared by combining 0.5 mL of P-anisaldehyde with 10 mL of glacial acetic acid, then adding 85 mL of methanol and gradually incorporating 5 mL of concentrated sulfuric acid. The thin layer chromatography (TLC) plate was sprayed with AS and heated at 100°C for 5 - 10 minutes until derivatized zones appeared.
Dragendorff reagent was prepared by dissolving 850 mg of bismuth nitrate in 10 mL of glacial acetic acid and 40 mL of deionized water (solution A) and dissolving 8.0 g of potassium iodide in 30 mL of water (solution B). Solutions A and B were mixed in equal proportions, and 1 mL of this mixture was combined with 2 mL of glacial acetic acid and 10 mL of deionized water to formulate the Dragendorff reagent (14).
3.3. Determination of the Extractive Value
The extractive values were assessed using ethyl alcohol and water to gauge the quantity of medium-polar and highly-polar constituents in all the raw materials. A precise amount of 4.0 grams of coarsely powdered, shade-dried material was placed in a glass-stoppered conical flask and macerated with 100 mL of solvent for 6 hours, with frequent shaking, before being left to stand for 18 hours. The extract was then filtered through the Whatman filter paper grade 100. Then, 25 mL of the filtrate was evaporated to dryness in a petri dish, dried at 105°C, and weighed. The percentage of water-soluble and alcohol-soluble extractives relative to the dried material was calculated (13-15).
3.4. Determination of Ash Value
To determine the ash value, 2 grams of dried powdered material was accurately weighed and placed in a previously ignited silica crucible. The material was gradually ignited, increasing the temperature to 450°C until it turned into white ash. The sample was cooled in a desiccator and weighed. The percentage of total ash was calculated with reference to the dried herbal drug material.
The acid-insoluble ash value was determined by boiling the previously obtained ash with 25 mL of 2 M hydrochloric acid for 5 minutes. The insoluble matter was collected on ash-less filter paper, washed with hot water, ignited, cooled in a desiccator, and weighed. The percentage of acid-insoluble material was calculated based on the dry weight of the herbal drug (13-15).
3.5. Preliminary Phytochemical Analysis
3.6. UV-Vis Spectrophotometer Analysis
For UV-visible spectrophotometry analysis, 100 mg of each plant material was soaked overnight in 5 mL of ethyl alcohol and filtered through the Whatman No.1 filter paper. To profile the UV-Vis spectrum of the crude Withania somnifera extract, the extracts were scanned over a wavelength range of 200 to 800 nm using a Shimadzu spectrophotometer, Model 1700, and the characteristic peaks were identified. The peak values for each UV-Vis spectrum were recorded.
3.7. Determination of Total Phenolic Content and Total Flavonoid Content
The total phenolic content (TPC) of different plant parts was determined by the Folin-Ciocalteu method at 765 nm after 2 hours of incubation. Total phenolic content was calculated from a calibration curve derived from standard gallic acid solutions within a 10 - 50 mg/mL concentration range. The TPC was expressed in mg of gallic acid equivalent (GAE) per gram of extract (mg GAE/g extract).
The total flavonoid content (TFC) was measured using the aluminum chloride colorimetry method. After incubating for 1 hour at room temperature, the absorbance was measured at 420 nm using a UV/VIS spectrophotometer. Quantification was based on a quercetin standard curve, and the TFC was expressed as mg of quercetin equivalents per gram of extract (mg QAE/g extract) (16).
3.8. HPTLC Analysis
The HPTLC analysis was conducted on 10 × 10 cm HPTLC aluminum plates coated with silica gel 60 F254 (Sigma-Aldrich) using a CAMAG HPTLC system operated by VisionCATS 3.0 software. The sample solution was applied at a rate of 150 nL/s as a 5 mm band, spaced 8.5 mm apart, and positioned 8 mm from the plate's lower edge. The plates were developed in a saturated twin-trough chamber (20 min, with filter paper) until the solvent front reached 80 mm from the bottom edge. The mobile phase consisted of chloroform, methanol, acetone, and ammonia (8:1.5:0.8:0.5). After development, the plates were derivatized with AS and heated at 100°C for 3 minutes. The plates once derivatized with Dragendorff reagent, were washed with water to reveal distinct orange zones. Scanning was performed at 200 and 254 nm in absorbance mode, with a scanning speed of 20 mm/s and slit dimensions of 3 × 0.2 mm.
3.9. Characterization of Secondary Metabolite by Nuclear Magnetic Resonance Spectroscopy
Qualitative and quantitative analyses of herbal drug extracts, including primary and secondary metabolites, can be efficiently performed using nuclear magnetic resonance (NMR) spectroscopy. Given that each herb possesses a unique set of secondary metabolites, the NMR spectra offer valuable insights into the chemistry of herbal extracts (17). The 1H NMR spectra were recorded for alcoholic extracts of roots, leaves, stems, and seeds. For the NMR spectra, 50 mg of each extract was weighed, dissolved in 1 mL of deuterated solvent DMSO-d6 (δH -2.5), and filtered into an NMR tube to eliminate any undissolved residue. The 1H-NMR spectra were acquired using a Bruker Avance-III 600 MHz NMR spectrometer
4. Results and Discussion
4.1. Extractive Value
Extractive values serve as crucial indicators in evaluating crude drugs for the preparation of various dosage forms, such as decoctions, tablets, arishtams, and ghritams. A lower extractive value leads to a reduced yield of extracts, necessitating the use of a larger quantity of raw materials. Additionally, a lower extractive value may suggest the adulteration or mixing of the drug with other parts of raw materials or the use of exhausted raw materials. The extractive values of the ingredients are presented in Table 1. A higher water-soluble extractive value suggests that water is a more effective solvent for extracting herbal ingredients compared to ethyl alcohol, which yields fewer extracts. The comparison of extractive values indicates that the root part of the herb has higher water-soluble and alcohol-soluble extractive values compared to its other parts, such as leaves, stems, and seeds.
Table 1.
Physicochemical Parameters of Different Parts of Withania somnifera
| Parameters | Leaf | Stem | Seed | Roots |
|---|---|---|---|---|
| Water-soluble extractive value (%w/w) | 23.35 | 22.96 | 19.04 | 31.21 |
| Alcohol-soluble extractive value (%w/w) | 5.48 | 1.98 | 11.77 | 18.5 |
| Ash value (%w/w) | 9.95 | 3.46 | 5.47 | 4.28 |
| Acid-insoluble ash value (%w/w) | 2.6 | 1.98 | 1.23 | 0.76 |
4.2. Ash Value
The ash value indicates the presence of inorganic substances within a drug and is a critical quality parameter. The higher the ash value, the greater the content of inorganic substances in the herbal material. An elevated ash value may indicate the adulteration, substitution, or contamination of the drug. Since the root is considered the medicinal part of the plant, its parameters are specified in the Ayurvedic pharmacopoeia, including (1) a total ash value of no more than 7.0%; (2) an acid-insoluble ash value of no more than 1.0%; and (3) an alcohol-soluble extractive value of not less than 15%. Thus, all the mentioned parameters for the root comply with pharmacopoeia standards (2). The parameters for other plant parts, such as leaves, stems, and seeds, are based on experimental data.
4.3. Phytochemical Test
The phytochemicals present in the plant are shown in Table 2. Preliminary phytochemical analyses revealed the presence of alkaloids, phenolics, flavonoids, phytosterols, and triterpenoids in both aqueous and ethanolic extracts of roots, leaves, stems, and seeds. Triterpenoids and steroids were identified as the primary constituents of leaves and stems. Alkaloids were detected in all samples except for the seeds extracted from the aqueous extract. Phytosterols and triterpenes were absent in the water extract of all samples. Tests for glycosides, triterpenes, and amino acids were negative in both alcoholic and water extracts of all samples.
Table 2.
Preliminary Phytochemical Analysis on Aqueous and Ethanolic Extracts of Withania somniferaa
| Compounds | Chemical Tests | AE/Rt/WS | AE/Lf/WS | AE/St/WS | AE/Sd/WS | EE/Rt/WS | EE/Lf/WS | EE/St/WS | EE/Sd/WS |
|---|---|---|---|---|---|---|---|---|---|
| Alkaloids | |||||||||
| Mayers test | ++ | + | + | - | ++ | + | + | +++ | |
| Wagner test | ++ | ++ | ++ | - | ++ | ++ | - | ++ | |
| Dragendorff | ++ | ++ | ++ | - | ++ | ++ | + | ++ | |
| Carbohydrate test | |||||||||
| Molish test | ++ | ++ | ++ | ++ | ++ | ++ | ++ | ++ | |
| Reducing sugar | |||||||||
| Fellings test | ++ | + | ++ | - | ++ | + | ++ | - | |
| Sugar | |||||||||
| Benedict test | ++ | + | + | - | ++ | + | + | - | |
| Phenolics | |||||||||
| Ferric chloride | - | - | - | - | - | + | + | - | |
| Lead acetate test | + | + | + | + | ++ | + | + | +++ | |
| Flavonoids | |||||||||
| Alcoholic NH4OH | ++ | + | + | +++ | ++ | + | + | +++ | |
| Phytosterols and triterpenes | |||||||||
| Libermann test | - | - | - | - | + | ++ | ++ | + | |
| Glycosides | - | - | - | - | - | - | - | - | - |
| Amino acids | |||||||||
| Ninhydrine test | - | - | - | - | - | - | - | - | |
| Protein | |||||||||
| Biuret test | - | - | - | - | - | - | - | - |
Abbreviations: AE, aqueous extract; EE, ethanolic extract; Rt, root; Lf, leaf; St, stem; Sd, seed; WS, Withania somnifera.
a +, presence; -, absence; ++, present; +++, present in higher concentrations.
4.4. UV Spectroscopic Analysis
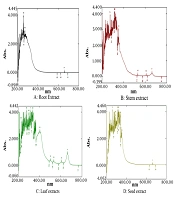
UV-Vis spectroscopy, a simple and inexpensive technique, is useful for identifying and differentiating various phytochemicals and can be employed for the qualitative analysis of herbal drugs. Since plant extracts contain multiple ingredients, the UV-Vis spectra of the extract display several peaks. The UV-Vis spectroscopic analysis of plant extracts has been utilized as a quality control method for various herbal materials (17-20). The qualitative UV-Vis spectrum profile of the ethanolic extract is presented in Figure 2, and the absorption at different wavelengths is provided in Table 3. The qualitative UV-Vis profile showed separations at 273.50 nm and 260.00 nm with absorptions of 2.786 and 3.806 in the leaf extract and at 664.00, 355.50, 319.50, and 274.50 nm with absorptions of 0.183, 1.914, 4.000, and 3.806, respectively, in the stem extract. Additionally, 664.50, 608.00, 534.50, 502.50, 403.00, 335.50, 317.50, 298.50, 276.50, and 225.00 nm with absorptions of 0.870, 0.231, 0.269, 0.349, and 2.524 were observed in the leaf extract, and 354.50, 339.50, 322.00, 314.00, 292.50, and 262.50 nm with absorptions of 2.266, 3.612, 4.000, 4.000, 3.656, and 4.000 were noted. The highest number of peaks was observed in the leaf extract, indicating the presence of a diverse group of phytochemicals. Spectral bands beyond 500 nm were characteristic of chlorophyll-based pigments present in the plant. The prominent absorption bands in the leaf extract were related to flavonoid-type compounds, which were not as prominent in extracts from other parts of the plant. W. somnifera's UV-Vis spectra were found to be characteristic across all parts of the plant, suggesting their utility as quality control parameters for evaluating herbal drugs. These spectra can aid in assessing material variations related to identification, geographical differences, and seasonal changes (18-21).
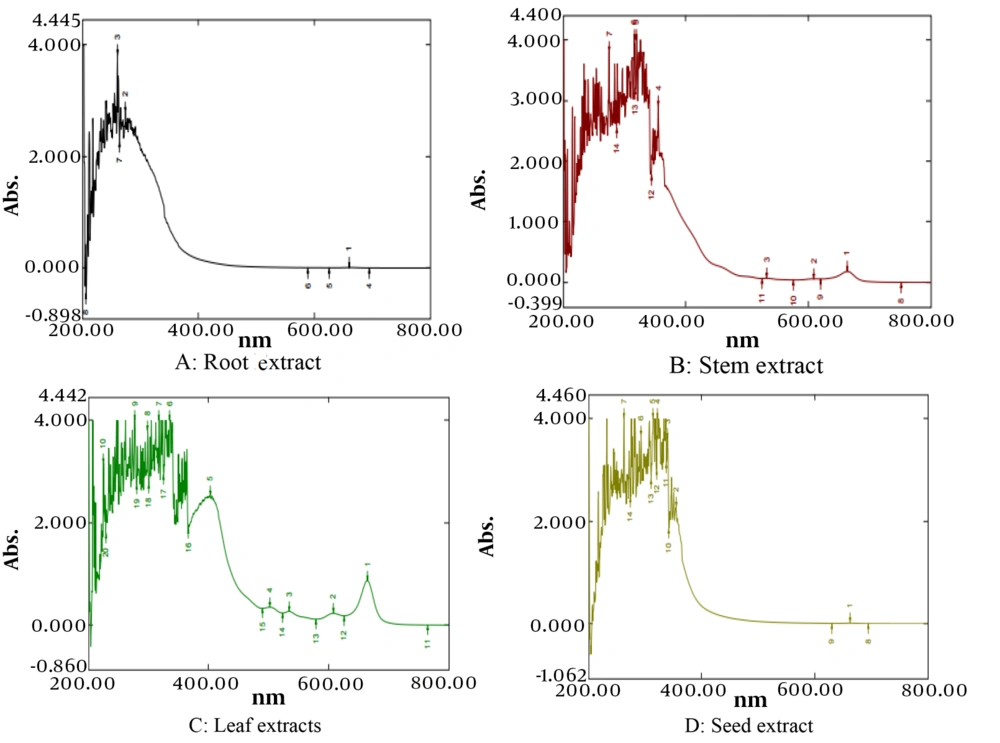
Figure 2.
UV-Vis spectrum ethanolic extract of Withania somnifera. A, leaf extract; B, root extract; C, seed extract; D, stem extract.
Table 3.
UV-Vis Peak Values of Different Extracts of Withania somnifera
| Extracts | Wave Length | Absorbance |
|---|---|---|
| Root | 661.00 | 0.008 |
| 273.50 | 2.786 | |
| 260.00 | 3.806 | |
| - | - | |
| - | - | |
| - | - | |
| - | - | |
| - | - | |
| - | - | |
| - | - | |
| Stem | 664.00 | 0.183 |
| 609.00 | 0.060 | |
| 532.50 | 0.069 | |
| 355.50 | 1.914 | |
| 319.50 | 4.000 | |
| 274.50 | 3.806 | |
| - | - | |
| - | - | |
| - | - | |
| - | - | |
| Leaf | 664.50 | 0.870 |
| 608.00 | 0.231 | |
| 534.50 | 0.269 | |
| 502.50 | 0.349 | |
| 403.00 | 2.524 | |
| 335.50 | 4.00 | |
| 317.50 | 4.00 | |
| 298.50 | 3.806 | |
| 276.50 | 4.000 | |
| 225.00 | 3.156 | |
| Seed | 663.00 | 0.010 |
| 354.50 | 2.266 | |
| 339.50 | 3.612 | |
| 322.00 | 4.000 | |
| 314.00 | 4.000 | |
| 292.50 | 3.656 | |
| 262.50 | 4.000 | |
| - | - | |
| - | - | |
| - | - |
4.5. Total Phenolic and Total Flavonoid Content
A calibration curve for gallic acid was plotted with concentrations of 10, 20, 30, 40, and 50 µg/mL. The resulting regression equation was Y = 0.0072 X + 0.0075, where Y represents the observed absorbance of an unknown sample, and X represents the concentration of the unknown sample. This equation facilitated the calculation of the phenolic content of the samples. Similarly, quercetin was utilized at concentrations of 20, 40, 60, 80, and 100 mg/mL to establish a calibration curve, yielding the regression equation Y = 0.0024 X + 0.046, where Y denotes the absorbance of the unknown sample and X the concentration of the unknown sample. The TFC was determined using this equation in terms of quercetin equivalents. It was noted that the aqueous extracts of the plant parts contained more phenolic compounds than the corresponding alcoholic extracts. Conversely, the total flavonoids were higher in the alcoholic extracts of the plant compared to the aqueous extracts. The values for both TPC and TFC are presented in Table 4.
Table 4.
Percentage of Total Phenolic and Total Flavonoid Contents a
| Samples | Total Phenolic Content | Total Flavonoid Content |
|---|---|---|
| Aqueous extract of the root | 2.20 | 2.46 |
| Aqueous extract of leaf | 1.31 | 2.75 |
| Aqueous extract of the stem | 4.16 | 0.11 |
| Aqueous extract of the seed | 2.48 | 5.17 |
| Alcohol extract of the root | 1.98 | 9.75 |
| Alcohol extracts of the leaf | 1.60 | 4.21 |
| Alcohol extracts of the stem | 3.76 | 10.21 |
| Alcohol extract of the seed | 0.98 | 8.96 |
a Values are expressed as %w/w.
4.6. HPTLC Analysis
The HPTLC method was developed for phytochemical fingerprinting of various plant parts. The optimized mobile phase resulted in the good resolution under UV-254 nm, 366 nm, and visible light after derivatization. High-performance thin layer chromatography analysis revealed the presence of phytochemicals such as alkaloids, steroids, terpenoids, and phenolics. Each extract's fingerprint displayed a distinct chemical profile with varied bands at different Rf values, becoming more pronounced after TLC plate derivatization. One fingerprint from TLC plates derivatized with Dragendorff reagent is shown in Table 4. Under 254 nm, seed extracts displayed 5 spots at Rf values of 0.06, 0.23, 0.30, 0.50, and 0.84; leaf extracts showed 14 spots at Rf values of 0.05, 0.14, 0.17, 0.23, 0.26, 0.30, 0.39, 0.46, 0.52, 0.55, 0.60, 0.71, 0.84, 0.87, and 0.90; stem extracts displayed 13 spots at Rf values of 0.06, 0.14, 0.22, 0.25, 0.30, 0.42, 0.47, 0.51, 0.55, 0.60, 0.71, 0.84, 0.87; and roots showed eight spots at Rf values of 0.05, 0.15, 0.21, 0.28, 0.41, 0.50, 0.71, 0.84. Under 366 nm, seed extracts displayed 9 bands at Rf values of 0.04, 0.07, 0.16, 0.24, 0.27, 0.34, 0.37, 0.82, and 0.87; leaf extracts showed 12 bands at Rf values of 0.06, 0.14, 0.21, 0.24, 0.28, 0.32, 0.38, 0.51, 0.69, 0.83, 0.89, and 0.92; stem extracts displayed 13 bands at Rf values of 0.06, 0.15, 0.21, 0.24, 0.33, 0.37, 0.43, 0.51, 0.64, 0.69, 0.74, 0.83, 0.90. Both leaf and stem extracts exhibited distinct red fluorescent bands at Rf values of 0.24, 0.28, 0.92, and 0.90, respectively, characteristic of chlorophyll pigments, indicating the presence of abundant chlorophyll in the aerial parts. The red fluorescent are, characteristic of the chlorophyll pigments of plants. These pigments based zones were found to be characteristic features of the aerial parts (22). Roots displayed nine spots at Rf values of 0.06, 0.19, 0.23, 0.31, 0.36, 0.70, 0.74, 0.82, and 0.89, without red fluorescent bands, suggesting these are unique to aerial parts and can be used to detect the admixture of aerial parts with roots. The red fluorescent bands are due to the presence of chlorophyll, which is abundant in the aerial photosynthetic parts. Derivatization with anisaldehyde-sulfuric acid revealed violet, blue, and grey bands at various Rf values across all extracts. Comparatively, seeds displayed 9 bands, leaves 15 bands, stems 14 bands, and roots 9 bands at different Rf values. After derivatization with Dragendorff’s reagent, seeds showed 3 spots, leaves 13 spots, stems 11 spots, and roots only 4 bands. The presence of alkaloid-containing orange zones was higher in leaves and stems than in roots and seeds, indicating a higher concentration of alkaloids in the aerial parts. Similarly, the number of triterpenoids and plant sterols was greater in the aerial parts than in the roots and seeds, with leaves and stems showing similar constituents in the HPTLC profile (Figure 3, Table 5).
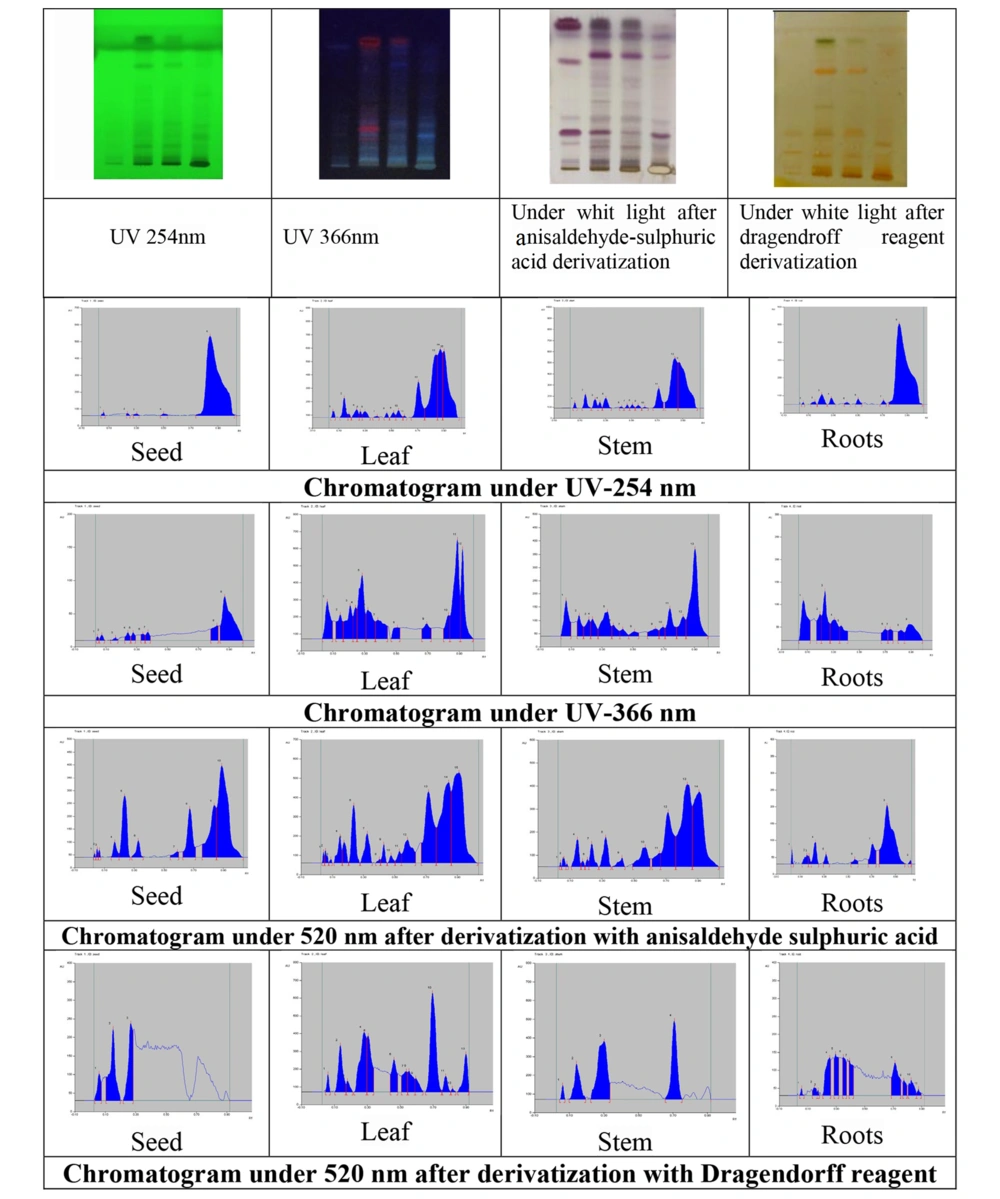
Figure 3.
High-performance thin layer chromatography (HPTLC) chromplate and chromatogram of the different extracts of Withania somnifera
Table 5.
High-Performance Thin Layer Chromatography Fingerprint After Derivatization with Dragendorff Reagent
| Rf Value | Area (AU) | |
|---|---|---|
| Seed | 0.06 | 1562.50 |
| 0.15 | 5997.90 | |
| 0.26 | 5480.10 | |
| - | - | |
| - | - | |
| - | - | |
| - | - | |
| - | - | |
| - | - | |
| - | - | |
| - | - | |
| - | - | |
| - | - | |
| Leaf | 0.06 | 1060.00 |
| 0.13 | 6266.70 | |
| 0.18 | 1123.30 | |
| 0.28 | 11609.70 | |
| 0.30 | 7839.20 | |
| 0.46 | 4930.80 | |
| 0.54 | 3165.40 | |
| 0.55 | 3351.40 | |
| 0.59 | 1636.50 | |
| 0.69 | 16926.60 | |
| 0.78 | 1790.70 | |
| 0.82 | 243.10 | |
| 0.90 | 4786.80 | |
| Stem | 0.05 | 173.40 |
| 0.14 | 491.60 | |
| 0.17 | 111.20 | |
| 0.25 | 3212.70 | |
| 0.29 | 2916.80 | |
| 0.35 | 2332.90 | |
| 0.39 | 2220.40 | |
| 0.71 | 3468.10 | |
| 0.77 | 850.00 | |
| 0.83 | 1318.80 | |
| 0.88 | 278.30 | |
| - | - | |
| - | - | |
| Root | 0.06 | 814.80 |
| 0.14 | 5570.30 | |
| 0.30 | 15787.30 | |
| 0.71 | 11839.00 | |
| - | - | |
| - | - | |
| - | - | |
| - | - | |
| - | - | |
| - | - | |
| - | - | |
| - | - | |
| - | - |
4.7. Nuclear Magnetic Resonance-Based Metabolic Characterization W. somnifera Extracts
The 1H nuclear magnetic resonance spectroscopy has proven to be a valuable tool for the phytochemical analysis of W. somnifera (22). This study employed 1H-NMR to characterize the metabolic profiles of the roots, leaves, stems, and seeds of W. somnifera. The NMR spectral fingerprint is presented in Figure 4. The peak for DMSO-d6 was consistently observed at 2.50 ppm across all spectra. The NMR spectra disclosed distinct variations in metabolites among the different plant parts. For the roots, NMR signals ranged from δH 0.83 to 3.02 ppm, corresponding to methylene, methine, secondary, and quaternary methyl groups. Peaks at 6.67, 6.61, 6.50, 6.38, 6.25 ppm were indicative of the characteristic shifts of unsaturated protons of withanolide lactone, and signals at 5.66, 5.64, 5.39, 5.35, 5.31, 5.18, 4.91, 4.65, 4.50, 4.35, 4.30, 4.26, 4.22, 3.91, 3.87, 3.83, 3.81 ppm were attributed to oxymethine and oxymethylene protons. Peaks around δH 6.10 to 6.5 corresponded to characteristic shifts of unsaturated protons at positions 2 and 3 of withanolide lactone, with peaks at δH 0.85, 0.83, 0.86, 1.15, 1.17, 1.23, 1.49, 1.91, 2.16 associated with methyl groups and quaternary methyl groups of steroidal lactone (23, 24). These spectral signal patterns are characteristic of withanolide steroidal lactones found in the roots of W. somnifera.
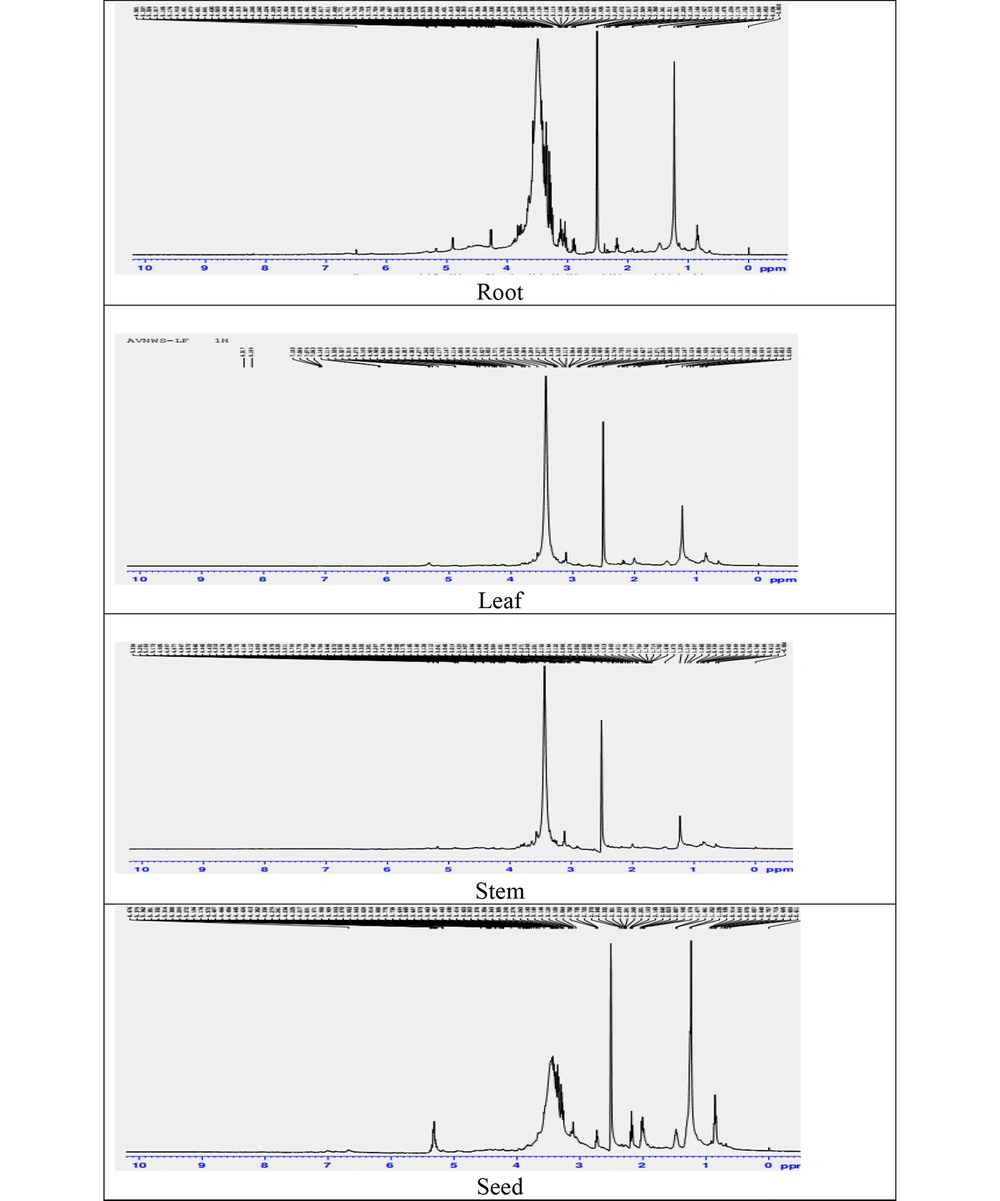
Figure 4.
1H nuclear magnetic resonance data of Withania somnifera roots, stems, leaves, and seeds
The leaf NMR spectra exhibited a broad range of metabolites between δ 0.61 - 8.31 ppm. Resonances in the aromatic region from 7.06 - 8.31 ppm were identified for secondary plant metabolites like flavonoids kaempferol and phenolics such as ferulic acid and chlorophyll pigments (25, 26). Signals between δH 0.68 - 2.27 corresponded to methylene, methine, secondary, and quaternary methyl moieties, the signals at δH 6.14, 6.11, 5.33, and 5.31 ppm, with oxymethine and oxymethylene protons observed at δH -4.90, 4.54, 4.41, 4.30, 4.27, 4.23, 4.17, 4.14, 4.11, 4.08, 3.98, and 3.82 ppm, indicative of the ergostane skeleton-based C-28 steroidal lactones known as withanolides (27, 28). A similar pattern of NMR signals in the stem and leaf extracts suggested the presence of similar withanolide class compounds. Across all samples, the resonance of steroidal compounds in the range of 0.7 to 2.8 ppm was notably abundant, with the leaf extract exhibiting the highest diversity of metabolites (Table 6).
Table 6.
1H NMR Spectroscopic Data of the Extracts of Different Parts of Withania somnifera
| Herbal Extracts | 1H NMR Characteristic Signals, δH (ppm) in DMSO-d6 at 600 MHz |
|---|---|
| Roots | 6.67, 6.61, 6.50, 6.38, 6.25,5.66, 5.64, 5.39, 5.35, 5.31, 5.18, 4.91, 4.65, 4.50, 4.35, 4.30, 4.26, 4.22, 3.91, 3.87, 3.83, 3.81, 3.77, 3.74, 3.71, 3.70, 3.66, 3.65, 3.63, 3.57, 3.49, 3.41, 3.38, 3.35, 3.30, 3.29, 3.26, 3.15, 3.13, 3.11, 1.09, 3.06, 3.04, 3.02, 2.93, 2.87, 2.38, 2.35, 2.31, 2.30, 2.18, 2.16, 1.92, 1.91, 1.49, 1.23, 1.17, 1.15, 0.86, 0.85, 0.83 |
| Stem | 6.61, 6.23, 6.14, 6.11, 5.86, 5.83, 5.33, 5.25, 5.18, 4.90, 4.87, 4.57, 4.44, 4.31, 4.17, 3.89. 3.82, 3.79, 3.75, 3.64, 3.57, 3.74, 3.64, 3.57, 3.43, 3.32, 3.30, 3.28, 3.17, 3.06, 3.01, 2.92, 2.88, 2.62, 2.40, 2.35, 2.27, 2.20, 2.07, 1.95, 1.91, 1.84, 1.77, 1.75, 1.70, 1.69, 1.47, 1.22, 1.14, 1.09, 0.95, 0.93, 0.86, 0.83, 0.78, 0.64. 0.59. |
| Leaf | 8.31, 8.18, 7.10, 7.07, 6.14, 5.33, 5.31, 4.90, 4.54, 4.41, 4.30, 4.27, 4.23, 4.17, 4.14, 4.11, 4.08, 3.98, 3.82, 3.77, 3.70, 3.57, 3.43, 3.30, 3.24, 3.16, 3.12, 3.06, 2.93, 2.88, 2.74, 2.72, 2.68, 2.62, 2.27, 2.20, 2.18, 2.16, 2.12, 1.93, 1.49, 1.47, 1.23, 1.15, 1.10, 1.05, 0.93, 0.91, 0.85, 0.83, 0.78, 0.68, 0.64, 0.61. |
| Seed | 7.12, 7.02, 6.98, 6.88, 6.69, 5.37, 5.35, 5.31, 5.30, 5.27, 5.18, 5.16, 4.94, 4.87, 4.66, 4.61, 4.58, 4.48, 4.45, 4.44, 4.42, 4.35, 4.27, 4.23, 3.97, 3.90, 3.87, 3.84, 3.80, 3.77, 3.69, 3.66, 3.57, 3.46, 3.44, 3.41, 3.40, 3.37, 3.34, 3.30, 3.26, 3.18, 3.14, 3.06, 2.75, 2.37, 2.29, 2.20, 2.04, 2.02, 1.99, 1.47, 1.25, 0.93, 0.89, 0.85, 0.75, 0.68, 0.61. |
4.8. Conclusions
This phytochemical investigation highlighted the presence of alkaloids, phenolics, flavonoids, phytosterols, triterpenes, carbohydrates, and sugars. High-performance thin layer chromatography analysis emerged as a straightforward, fast, and effective method for quality control. This study performed a comparative analysis of different parts of W. somnifera, revealing that HPTLC fingerprints for the leaves, roots, stems, and seeds differ, enabling the differentiation of its various parts. The aerial parts (leaves and stems) exhibited a greater number of TLC bands for alkaloids, phytosterols, and triterpenoids compared to the roots and seeds. The leaves and stems displayed distinct red fluorescence zones indicative of chlorophyll-based pigments present in the aerial parts, which were missing in the roots and seeds. The NMR spectra of extracts from different parts of W. somnifera were unique, suggesting their use as an additional tool for the quality control of W. somnifera roots. The leaf extract's NMR fingerprint showed a greater chemical diversity compared to other plant parts, making proton NMR a valuable parameter for the identification, differentiation, and analysis of raw materials. This comprehensive approach is beneficial for the quality analysis of W. somnifera, ensuring the superior quality of raw materials for effective herbal medicine and dietary supplements.