
1. Background
Today, awareness of the health benefits of functional foods has made these materials the subject of much research. In the design of functional foods, special attention is paid to the use of antioxidant compounds that exist in nature in a mixed form. In addition to being used in the food industry, antioxidant compounds are applied in the cosmetics and skincare industries. Antioxidant compounds are mainly phenolic compounds. Phenolic compounds are a large group, ranging from simple compounds such as hydroxycinnamic acids, hydroxybenzoic acids, and stilbenes, to highly complex structures such as flavonols, catechins, anthocyanins, and proanthocyanidins, etc. (1). Flavonoids are widely distributed in plants, mainly vegetables, fruits, tea, etc. They comprise a large group of compounds with several phenolic hydroxyl groups attached to ring structures, conferring antioxidant properties (2). The main roles of antioxidant compounds are related to preventing reactive species formation, scavenging free radicals, forming complexes with prooxidant metals, quenching photosensitizers and singlet oxygen, enzyme activation or deactivation, and repairing or removing damage caused by reactive species (3). Additionally, it has been proven that many polyphenol properties, such as anti-inflammatory, anti-cancer, anti-diabetes, and prevention of permeation and capillary fragility, are due to their antioxidant effects (4).
One of the antioxidant compounds is quercetin. Quercetin is a flavonoid compound present in many plant sources like onion, broccoli, lettuce, citrus, buckwheat, berries, and olive oil. Quercetin is used as a colorant, food additive, and raw material for the cosmetic, pharmaceutical, and fine chemical industries (5). The basic role in the antioxidant activity of quercetin is related to a hydroxyl group in C3, a double bond between C2 - C3, a carbonyl group in C4 (on ring C), and polyhydroxylated A and B aromatic rings (Figure 1) (6).
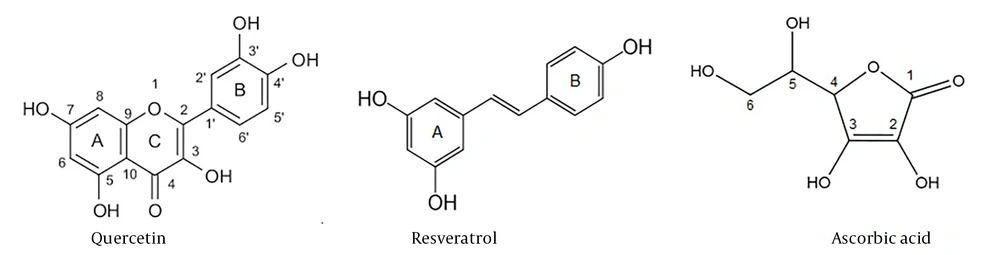
Figure 1.
The structure of quercetin, resveratrol, and ascorbic acid
Another antioxidant is resveratrol. Resveratrol (trans-3,4ʹ,5-trihydroxystilbene) is a phytoalexin found in various dietary sources, including plums, grapes, and peanuts (7). Resveratrol is a stilbene with antioxidant, immunomodulatory, anti-inflammatory, glucose and lipid regulatory, cardiovascular protective, and neuroprotective properties (8). Its antioxidant activity is attributed to the hydrogen transfer capacity of three phenolic groups and the trans-isomerism of the double bond (Figure 1) (9).
Ascorbic acid (also known as vitamin C) is one of the main and best-known components necessary for the correct functioning of the human body. Vitamin C is an organic compound that belongs to the group of unsaturated polyhydroxy alcohols. It is soluble in water. Ascorbic acid is a strong reducing agent due to the presence of double bonds at the second and third carbons, as well as four hydroxyl groups in the second, third, fifth, and sixth carbon positions (Figure 1). Moreover, due to the proximity of the carbonyl and hydroxyl groups, ascorbic acid is an ideal electron or hydrogen donor, which makes it a cofactor for many enzymatic reactions in living organisms (10).
In recent decades, research concerning the antioxidant properties of phenolic compounds has increased, but data about their interaction in mixture systems are still rare. It has been found that in the case of a mixture of antioxidants, the antioxidant activity is not always the sum of the activity of each compound. The interaction between antioxidant mixtures can result in synergism, antagonism, or an additive effect. Therefore, recognizing the interaction and properties of these compounds allows for the selection of new antioxidant mixtures, which can better ensure their application in foods, pharmaceuticals, and cosmetic industries. Although some studies have been conducted on the antioxidant capacity of quercetin, resveratrol, and ascorbic acid, and some of their binary mixtures, the effect of antioxidant ratios and their concentrations in binary mixtures on the type of antioxidant effect has not been considered.
2. Objectives
Due to the importance of these compounds as potent antioxidants and their health benefits, this study aimed to assess antioxidant activity in binary mixtures of quercetin, resveratrol, and ascorbic acid in different concentrations and ratios using 1,1-diphenyl-2-picrylhydrazyl (DPPH) and ferric reducing antioxidant power (FRAP) tests.
3. Methods
3.1. Materials
Quercetin, resveratrol, Trolox, ascorbic acid, and DPPH were purchased from Sigma-Aldrich, Merck (St. Louis, MO, USA). Ethanol and methanol were of analytical grade and purchased from Merck (Darmstadt, Germany).
3.2. DPPH Assay
The quercetin, resveratrol, and ascorbic acid solutions were prepared at two concentration ranges: 50 - 250 µM and 100 - 500 µM in ethanol. The DPPH assay was performed according to Brand-Williams et al. with slight modifications (11). The stock solution of DPPH was prepared by dissolving 4.8 mg of DPPH in 20 mL methanol and was stored at -20°C until analysis. For analysis, the DPPH solution was diluted 5.5 times with methanol.
In the first step, 50 μL of different concentrations of quercetin, ascorbic acid, and resveratrol were added to 950 μL of the DPPH solution. In the second step, binary mixtures of these compounds — quercetin/resveratrol (Q/R), quercetin/ascorbic acid (Q/A), and resveratrol/ascorbic acid (R/A) — in concentration ranges of 50/250, 100/200, 150/150, 200/100, 250/50, and 100/500, 200/400, 300/300, 400/200, and 500/100 µM (25 µL of each compound) were added to 950 μL of the DPPH solution. The reaction was carried out for 1 hour in the dark.
The blank sample was prepared by adding 50 μL of ethanol to 950 μL of DPPH reagent. The absorbance was measured at 515 nm using a UV-Vis spectrophotometer (Lambda 25; PerkinElmer, Waltham, MA, USA). The percentage of radical scavenging was calculated using the following formula (Equation 1):
Where ‘Ab’ and ‘As’ are the absorbance values of the blank and the sample, respectively.
3.3. Ferric Reducing Antioxidant Power Assay
The FRAP assay is based on the increase in absorbance at 595 nm due to the formation of a 2,4,6-tripyridyl-s-triazine (TPTZ)-Fe2+ complex. The assay was performed according to Benzie and Strain (12). Stock reagents included FeCl3·6H2O solution (20 mM), acetate buffer (300 mM, pH = 3.6), and TPTZ solution (10 mM in 40 mM HCl). The working reagent was freshly prepared by mixing 2.5 mL of FeCl3·6H2O, 2.5 mL of TPTZ, and 25 mL of acetate buffer, and it was warmed to 37°C before use.
Quercetin, resveratrol, and ascorbic acid solutions were prepared at concentrations of 50 - 250 µM and 100 - 500 µM in ethanol. Then, 50 μL of different concentrations of each compound, and their binary mixtures (Q/R, Q/A, and R/A) in the concentration ranges of 50/250, 100/200, 150/150, 200/100, 250/50, and 100/500, 200/400, 300/300, 400/200, and 500/100 µM (25 µL of each compound), were added to 950 μL of the working reagent and incubated for 30 minutes at 37°C in the dark.
The absorbance was measured at 595 nm. A standard curve was obtained by measuring the absorbance of Trolox standard solutions in the range of 0 - 500 µM. Antioxidant activity was expressed in µM of Trolox equivalents.
3.4. Statistical Analysis
The experiment followed a completely randomized design with three replications. Data analysis was performed using one-way ANOVA. Significant differences were determined by Duncan’s multiple range test at P < 0.05. SAS software was used for statistical analysis.
4. Results and Discussion
4.1. Antioxidant Activity of Individual Antioxidants
The antioxidant activity of individual antioxidants was evaluated using DPPH and FRAP assays at two concentration ranges: 50 - 250 µM and 100 - 500 µM for each compound. The results are shown in Figure 2.
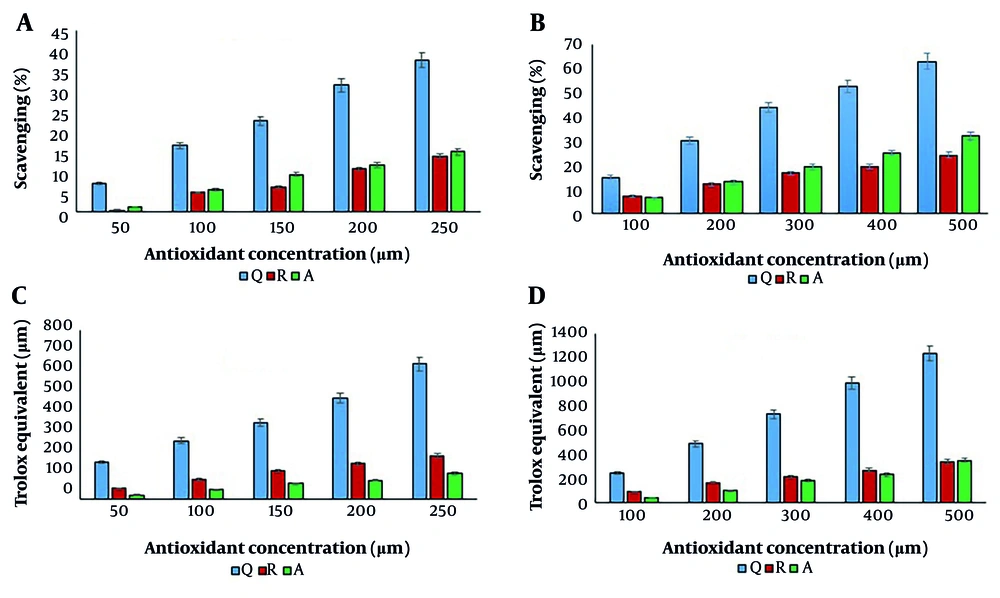
Figure 2.
The antioxidant activity of quercetin, resveratrol, and ascorbic acid; A and B, 1,1-diphenyl-2-picrylhydrazyl (DPPH) test; and C and D, ferric reducing antioxidant power (FRAP) test (Q: Quercetin, R: Resveratrol, A: Ascorbic acid). In both concentration ranges, the difference between concentrations and antioxidant compounds was significant at P < 0.05.
As shown, the antioxidant activity significantly increased with concentration, regardless of the assay method used. Quercetin exhibited the highest antioxidant activity in both methods, followed by ascorbic acid and resveratrol in the DPPH assay, and resveratrol and ascorbic acid in the FRAP assay. As previously mentioned, the high antioxidant activity of quercetin is attributed to the presence of a hydroxyl group at C3, a double bond between C2 - C3, a carbonyl group at C4 (on ring C), and polyhydroxylated A and B aromatic rings.
Similar results were observed in a study by Skroza et al. (8), who reported the highest DPPH free radical scavenging activity for gallic acid, followed by quercetin, caffeic acid, catechin, and resveratrol. They also found that quercetin had the highest FRAP value. In another study, quercetin demonstrated the highest antioxidant capacity using the oxygen radical absorbance capacity (ORAC) method among six compounds: Quercetin, rutin, morin, naringin, ascorbic acid, and Trolox (2).
According to Figure 2, the radical scavenging activity of ascorbic acid was higher than that of resveratrol. However, its reducing power was lower than that of resveratrol. In another study, ascorbic acid demonstrated higher DPPH radical scavenging activity than resveratrol (13). Although resveratrol showed greater reducing power at lower concentrations (50 - 250 µM), the difference in reducing power between resveratrol and ascorbic acid diminished at higher concentrations. At 500 µM, the FRAP value of ascorbic acid was slightly higher than that of resveratrol; however, this difference was not statistically significant. In contrast, a study by Pulido et al. (14) reported that ascorbic acid exhibited a higher reducing power than resveratrol using the FRAP test, which differs from the findings of the present study.
4.2. Antioxidant Activity of Binary Mixtures of Antioxidants
To assess the interaction type between binary mixtures of antioxidant compounds, mixtures were prepared in two concentration ranges: 50 - 250 µM and 100 - 500 µM for each compound. Initially, the antioxidant capacity of binary mixtures of Q/R, Q/A, and R/A was evaluated in ratios of 50/250, 100/200, 150/150, 200/100, and 250/50 µM using DPPH and FRAP assays. The results are shown in Figure 3.
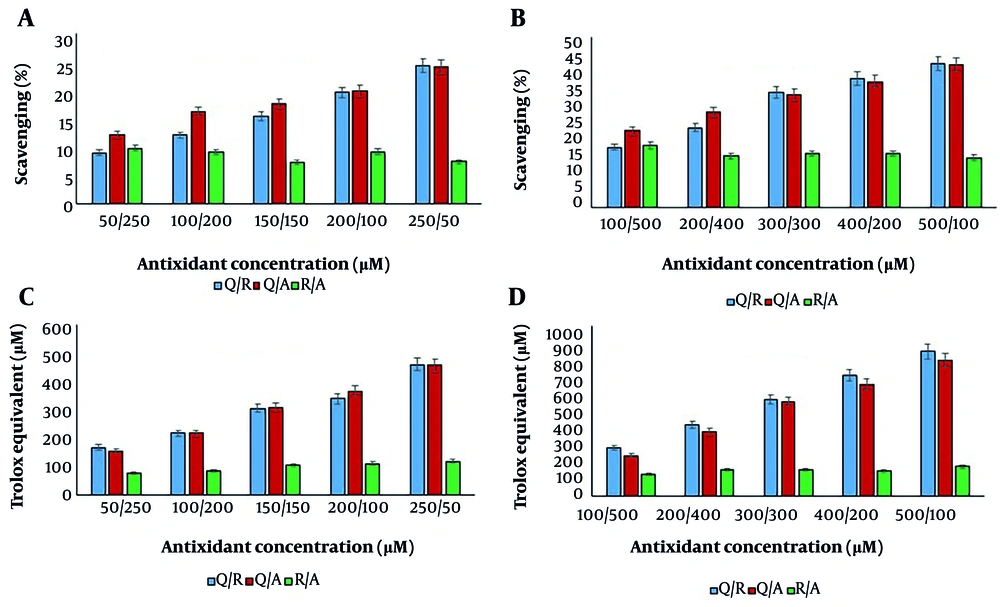
Figure 3.
The antioxidant activity of binary mixtures of antioxidant compounds (Q: Quercetin, R: Resveratrol, A: Ascorbic acid) using 1,1-diphenyl-2-picrylhydrazyl (DPPH) (A, B); and ferric reducing antioxidant power (FRAP) (C, D) tests. In both concentration ranges, the difference between ratios and antioxidant compounds was significant at P < 0.05.
According to Figure 3, the antioxidant activity increased with the concentration of quercetin in the Q/R and Q/A mixtures, as observed using both assay methods. This may be attributed to the higher antioxidant activity of quercetin compared to resveratrol and ascorbic acid. However, in the R/A mixture, antioxidant activity increased in the FRAP assay and slightly decreased in the DPPH assay. In the DPPH test, the highest antioxidant activity for the R/A mixture was observed at a concentration of 50/250 µM, whereas in the FRAP test, the highest activity was found at a concentration of 250/50 µM.
These results are consistent with the antioxidant activity of the individual compounds — resveratrol and ascorbic acid — measured using the DPPH and FRAP tests. This indicates the higher radical scavenging activity of ascorbic acid and the higher reducing power of resveratrol.
In the second step, the antioxidant capacity of the binary mixtures Q/R, Q/A, and R/A was evaluated at higher concentrations with the same ratios: 100/500, 200/400, 300/300, 400/200, and 500/100 µM, using both DPPH and FRAP assays. The obtained data were in full agreement with the results of the first step. That is, the antioxidant activity of the binary mixtures, using both DPPH and FRAP methods, was lower than the sum of the antioxidant activities of the individual compounds (Figures 4 and 5).
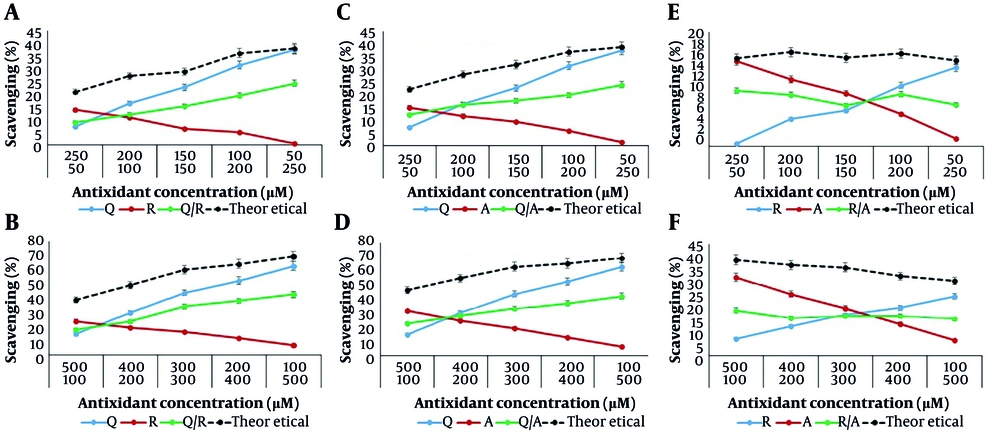
Figure 4.
The antioxidant activity changes by the 1,1-diphenyl-2-picrylhydrazyl (DPPH) method for systems containing different concentrations of quercetin, resveratrol, ascorbic acid, and their binary mixtures in concentration ranges of 50 - 250 µM (A, C, E); and 100 - 500 µM (B, D, F). Some of the error bars are covered by symbols.
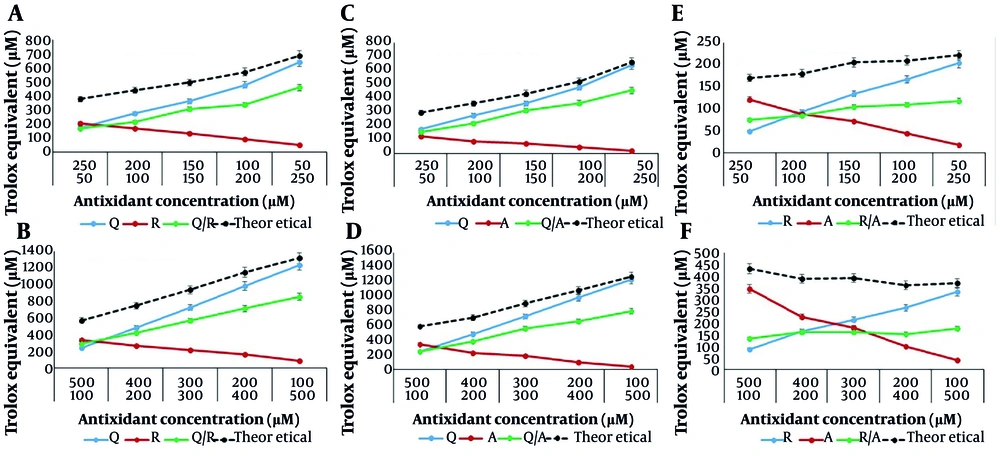
Figure 5.
The antioxidant activity changes by the ferric reducing antioxidant power (FRAP) method for systems containing different concentrations of quercetin, resveratrol, ascorbic acid, and their binary mixtures in concentration ranges of 50 - 250 µM (A, C, E); and 100 - 500 µM (B, D, F). Some of the error bars are covered by symbols.
So, the observed effect among the binary mixtures of Q/R, Q/A, and R/A was antagonism. As previously mentioned, the antioxidant activity in mixtures of antioxidants is not always equivalent to the sum of the activities of the individual antioxidants. In chemistry, antagonism is defined as a phenomenon where two or more agents in a mixture produce a lesser overall effect than the sum of their individual effects (15).
In the first step, concentrations ranging from 50 - 250 µM were used for binary mixtures of antioxidants in ratios of 1:5, 1:2, 1:1, 2:1, and 5:1. The data obtained for all ratios demonstrated an antagonistic effect among the binary mixtures. In the second step, binary mixtures were tested at the same ratios but at higher concentrations (100 - 500 µM), and similar antagonistic effects were observed across all ratios. Additionally, the binary mixtures were assayed at other ratios and concentrations using both DPPH and FRAP methods. The results consistently indicated an antagonistic effect among the antioxidant compounds (Appendix 1 in Supplementary File). Thus, the antioxidant interaction among the binary mixtures of Q/R, Q/A, and R/A was antagonistic across various ratios and concentrations.
Similar results were reported for mixtures such as Q/A and quercetin/Trolox at a concentration of 5 µM using the ORAC method (2). In another study, a mixture of caffeic acid, gallic acid, ferulic acid, and quercetin, and a combination of this mixture with synthetic antioxidants such as butylated hydroxyanisole (BHA), butylated hydroxytoluene (BHT), propyl gallate, octyl gallate, and tert-butyl hydroquinone (TBHQ), showed additive effects using the FRAP test (16).
Skroza et al. (8) confirmed an antagonistic effect between quercetin and resveratrol (1:1) using the FRAP test and Briggs–Rauscher (BR) oscillating reactions. An antagonistic effect was also observed in pairs such as kaempferol/quercetin and myricetin/quercetin at a concentration of 0.01 mg/mL [ratios (v/v) 20/80, 50/50, and 80/20] using the DPPH and 2,2′-azinobis (3-ethylbenzothiazoline-6-sulfonic acid (ABTS) methods. However, these same pairs showed additive effects at higher concentrations of 0.03 and 0.06 mg/mL using the DPPH method. Additionally, the kaempferol/quercetin mixture showed an additive effect at 0.03 and 0.06 mg/mL using the ABTS method, while the myricetin/quercetin pair continued to show an antagonistic effect at these concentrations using the same method (17).
In another study, the quercetin/tocotrienol mixture (1:1) at a concentration of 1 µM exhibited a synergistic effect in a linoleic acid emulsion, but this effect diminished with increasing concentrations (5 - 10 µM) (18). Furthermore, a quercetin/BHT mixture (5:1) demonstrated a synergistic effect using the DPPH method and was found effective in preserving beef patties (19). Similarly, mixtures of quercetin/gallic acid, quercetin/catechin, and quercetin/catechin/gallic acid showed synergistic effects when tested using DPPH, FRAP, and ABTS methods (20).
To evaluate the influence of antioxidant ratios on the antagonistic effect, the difference percentage (D%) was calculated as follows (Equation 2).
Where Aab is the antioxidant activity of the binary mixture, and Aa and Ab are the antioxidant activities of the individual compounds.
The results are shown in Table 1. According to the table, the difference percent for the Q/R mixture decreased with increasing quercetin concentration, and the lowest difference was observed at concentration ratios of 500/100 µM and 250/50 µM, regardless of the assay method used. Similar results were obtained for the Q/A mixture at the 100 - 500 µM concentration range. However, different results were observed in the 50 - 250 µM range. In this range, the lowest difference was observed at the 250/50 ratio using the DPPH assay and at the 150/150 ratio using the FRAP assay. Nonetheless, the difference between the 150/150 and 250/50 ratios was not statistically significant.
Table 1.
The Results of Antioxidant Activity in Antioxidant Binary Mixtures
| Antioxidants | Q/R | Q/A | R/A | ||||||
|---|---|---|---|---|---|---|---|---|---|
| E | T | D% | E | T | D% | E | T | D% | |
| DPPH results | |||||||||
| 100/500 | 17.84 ± 4.21 | 38.63 | -53.81 | 22.66 ± 1.1 | 46.43 | -51.19 | 18.37 ± 4.04 | 38.63 | -52.42 |
| 200/400 | 23.54 ± 0.35 | 49.14 | -52.1 | 28.2 ± 0.63 | 54.58 | -48.31 | 15.24 ± 1.205 | 36.6 | -58.35 |
| 300/300 | 33.94 ± 1.75 | 60.08 | -43.5 | 33.18 ± 1.37 | 62.84 | -47.2 | 16 ± 3.23 | 35.68 | -55.14 |
| 400/200 | 37.96 ± 1.97 | 64.21 | -40.88 | 37.08 ± 1.58 | 65.17 | -43.1 | 16 ± 0.75 | 32.12 | -50.17 |
| 500/100 | 42.43 ± 1.35 | 69.76 | -39.17 | 42.05 ± 0.98 | 69.07 | -39.11 | 14.82 ± 2.45 | 30.13 | -50.82 |
| 50/250 | 8.92 ± 0.76 | 20.87 | -57.25 | 12.17 ± 2.96 | 22.05 | -44.8 | 9.73 ± 1.12 | 15.45 | -37.02 |
| 100/200 | 11.98 ± 2.14 | 27.08 | -55.73 | 16.14 ± 0.57 | 28.15 | -42.66 | 9.03 ± 1.28 | 16.51 | -45.3 |
| 150/150 | 15.33 ± 1 | 28.81 | -46.79 | 17.57 ± 0.93 | 31.9 | -44.89 | 7.18 ± 1.23 | 15.5 | -53.65 |
| 200/100 | 19.49 ± 0.75 | 36.24 | -46.2 | 19.85 ± 0.06 | 37.06 | -46.41 | 9.12 ± 1.29 | 16.26 | -43.88 |
| 250/50 | 24.21 ± 0.94 | 38.08 | -36.42 | 23.96 ± 2.16 | 38.88 | -38.36 | 7.31 ± 1.05 | 15.06 | -51.42 |
| FRAP results | |||||||||
| 100/500 | 287.8 ± 24.48 | 572.66 | -49.74 | 241.6 ± 13.16 | 585.6 | -58.74 | 131.26 ± 3.23 | 431.46 | -69.57 |
| 200/400 | 421.4 ± 10.82 | 747.46 | -43.62 | 383.6 ± 28.12 | 708.93 | -45.89 | 159 ± 4.21 | 389.2 | -59.14 |
| 300/300 | 569.4 ± 39.81 | 939.2 | -39.37 | 558.8 ± 29 | 906.4 | -38.34 | 160.06 ± 15.72 | 392.4 | -59.2 |
| 400/200 | 712.6 ± 24.48 | 1149.86 | -38.02 | 658.4 ± 21.13 | 1082.8 | -39.19 | 150.86 ± 5.89 | 360.66 | -58.17 |
| 500/100 | 852.6 ± 18.15 | 1320.66 | -35.44 | 798.4 ± 44.59 | 1273.06 | -37.28 | 175.8 ± 12.64 | 370.93 | -52.6 |
| 50/250 | 166.4 ± 10.02 | 377.06 | -55.86 | 153.6 ± 3.41 | 294.53 | -47.84 | 74.6 ± 14.27 | 169.73 | -56.04 |
| 100/200 | 215.46 ± 1.66 | 441.33 | -51.17 | 215.73 ± 5.6 | 361.86 | -40.38 | 84.33 ± 8.94 | 180 | -53.14 |
| 150/150 | 304.26 ± 5.66 | 495.33 | -38.57 | 308.4 ± 1.74 | 432.66 | -28.72 | 103.93 ± 14.08 | 205.2 | -49.35 |
| 200/100 | 337.33 ± 3.84 | 570.93 | -40.91 | 364.4 ± 4.54 | 521.2 | -30.08 | 109 ± 13 | 209.73 | -48.02 |
| 250/50 | 458.53 ± 6.14 | 688.26 | -33.37 | 455.46 ± 5.06 | 657.6 | -30.73 | 117.66 ± 10.21 | 221.6 | -46.9 |
Abbreviations: Q, quercetin; R, resveratrol; A, ascorbic acid; E, experimental; T, theoretical; D%, difference percent; DPPH, 1,1-diphenyl-2-picrylhydrazyl; FRAP, ferric reducing antioxidant power.
Overall, for the Q/A mixture, the differences among the various ratios using the DPPH test were not significant. For the R/A mixture, the lowest difference was recorded at ratios of 400/200 µM and 50/250 µM using the DPPH method, though in general, the differences across the ratios were not significant (Appendix 1 in Supplementary File). However, the results obtained from the FRAP assay for the R/A mixture were similar to those of the Q/R mixture, with the lowest differences found at the 500/100 µM and 250/50 µM ratios.
According to Appendix 1 in Supplementary File, different patterns were observed for other concentration levels and ratios in the binary mixtures of Q/R, Q/A, and R/A.
A comparison between the obtained difference percent for the concentration ranges of 50 - 250 µM and 100 - 500 µM (Figure 6) did not show a significant difference for the Q/R mixture using either assay method (Appendix 1 in Supplementary File).
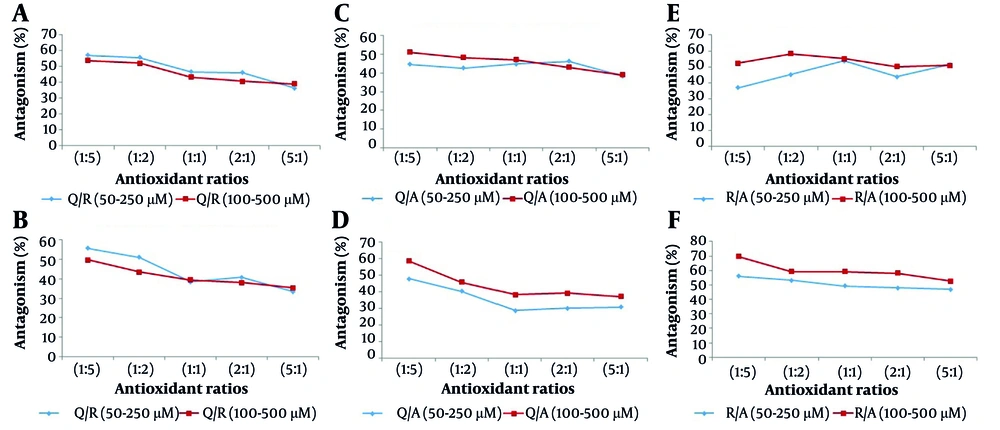
Figure 6.
Changes of the difference percent in binary mixtures of quercetin/resveratrol (Q/R), quercetin/ascorbic acid (Q/A), and resveratrol/ascorbic acid (R/A) in various ratios of antioxidant compounds using A, C and E, DPPH; and B, D, F, FRAP tests
This means that at the same ratio, the difference percent does not change significantly with an increase in the concentration of antioxidant mixtures. Therefore, in cases where lower antioxidant activity is desired, lower concentrations of antioxidant compounds can be utilized.
For the Q/A mixture, the results showed a significant difference when using the FRAP test, but an insignificant difference with the DPPH test. The results obtained for the R/A mixture were similar to those of the Q/A mixture.
As a result, the choice of antioxidant activity assay method can influence the observed magnitude of antagonism. The extent of the antagonistic effect depends not only on the interactions between individual components, their concentrations, and the method applied for assessing antioxidant properties (17), but also on the ratio of antioxidant mixtures.
Additionally, we calculated the correlation between the DPPH and FRAP methods for both individual antioxidants and their binary mixtures (Figures 7 and 8).
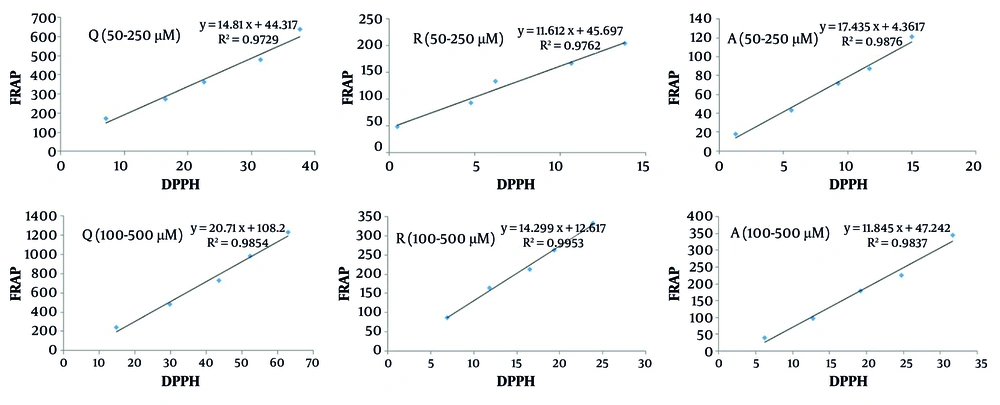
Figure 7.
The correlation of DPPH and FRAP methods for individual antioxidants of quercetin (Q), resveratrol (R), and ascorbic acid (A) in concentration ranges of 50 - 250 µM and 100 - 500 µM
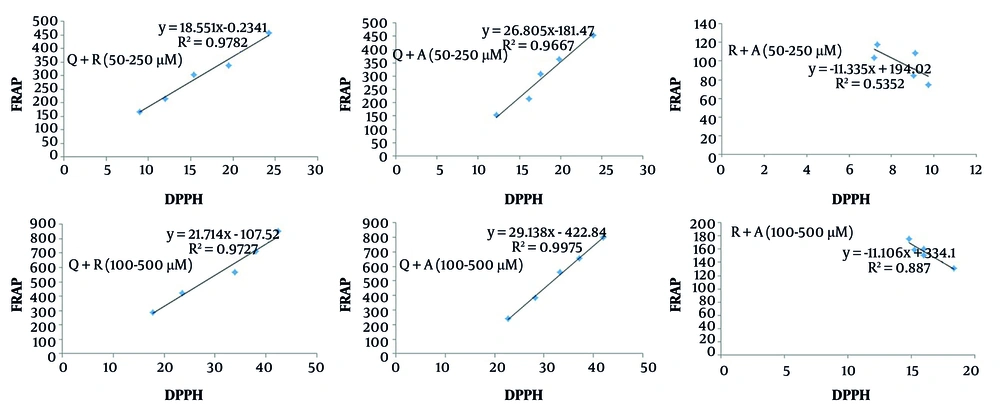
Figure 8.
The correlation of DPPH and FRAP methods for binary mixtures of quercetin/resveratrol (Q+R), quercetin/ascorbic acid (Q+A), and resveratrol/ascorbic acid (R+A) in concentration ranges of 50 - 250 µM and 100 - 500 µM
According to Figure 7, a high correlation (> 0.97) was observed for individual antioxidants between the DPPH and FRAP tests. Similarly, the binary mixtures of Q/R and Q/A demonstrated a strong correlation (> 0.96) between the two assay methods (Figure 8). However, for the R/A mixture, a lower correlation was observed. This may be attributed, as mentioned earlier, to the stronger radical scavenging activity of ascorbic acid and its comparatively weaker reducing power relative to resveratrol. This indicates that the antioxidant interaction type in the R/A mixture cannot be reliably predicted using only one antioxidant activity assay method.
According to literature, several mechanisms have been proposed to explain the antagonistic effect observed in complex mixtures. These include: The regeneration of the weaker antioxidant by the stronger one, the formation of complexes or adducts between antioxidants, antioxidant polymerization that reduces activity, irreversible reactions of free antioxidant radicals (e.g., with oxygen), and other undefined mutual interactions between antioxidants (21).
In line with these explanations, the proposed mechanism for the antagonistic effect between quercetin and resveratrol involves undefined mutual interactions (8, 22, 23). Additionally, the observed antagonism between quercetin and ascorbic acid in the DPPH assay has been attributed to the regeneration of ascorbic acid by quercetin through hydrogen atom donation (24). Another study using ABTS and ORAC assays suggested that irreversible reactions of free antioxidant radicals — such as reactions with oxygen leading to radical loss — may explain the antagonism observed between quercetin and ascorbic acid (25).
Therefore, it can be concluded that the method used to assess antioxidant activity affects both the magnitude and the likely mechanism of the antagonistic effect. Furthermore, the mechanism of antagonism between ascorbic acid and resveratrol remains unclear. It may involve regeneration of less effective antioxidants by stronger ones or other undefined mutual interactions.
Overall, based on the results of this study, a 5:1 ratio of stronger to weaker antioxidants is recommended to achieve the lowest level of antagonism in binary mixtures of Q/R, Q/A, and R/A. This is particularly important for preserving antioxidant capacity in formulations intended for skincare or the development of functional foods.
5. Conclusions
The results of this study demonstrated the superior antioxidant activity of quercetin compared to ascorbic acid and resveratrol. An antagonistic effect was observed in binary mixtures of Q/R, Q/A, and R/A across various ratios and concentrations, using both DPPH and FRAP methods. The magnitude of the observed antagonism depended on multiple factors, including the mutual interactions of individual components, their concentrations, the assay method used, and the ratio of antioxidant mixtures.
Notably, a 5:1 ratio of stronger to weaker antioxidants resulted in lower antagonism, making it a promising strategy for optimizing antioxidant retention in formulations. These findings have practical implications for selecting suitable antioxidant mixtures in the cosmetic, pharmaceutical, and food industries — particularly in the design of functional foods, dietary supplements, and stabilization of fats, oils, and other food systems.
However, the precise mechanisms underlying these antioxidant interactions require further investigation. Additionally, in practical applications involving real matrices such as food products or cosmetic creams, the composition and properties of the matrix may influence the type and degree of antioxidant interactions. Therefore, matrix effects should be carefully considered when selecting and applying antioxidant mixtures.