


1. Background
2. Objectives
3. Methods
3.1. Study Design, Setting, and Subjects
3.2. Sample Size
3.3. Study Procedure
3.4. Statistical Analysis
4. Results
4.1. Patient Characteristics
| Parameters | All Patients (N = 98) | Patients with Controlled T2DM (n = 24) | Patients with Uncontrolled T2DM (n = 74) | P c |
|---|---|---|---|---|
| Age (y) | 56.5 ± 11.3 | 59.7 ± 11.5 | 55.1 ± 11.4 | 0.092 d |
| Females | 53 (54.1) | 12 (50) | 41 (55.4) | 0.815 e |
| Weight (kg) | 61.2 ± 11.6 | 63.4 ± 12.8 | 61.0 ± 12.0 | 0.528 d |
| Height (cm) | 156.3 ± 9.7 | 155.3 ± 7.8 | 157.0 ± 10.1 | 0.518 f |
| Body Mass Index (kg/m2) | 25.0 ± 3.4 | 26.3 ± 5.0 | 24.8 ± 4.0 | 0.143 f |
| Duration of diabetes (y) | 7.5 ± 5.7 | 7.8 ± 5.3 | 6.3 ± 5.3 | 0.392 d |
| Baseline FBG (mg/dL) | 168.2 ± 68.6 | 95.1 ± 11.8 | 189.2 ± 63.4 | < 0.001 f |
| Family history of diabetes | 47 (48.0) | 11 (45.8) | 36 (48.6) | 1.000 e |
| HT | 50 (51.0) | 10 (41.7) | 40 (54.1) | 0.351 e |
| Duration of HT (y) | 6.8 ± 4.9 | 9.0 ± 5.0 | 6.4 ± 4.9 | 0.362 f |
| Baseline SBP (mmHg) | 128.9 ± 14.9 | 124.8 ± 13.9 | 130.27 ± 15.0 | 0.105 f |
| Baseline DBP (mmHg) | 81 ± 6.8 | 77.9 ± 7.8 | 82.0 ± 6.2 | 0.058 f |
| Alcoholics | 13 (13.3) | 3 (12.5) | 10 (13.5) | 1.000 e |
| Smokers | 6 (6.1) | 2 (8.3) | 4 (5.4) | 0.633 e |
| Physical activity | 0.516 g | |||
| Level 1 | 44 (44.9) | 13 (54.2) | 31 (41.9) | |
| Level 2 | 21 (21.4) | 5 (20.8) | 16 (21.6) | |
| Level 3 | 33 (33.7) | 6 (25.0) | 27 (36.5) | |
| Level 4 | 0 (0) | 0 (0) | 0 (0) |
Abbreviations: T2DM, type 2 diabetes mellitus; FBG, fasting blood glucose; SBP, systolic blood pressure; DBP, diastolic blood pressure; HT, hypertension.
a Controlled T2DM refers to FBG ≤ 110 mg/dL; uncontrolled T2DM refers to FBG > 110 mg/dL.
b Values are expressed as mean ± SD or No. (%).
c P < 0.05 was considered statistically significant.
d Unpaired t-test.
e Fisher’s exact test.
f Mann-Whitney test.
g Chi-square test were used for comparing the different parameters between the controlled and uncontrolled T2DM patients.
4.2. Antidiabetic and Antihypertensive Drugs Prescribed
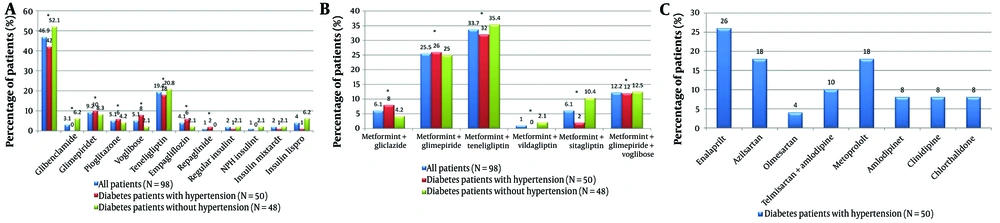
Antidiabetic and antihypertensive agents taken by the study population (A - C): A, the study analyzed antidiabetic drugs used by the population, comparing metformin users with those on other oral hypoglycemic agents. The chi-square test yielded a P-value of 0.273, showing no significant difference (P < 0.05). It also identified drugs from the national list of essential medicines (NLEM), 2015. NPH insulin, neutral protamine hagedorn (isophane) insulin; insulin mixtard, regular insulin (30%) + isophane insulin (70%); B, the study evaluated antidiabetic fixed-dose combinations (FDCs), comparing sulfonylureas-based metformin therapy with gliptin-based metformin therapy. The chi-square test resulted in a P-value of 0.610, indicating no significant difference (P < 0.05); C, the study assessed antihypertensive drugs used by the population, noting which were included in the NLEM, 2015. The * denotes the groups compared for the inferential statistics (computed P value).
4.3. Antidiabetic and Antihypertensive Drug Utilization Based on the World Health Organization-Anatomical Therapeutic Chemical/Defined Daily Dose System
| Drugs a | ATC Code | DDD | PDD b | PDD/DDD | Interpretation |
|---|---|---|---|---|---|
| Antidiabetic agents | |||||
| Metformin | A10BA02 | 2 g | 1.2 g | 0.6 | Underutilization |
| Glibenclamide | A10BB01 | 10 mg | 10 mg | 1 | Optimal utilization |
| Glimepiride | A10BB12 | 2 mg | 2.6 mg | 1.3 | Overutilization |
| Pioglitazone | A10BG03 | 30 mg | 26 mg | 0.9 | Underutilization |
| Voglibose | A10BF03 | 0.6 mg | 0.4 mg | 0.7 | Underutilization |
| Teneligliptin | Not assigned | - | 21 mg | - | - |
| Empagliflozin | A10BK03 | 17.5 mg | 22 mg | 1.2 | Overutilization |
| Repaglinide | A10BX02 | 4 mg | 2 mgd | 0.5 | Underutilization |
| Regular insulin | A10AB01 | 40 U | 75 Ud | 1.9 | Overutilization |
| Neutral protamine hagedorn (NPH, isophane) insulin | A10AC01 | 40 U | 15 Ud | 0.4 | Underutilization |
| Regular insulin (30%) + isophane insulin (70%) | A10AD01 | 40 U | 35 U | 0.9 | Underutilization |
| Insulin lispro | A10AB04 | 40 U | 41 U | 1 | Optimal utilization |
| Antihypertensive agents | |||||
| Enalapril | C09AA02 | 10 mg | 4 mg | 0.4 | Underutilization |
| Azilsartan | C09CA09 | 40 mg | 33 mg | 0.8 | Underutilization |
| Olmesartan | C09CA08 | 20 mg | 20 mg | 1 | Optimal utilization |
| Amlodipine | C08CA01 | 5 mg | 4 mg | 0.8 | Underutilization |
| Cilnidipine | C08CA14 | 10 mg | 8 mg | 0.8 | Underutilization |
| Metoprolol | C07AB02 | 0.15 g | 0.04 g | 0.3 | Underutilization |
| Chlorthalidone | C03BA04 | 25 mg | 13 mg | 0.5 | Underutilization |
Abbreviations: ATC, anatomical therapeutic chemical classification; DDD, defined daily dose; PDD, average prescribed daily dose.
a No FDCs were included for the analysis. ATC and DDD were extracted from the WHO-ATC/DDD Index 2019 (Available from: https://www.whocc.no/atc_ddd_index/).
b Repaglinide, regular insulin and NPH insulin, each of which, was prescribed to a single patient.
4.4. Glycemic Response in the Study Population
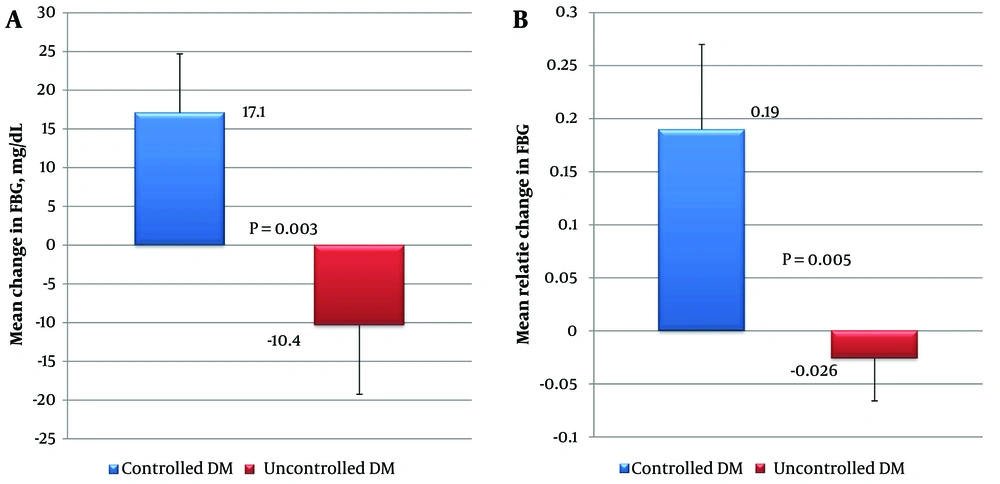
Glycemic response in the controlled and uncontrolled diabetes mellitus (DM) patients (N = 98), focusing on two measures: A, the mean change in fasting blood glucose (FBG); B, the mean relative change in FBG. Controlled DM (N = 24) was defined as FBG ≤ 110 mg/dL, while uncontrolled DM (N = 74) was defined as FBG > 110 mg/dL. The Mann-Whitney test was used, with a significance level of P < 0.05. The relative change in FBG was calculated using the formula: (treatment FBG - baseline FBG) ÷ baseline FBG
4.5. Cost of Antidiabetic and Antihypertensive Agents Prescribed
| Drugs a | Usual Strength Available | Cost per Unit Strength (₹) | Average PDD | Average Cost per Day (₹) |
|---|---|---|---|---|
| Antidiabetic agents | ||||
| Metformin | 500 mg | 1.5 | 1.2 g | 4 |
| Glibenclamide | 5 mg | 1 | 10 mg | 2 |
| Glimepiride | 1 mg | 4 | 2.6 mg | 10 |
| Pioglitazone | 15 mg | 5 | 26 mg | 9 |
| Voglibose | 0.2 mg | 8 | 0.4 mg | 16 |
| Teneligliptin | 20 mg | 10.5 | 21 mg | 11 |
| Empagliflozin | 25 mg | 57 | 22 mg | 50 |
| Repaglinide | 1 mg | 2 | 2 mg | 4 |
| Regular (soluble) insulin | 40 U | 143 | 75 U | 54 |
| Neutral protamine hagedorn (NPH, isophane) insulin | 40 U | 143 | 15 U | 268 |
| Regular insulin (30%) + isophane insulin (70%) | 40 U | 143 | 35 U | 123 |
| Insulin lispro | 100 U | 704 | 41 U | 291 |
| Antihypertensive agents | ||||
| Enalapril | 5 mg | 3 | 4 mg | 2 |
| Azilsartan | 40 mg | 9 | 33 mg | 8 |
| Olmesartan | 20 mg | 11 | 20 mg | 11 |
| Amlodipine | 2.5 mg | 3 | 4 mg | 5 |
| Cilnidipine | 5 mg | 6 | 8 mg | 9 |
| Metoprolol | 25 mg | 2 | 0.04 g | 3 |
| Chlorthalidone | 12.5 mg | 6 | 13 mg | 6 |
Abbreviation: PDD, prescribed daily dose.
a No FDCs were included for the analysis.

