
1. Background
Leishmaniasis is a zoonotic disease caused by obligate intracellular protozoan parasites of the genus Leishmania (L), which pose a public health problem in many tropical and subtropical regions of the world (1, 2). This parasitic infection is present on five continents, with 350 million people at risk worldwide (3, 4). The disease has a broad clinical spectrum, and cutaneous leishmaniasis (CL) is the most prevalent form, commonly caused by Leishmania tropica and L. major (1, 4). Leishmania has extracellular promastigotes and intracellular amastigotes in the female sand fly vectors and mammalian host (human) macrophages, respectively (2, 5). Chemotherapy is essential for leishmaniasis control and treatment, with the first line of chemotherapy being the antimonial compounds meglumine antimoniate (glucantime) and sodium stibogluconate. Second-choice drugs include amphotericin B, pentamidine, and miltefosine (6-8). These therapeutic drugs have adverse effects, including toxicity to the liver, kidneys, and spleen of patients, high cost, lengthy treatment, and drug resistance (6, 7). Hence, new drug discovery is essential (7, 9, 10), and the use of natural products can be valuable in the treatment of leishmaniasis (6, 11). Laser trilobum (L.) Borkh. (Apiaceae family) is a perennial, herbaceous, aromatic plant known as Kefe cumin, horse caraway, or three-lobed sermountain, and it grows in Iran, Southeast Asia, the Balkan Peninsula, and Central and Eastern Europe (12). One species, namely L. trilobum (L.) Borkh, has been reported in Iran. Its fruits are used as a spice and condiment.
The chemical compositions of the essential oils obtained from L. trilobum have been published, revealing ten monoterpene hydrocarbons, nine sesquiterpenes, and three diterpenes (12-15). The main compounds of the fruit of the plant include limonene, perillaldehyde, α-pinene, cis-limonene oxide, diethyl phthalate, carvone, and myrcene (12, 15). Laser trilobum exhibits antimicrobial activity against gram-positive and gram-negative bacteria and Candida albicans (12, 15), and demonstrates immunobiological (16), antioxidant, and antihaemolytic properties (17). The amastigote forms can be a very useful tool for studying the leishmanicidal activity of medicinal compounds in vitro research because this form is located in human macrophages and can cause pathogenesis and a broad spectrum of clinical manifestations. On the other hand, there is no investigation into the effects of L. trilobum extracts on Leishmania amastigote and promastigote forms. Therefore, the present study was designed and performed to find a new drug with more effectiveness and fewer or absent adverse effects, which can be an excellent approach for treating and controlling leishmaniasis.
2. Objectives
This experimental study was performed to evaluate the effect of L. trilobum hydroalcoholic extracts against promastigotes and intracellular amastigotes of L. major (MRHO/IR/75/ER) and its cytotoxic activities on macrophages RAW264.7 in vitro conditions, with the hope of finding a less expensive and common drug for this neglected disease.
3. Methods
3.1. Cultivation of Parasite and Macrophages
An Iranian strain of L. major (MRHO/IR/75/ER) was provided by the Tehran University of Medical Sciences (Tehran, Iran) and cultured in NNN and RPMI-1640 medium as previously described (8). The RAW264 macrophage cell line was obtained from the Iranian Biological Resource Center (IBRC; Iran). The RAW264 macrophages are widely used due to their phagocytosis and pinocytosis activity, ease of maintenance, and phenotypic stability (8, 18). The RAW 264.7 was cultured according to a previous report (8), and the passage range used was up to 12 passages during the experiments.
3.2. Plant Materials and Extraction
Laser trilobum (L.) Borkh was identified and collected from the Namin road to Fandoghloo forest in Ardebil province, northwestern Iran. The plant was deposited in the herbarium of Ferdowsi University of Mashhad (Mashhad, Iran) under the voucher number 35702. Laser trilobum fruits were washed, shade-dried, and ground into powder. The ground material (100 g) was dissolved in 100 mL of aqueous ethanol (70%) solvent, and maceration was performed three times, each time for 24 h in the dark with constant agitation at room temperature. The extracts were sterilized by filtration using a 0.22 μm syringe filter (Sartorius, Germany). Finally, the extracts were concentrated under a vacuum at 40°C using a rotary evaporator apparatus (Heidolph, Germany), and the residue was stored at -20°C until required for testing (8).
3.3. Cytotoxic Effects of Extract on Macrophage Cells
The cytotoxicity effects of L. trilobum against RAW264.7 macrophage cells were assessed by cultivating macrophages (5 × 10⁵) with 100 μL of various concentrations of hydroalcoholic extract (0 to 3000 μg/mL) in 96-well tissue culture plates. These plates were incubated at 37˚C in 5% CO2 for 24, 48, and 72 h, and each part was done in triplicate. Culture medium RAW264.7 cells without the plant extract and complete medium with no macrophages and drugs/extracts were respectively considered as untreated (negative) control and blank. The effects of L. trilobum extract on RAW264.7 macrophages were determined using the colorimetric MTT assay. The cytotoxicity was calculated as the inhibitory concentration (IC50) that inhibited 50% of cell growth using GraphPad Prism Version 8.0 software.
3.4. Effect of Extract on Promastigotes
Initially, 100 μL of RPMI-1640 medium containing logarithmic growth phase promastigotes (1 × 10⁵ parasites/mL) were added into 96-well plates. Afterward, 100 μL of different concentrations of L. trilobum extracts (final concentrations of extract were obtained at 37 - 5000 µg/mL) were put into each well and incubated at 25 ± 1°C for 24, 48, and 72 h. The Parasite Viability Index was determined by trypan blue solution (1:1, trypan blue/sample volume), and the percentage of viable promastigotes (unstained) compared to untreated cultures (control cultures) was measured using a Neubauer hemocytometer under a light microscope in triplicate. Promastigotes cultured in a complete medium with no extract were used as control. The inhibition rate (%) was calculated in triplicate as reported previously (8).
3.5. Effect of Extract on Infectivity Rate and the Number of Amastigotes in Macrophages
Assessment of the infection rate and parasite load in macrophages was determined with a brief modification according to previously described methods (8). Plate culture was incubated at 37°C in 5% CO2 for 4 - 5 h, then the medium, together with non-adherent RAW264.7 cells, was removed. Leishmania major promastigotes in the stationary phase (at a ratio of 10 parasites per 1 macrophage) were added to the wells and then incubated at 37°C in 5% CO2 for 24 h. The medium was aspirated, and free promastigotes were removed by washing with RPMI 1640 medium. The infected macrophages were treated with various concentrations of L. trilobum hydroalcoholic extracts (500, 750, 1000, 1250, 1500 μg/mL) under the same conditions for 24, 48, and 72 h. The macrophages containing the parasite without extract and those with glucantime (Meglumine antimoniate; Sanofi Aventis, France) were considered as a control group and drug (reference) control, respectively, for comparison of parasite inhibition. Finally, slides were fixed in absolute methanol, stained with Giemsa dye, and the percentage of infected macrophages (% infection rate of macrophages), as well as the mean number of amastigotes in at least 100 macrophages (% amastigotes viability), were studied under light microscopy compared to those obtained with the control group and reference drug (8).
3.6. Statistical Analysis
All experiments were carried out in triplicate, and the findings were determined as mean ± standard error of the mean (SEM). The GraphPad Prism 8 statistical software was used to determine the IC50 values for the plant extracts. The data and statistical analysis were determined using the Wilcoxon signed ranks test and Student's t-test. The mean infection rate of macrophages and the number of amastigotes in macrophages between test and control groups were compared by the Wilcoxon signed ranks test. A P-value < 0.05 was considered remarkably significant.
4. Results
4.1. Cell Cytotoxicity Activity
The cytotoxicity of L. trilobum hydroalcoholic extracts on uninfected RAW264.7 macrophages was determined by colorimetric MTT assay at 24, 48, and 72 h post-incubation and compared with the control groups. The IC50 for cytotoxicity of the plant extracts on uninfected RAW264.7 macrophages was 1727 μg/mL at 24 and 48 h, and R2 values for the same time were 0.9654 and 0.9843, respectively (Figure 1).
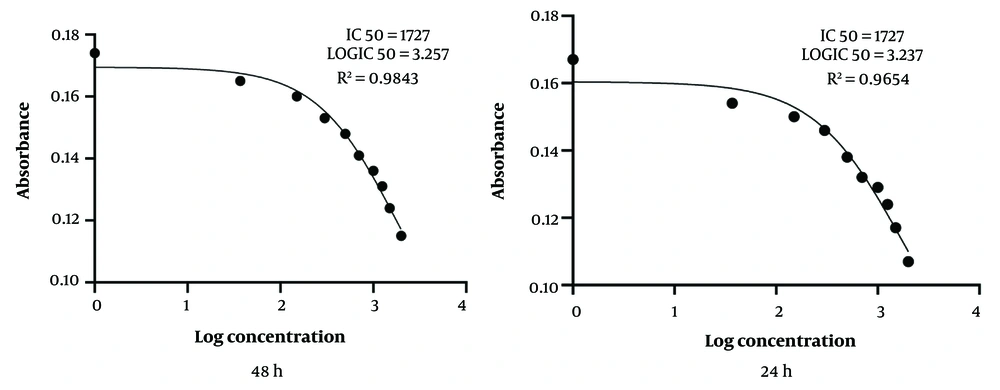
Figure 1.
Inhibitory concentration (IC50) for cytotoxicity of Laser trilobum hydro-ethanolic extracts (increasing concentrations: 500 - 3000 μg/mL) on the macrophage cell line (RAW264.7) after 24 and 48 h by using MTT assay and GraphPad Prism Version 8.0 software. All data reported as a mean of three repeated experiments.
4.2. Antileishmanial Effects of Laser trilobum Extracts on Promastigotes
As shown in Figure 2, the fatality rate of L. trilobum hydro-ethanolic extracts on L. major promastigotes displayed a dose-dependent manner (P < 0.05), such that the inhibition rate led to the death of promastigotes of L. major from 15 ± 7.4% for 37 μg/mL up to 79 ± 7.8% for 5000 μg/mL. The inhibition rate of the herbal extract was not time-dependent.
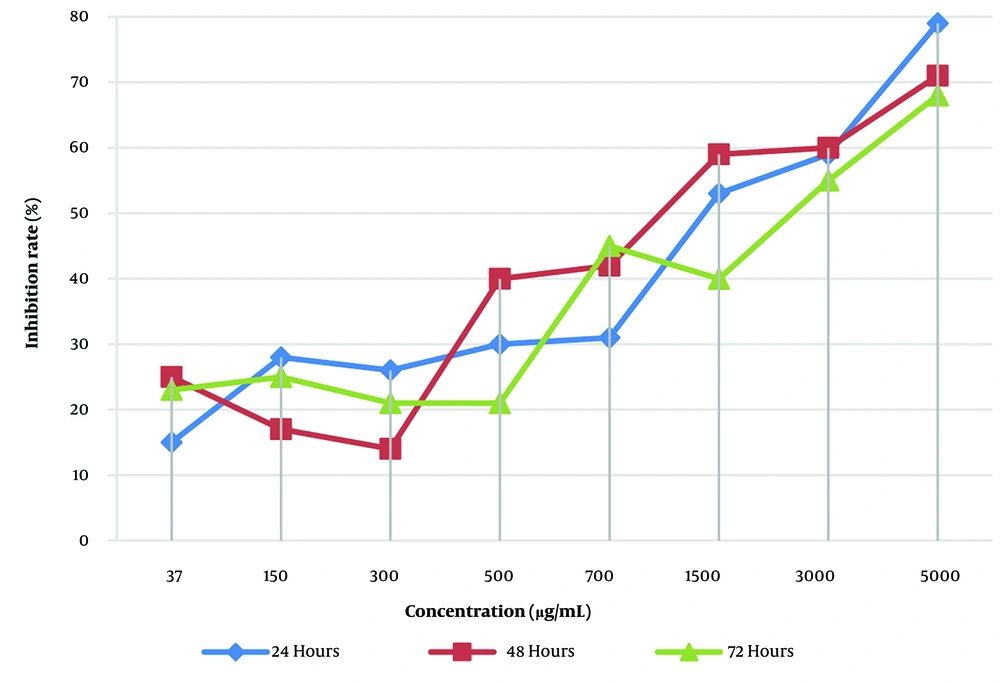
Figure 2.
Inhibition rates of promastigotes treated with different concentrations (37 - 5000 μg/mL) of Laser trilobum extract at 24, 48, and 72 h incubation; data represent experiments done in triplicate.
4.3. Antileishmanial Effects of the Herbal Extract on Infected Macrophages and Intracellular Amastigote Numbers
The effect of different concentrations (500 - 1500 µg/mL) of L. trilobum hydroalcoholic extract on infected macrophage cells and intracellular amastigote numbers was dose-dependent over 24 - 72 h (Table 1). Hence, the percentage of infectivity in the infected RAW264.7 cells decreased from 66.67 ± 1.53% for 500 μg/mL to 19.67 ± 1.53% for 1500 μg/mL of L. trilobum at 48 h.
Table 1.
Leishmanicidal Effects of Different Concentrations of Laser trilobum Hydroalcoholic Extracts on Infected Macrophages with Leishmania major and the Number of Amastigotes in Macrophages at 24, 48 and 72 h After Incubation a
| Conc. (μg/mL); Time (h) | Percentage of Infected Macrophages | No. of Amastigotes per 100 Macrophages | ||||||
|---|---|---|---|---|---|---|---|---|
| Treated | Control | P-Value | Reduction | Treated | Control | P-Value | Reduction | |
| 500 | ||||||||
| 24 | 56.33 ± 1.00 | 58.00 ± 1.00 | 0.95 | 2.88 | 23.33 ± 2.08 | 25.33 ± 1.53 | 0.257 | 7.9 |
| 48 | 66.67 ± 1.53 | 69.67 ± 2.08 | 1.00 | 4.31 | 25.67 ± 1.53 | 28.33 ± 1.15 | 0.22 | 9.39 |
| 72 | 71.00 ± 2.00 | 75.33 ± 1.53 | 1.00 | 5.75 | 30.67 ± 1.53 | 32.67 ± 1.53 | 0.32 | 6.12 |
| 750 | ||||||||
| 24 | 52.33 ± 0.58 | 58.0 ± 1.0 | 0.086 | 9.78 | 21.00 ± 2.00 | 25.33 ± 1.53 | 0.17 | 17.09 |
| 48 | 62.33 ± 1.53 | 69.67 ± 1.53 | 0.095 | 10.53 | 23.33 ± 1.53 | 28.33 ± 1.15 | 0.096 | 17.65 |
| 72 | 66.0 ± 2.00 | 75.33 ± 1.53 | 0.079 | 12.38 | 28.33 ± 1.53 | 32.67 ± 1.53 | 0.10 | 13.28 |
| 1000 | ||||||||
| 24 | 40.67 ± 1.53 | 58.0 ± 1.0 | 0.023 | 29.88 | 11.0 ± 1.0 | 25.33 ± 1.53 | 0.044 | 56.57 |
| 48 | 45.33 ± 1.53 | 69.67 ± 1.53 | 0.03 | 34.94 | 9.67 ± 1.15 | 28.33 ± 1.15 | 0.01 | 68.87 |
| 72 | 54.00 ± 2.65 | 75.33 ± 1.53 | 0.05 | 28.32 | 13.33 ± 0.58 | 32.67 ± 1.53 | 0.04 | 59.20 |
| 1250 | ||||||||
| 24 | 31.67 ± 1.53 | 58.0 ± 1.0 | 0.001 | 45.40 | 8.33 ± 1.53 | 25.33 ± 1.53 | 0.001 | 67.11 |
| 48 | 34.33 ± 1.53 | 69.67 ± 1.53 | 0.001 | 50.72 | 6.00 ± 1.00 | 28.33 ± 1.15 | 0.001 | 78.82 |
| 72 | 43.33 ± 1.53 | 75.33 ± 1.53 | 0.001 | 42.48 | 8.00 ± 1.00 | 32.67 ± 1.53 | 0.001 | 75.51 |
| 1500 | ||||||||
| 24 | 23.33 ± 1.53 | 58.0 ± 1.0 | 0.000 | 59.78 | 4.67 ± 1.53 | 25.33 ± 1.53 | 0.000 | 81.56 |
| 48 | 19.67 ± 1.53 | 69.67 ± 1.53 | 0.000 | 71.77 | 2.67 ± 0.58 | 28.33 ± 1.15 | 0.000 | 90.58 |
| 72 | 32.00 ± 2.65 | 75.33 ± 1.53 | 0.000 | 57.52 | 3.67 ± 0.58 | 32.67 ± 1.53 | 0.000 | 88.77 |
a Values are expressed as mean ± SEM of experimens done in triplicate.
According to Table 1, statistically significant reductions in the percentage of infected macrophages and the average number of amastigotes in macrophages were observed at concentrations of 1000, 1250, and 1500 μg/mL (P < 0.05, P = 0.001, and P = 0.000, respectively) over 24 to 72 h in comparison with infected macrophages with no treatment as control (Table 1).
4.4. Comparative Effects of Extract and Glucantime on Infected Macrophages and the Number of Intra-macrophage Amastigotes
The infection rates of treated macrophages with effective concentrations of the plant extract compared with glucantime (as a reference drug) are shown in Figure 3. A significant difference in infected macrophage rates between 5 µg/mL glucantime (standard drug) and 1500 μg/mL of the plant extract in treated macrophages was not observed at each time point, but for 10 µg/mL drug at 48 h only (P > 0.05) (Figure 3). The inhibitory effect of the herbal extract was not time-dependent; however, a concentration-dependent inhibition was observed.
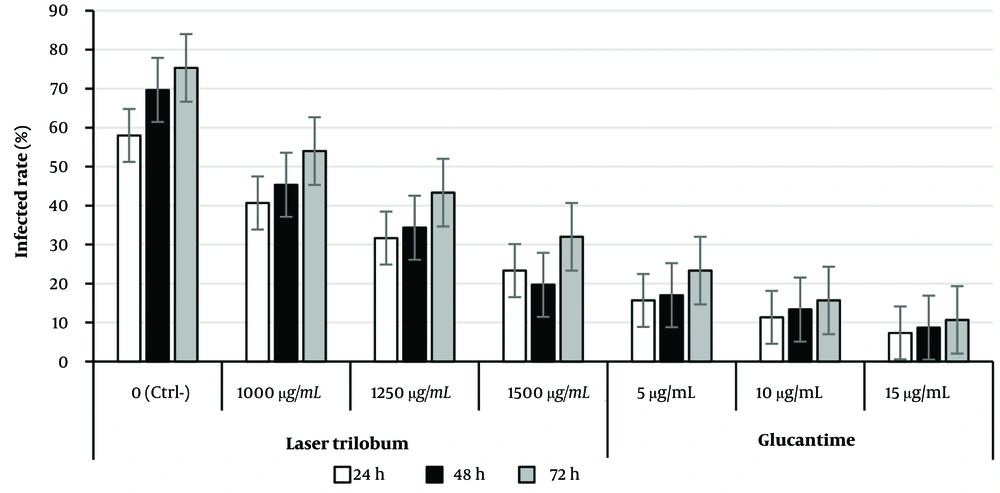
Figure 3.
Percentage of infected macrophages when treated with effective concentrations of Laser trilobum extract compared to glucantime (as reference drug) and untreated (negative control) groups at 24, 48, and 72 h after incubation; results are shown as mean ± standard error of the mean (SEM; n = 3).
The percentage of intracellular amastigote viability in treated macrophages with L. trilobum extracts compared with glucantime is presented in Figure 4. Concentrations of 1000 and 1250 μg/mL and higher of the plant extract were significantly more effective on the number of amastigote forms in treated macrophages than the 5 µg/mL glucantime (P < 0.05, P < 0.01, respectively) at the three tested times, whereas the extract values of 1250 μg/mL were not statistically significant compared to 10 μg/mL glucantime as the control drug.
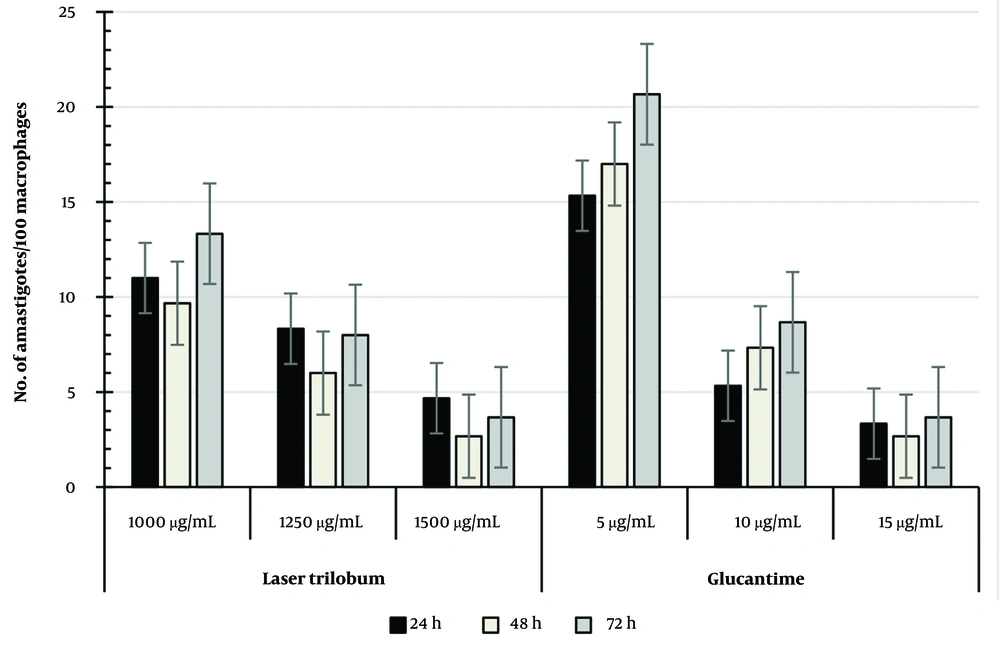
Figure 4.
Percentage of intracellular amastigote viability in treated macrophages with Laser trilobum extracts compared with glucantime at 24, 48 and 72 h after incubation. The results refer to the mean ± standard error of the mean (SEM) of experiments done in triplicate.
According to the results shown in Figure 4, the percentage of amastigote viability in treated macrophages was equal between 1500 μg/mL plant extract and 15 µg/mL glucantime at each time point, so the mean number of amastigotes/100 macrophages was 2.67 ± 1.58 for this concentration versus 2.67 ± 0.58 for 15 μg/mL glucantime, and also 6.0 ± 1 for 1250 μg/mL plant extract versus 7.33 ± 1.53 for 10 μg/mL glucantime after 48 h of incubation (Figure 4).
5. Discussion
The emergence of some restrictions reported about conventional therapy for the disease, such as excessive side effects and parasitic resistance to these drugs, justifies the search for new effective and safe antileishmanial drugs (6, 19). Therefore, the L. trilobum herbal plant can be used as a novel natural resource. In the present study, the IC50 for cytotoxicity of the plant extracts on uninfected RAW264.7 macrophages was 1727 μg/mL at 24 and 48 h, and R2 values for the same time were 0.9843 and 0.9654, respectively (Figure 1). The results showed that L. trilobum had very low cytotoxicity on RAW264.7 macrophages and can be of great significance for its traditional usefulness in potentially treating leishmaniasis. These findings are in concurrence with the Nematollahi et al. study (8). In this study, L. trilobum acted as a leishmanicidal agent against both promastigotes and intracellular amastigote forms. Different concentrations of the herbal extract caused the death of L. major promastigotes (Figure 2), and inhibitory rates demonstrated a dose-dependent response. The results presented in Figure 2 showed that by increasing the concentration of L. trilobum extracts, the proliferation of L. major promastigotes decreased remarkably (P < 0.05), and the leishmanicidal activity was in line with the findings of another study (8, 20).
In the present study, the percentage of infected RAW264.7 cells with L. major significantly declined at 1000 and 1250 μg/mL and higher concentrations of the fruit extract over 24 to 72 h compared with infected macrophages with no treatment as control. The findings reported by Najm et al. and Nematollahi et al. support our results (8, 20). In our results, the lethal activity of the plant extract against the parasite was dose-dependent, with the reduction of the percentage of infected macrophages increasing from 4.31% for 500 μg/mL to 71.77% for 1500 μg/mL (P < 0.01). These findings suggest that L. trilobum compounds such as α-pinene could prevent the growth and proliferation of L. major amastigotes and promastigotes (21). Recent studies have reported that the fruit of the herbal extracts had significant antimicrobial effects on pathogenic bacteria such as Staphylococcus aureus, Proteus vulgaris, Proteus mirabilis, Bacillus cereus, Aeromonas hydrophila, Enterococcus faecalis, Klebsiella pneumoniae, Salmonella typhimurium, Enterobacter aerogenes, and Escherichia coli (15). In this study, the anti-amastigote effects of the herbal extracts on the average number of amastigotes in macrophages significantly inhibited parasite growth at 24, 48, and 72 h after incubation for 1000 - 1500 μg/mL concentrations compared with the control group. Our results observed that the reduction in the number of amastigotes per 100 macrophages increased from 9.39 for 500 μg/mL to 90.58 for 1500 μg/mL (P = 0.000) at 48 h. The anti-amastigote effects of these herbal concentrations were significantly effective against intra-macrophage amastigotes. This study is consistent with previous studies that demonstrate Thymus kotschyanus (8), Berberis vulgaris, and berberine (22) significantly decreased the mean number of intra-macrophage amastigotes compared with the control.
Our findings revealed that the difference in infected macrophage rates between 5 µg/mL glucantime (standard drug) and 1500 μg/mL of the plant extract in treated macrophages was not statistically significant at each time point (Figure 3), except for the 10 µg/mL drug at 48 h only (P > 0.05). Similar to our findings, Nematollahi et al. (8) reported that the difference in infected macrophage rates between the 350 μg/mL of T. kotschyanus extract and the 5 µg/mL standard drugs (glucantime) was not statistically significant (P > 0.05). Additionally, Wabwoba et al. (23) revealed that there was no significant difference in infection rates between the 100 μg/mL of Allium sativum extract and the standard drugs.
This study showed that the concentrations of 1000 and 1250 μg/mL and higher of the plant crude extract were significantly more effective on the number of amastigote forms in treated macrophages than the 5 µg/mL glucantime (P < 0.05, P < 0.01, respectively) at the three times tested. The extract values of 1250 and 1500 μg/mL were not statistically significant compared to 10 and 15 μg/mL glucantime as the control drug, respectively (Figure 4). The study of T. kotschyanus hydroalcoholic extract values at 300 and 350 µg/mL on the intracellular amastigotes by Nematollahi et al. agreed with this study (8). According to published reports, L. trilobum hydroalcoholic crude extract contains effective compounds such as alpha-pinene and β-caryophyllene (21, 24). The alpha-pinene of the plant is a biologically active compound against the viability and proliferation of both amastigote and promastigote forms of L. amazonensis in vitro (21).
The results showed that the percentage of amastigote viability in treated macrophages with 1250 and 1500 μg/mL plant extract was equal to 10 and 15 µg/mL glucantime at each time point, respectively. Hence, the mean number of amastigotes per 100 macrophages was 6.0 ± 1 and 2.67 ± 1.58 for 1250 and 1500 μg/mL crude extracts versus 7.33 ± 1.53 and 2.67 ± 0.58 for 10 and 15 μg/mL glucantime (standard drug), respectively. The leishmanicidal activity of L. trilobum fruits may be due to effective compounds such as alpha-pinene and β-caryophyllene. For example, β-caryophyllene induces apoptosis via ROS-mediated MAPKs and suppression of AKT/PI3K/mTOR/S6K1 pathways (24). Therefore, this study revealed that inhibition dose ranges of 1000 - 1500 μg/mL from L. trilobum hydroalcoholic crude extract were as effective on the tested intra-macrophage L. major as glucantime. This suggests the plant extract could be a potential choice when considering the adverse effects of glucantime. However, even if the studies are very promising, these are only in vitro, and further insights and clinical trials are required for future human application. The hydroalcoholic extraction method is a safe and effective process for crude herbal extraction; however, the major limitation of this work remains due to the lack of phytochemical characterization of the extract.
5.1. Conclusions
The percentage of infected macrophages and the number of amastigotes in macrophages significantly declined at concentrations of 1000 - 1500 μg/mL over 24 to 72 h compared to control (no treatment) and 5 µg/mL glucantime (reference drug) groups. However, the effect of 1250 and 1500 μg/mL of crude extract on the amastigote forms in treated macrophages had equal leishmanicidal effects as 10 and 15 µg/mL glucantime, respectively. Considering the absence or very low cytotoxicity on mammalian cells and remarkable leishmanicidal effects, it seems that L. trilobum can be proposed as a natural potential compound for leishmanicidal activity. Nevertheless, supplementary investigations will be necessary to achieve these findings in laboratory animal and human subjects.