


1. Background
2. Objectives
3. Methods
3.1. Materials
3.2. Devices
3.3. Production of Agarose Nanocomposite HKUST
3.4. Device Method
3.5. Procedure
4. Results
4.1. Microstructural Analysis
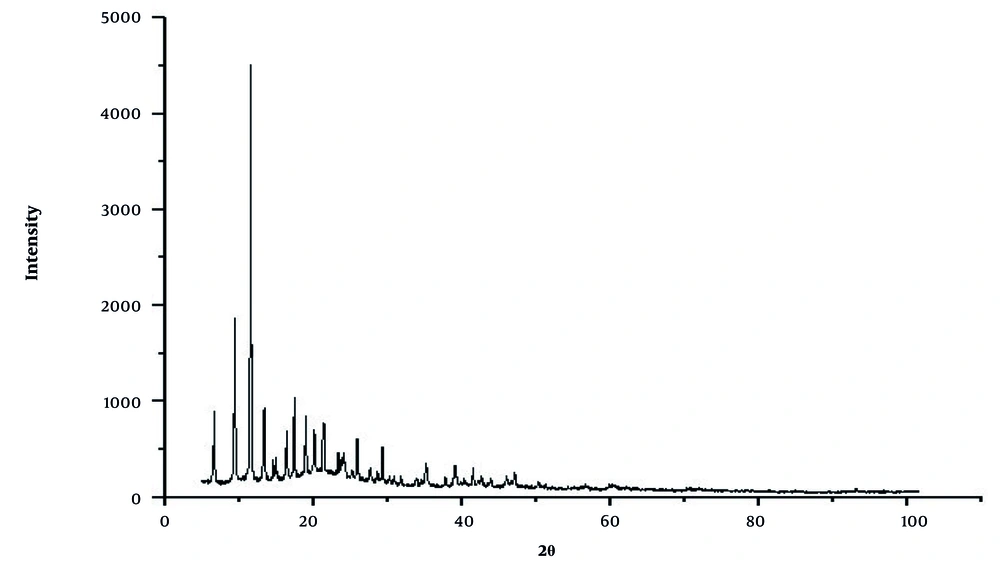
The X-ray diffraction (XRD) pattern of the composite organometallic structure
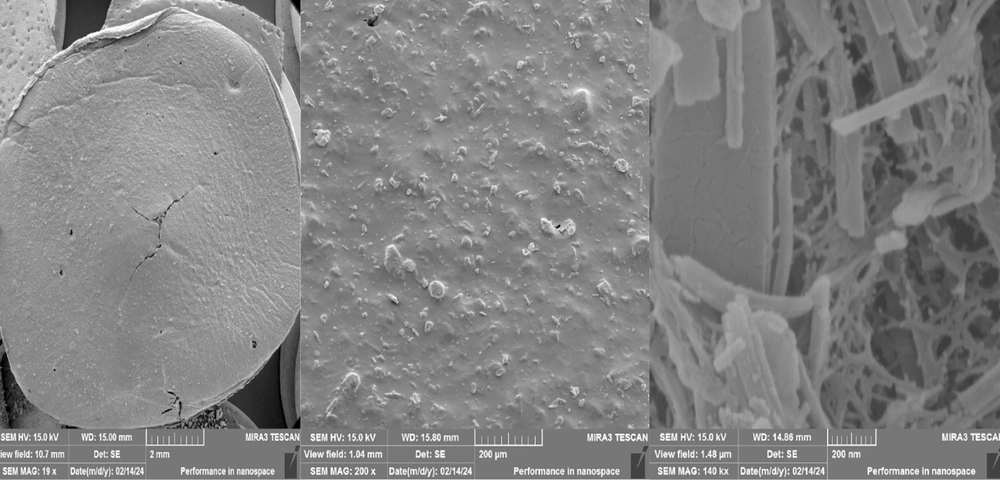
SEM image with magnification 2 mm, 200 µm and 200 nm related to HKUST@Agarose nanocomposite from left to right
4.2. Choosing the Type and Volume of the Elution Solvent
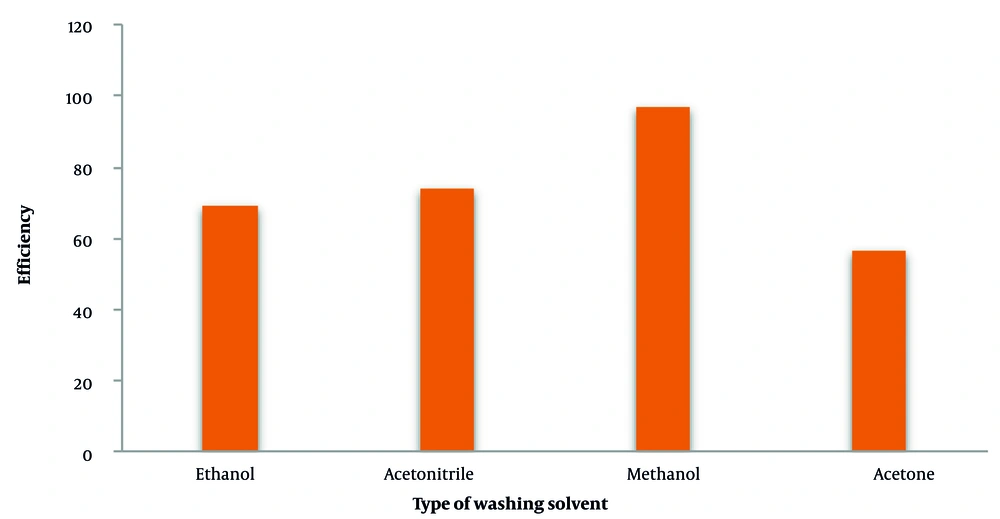
Comparison of different types of washing solvents
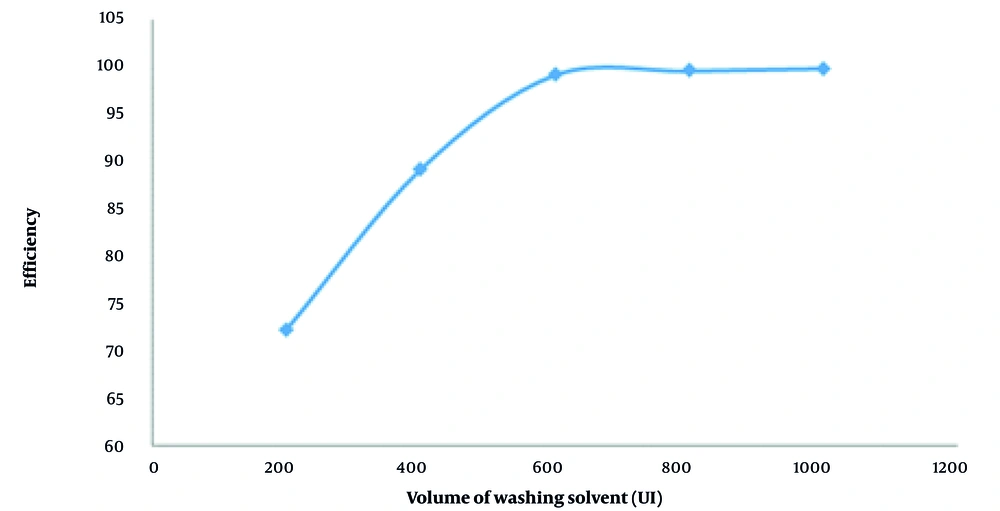
The effect of solvent volume on efficiency
4.3. Optimization of Effective Parameters for Tetracycline Extraction
| Parameters | Factors’ Levels | |
|---|---|---|
| Low | High | |
| pH | 3.5 | 6 |
| Effect of time (min) | 1 | 10 |
| Salt addition (%) | 2 | 6 |
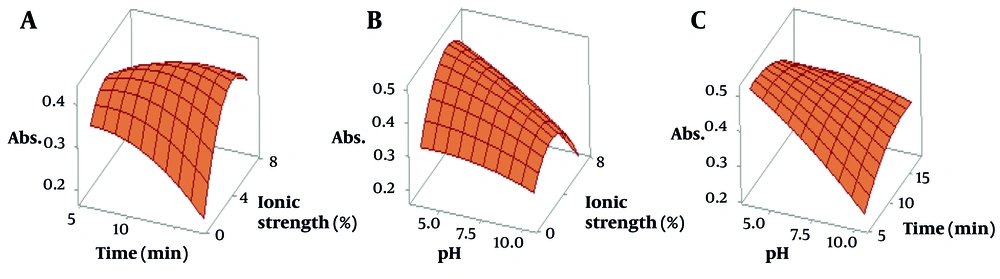
The three-dimensional representation illustrates the significance of key parameters in optimizing adsorption efficiency. Specifically, it highlights A, the interaction between duration (time) and ionic strength; B, the relationship between ionic strength and pH; and C, the effect of time and pH on attaining optimal conditions with the highest desirability. These factors collectively contribute to maximizing the adsorbent’s performance in the adsorption process.
4.4. Calibration Curve
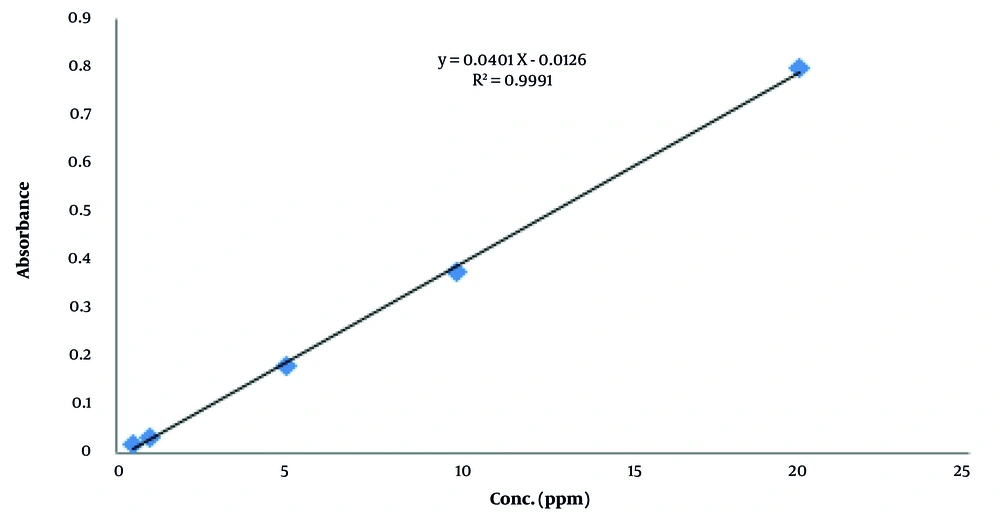
Calibration curve of tetracycline after pre-concentration by metal-organic framework nanocomposite (HKUST&Agarose). Conditions: pH = 4.0, ionic strength = 4%, adsorption time = 5.5 minutes, washing solvent = methanol and washing solvent volume = 600 μL.
Abbreviations: EF, enrichment factor.
a x is tetracycline concentration in mg/L.
b The preconcentration factor is obtained from the ratio of the volume of the initial solution before pre-concentration (10 mL) to the final volume after pre-concentration (0.6 mL).
4.5. Determination of Tetracycline in Real Samples
| Real Sample | Before Spike (ppm) | After Spike (ppm) | Efficiency (%) | RSD (%) |
|---|---|---|---|---|
| Serum sample 1 | - | 4.98 | 99.6 | 4.2 |
| Serum sample 2 | - | 4.83 | 96.6 | 3.9 |
| River (upstream) | - | 4.77 | 95.4 | 4.3 |
| River (sewage discharge) | - | 4.35 | 87.0 | 5.6 |
4.6. Challenges and Limitations in Tetracycline Separation and Quantification
4.7. Evaluation of the Proposed Method with Other Methods
| Methods | Removal Percentage (%) | Type of Sample | LOD (μg/L) | Linear Range (μg/L) | RSD (%) | Sampling Frequency (min-1) | Ref. |
|---|---|---|---|---|---|---|---|
| Spectrophotometry | 98.04 - 101.63 | Pharmaceuticals | 400 | 1000 - 40000 | 0.2 - 1.5 | 52 | (16) |
| MSPE-spectrophotometry | 91 - 97 | Milk | 10 | 30 - 600 | 1.6 -4.3 | 2 | (17) |
| SALLME-HPLC-UV | 91 - 105 | Urine | 170 | 500 - 20000 | 4.0 - 6.0 | 9 | (18) |
| SPE-HPLC-UV | 68.3 - 97.9 | Honey | 8 | 50 - 1000 | 4.1 - 7.1 | 4 | (19) |
| Spectrophotometry | 99 | Honey | 130 | 400 - 25000 | 1.0 - 5.0 | 60 | (20) |
| SPE-fluorometry | 87 | Wastewater | 9 | 30 - 1000 | 0.5 - 3.9 | 3 | (21) |
| Nanocomposite adsorbent | 99.6 | Serum | 32 | 90 - 20000 | 3.68 | 5.5 | The present study |
Abbreviations: SALLME, salting-out assisted liquid-liquid microextraction; MSPE, magnetic solid phase extraction.
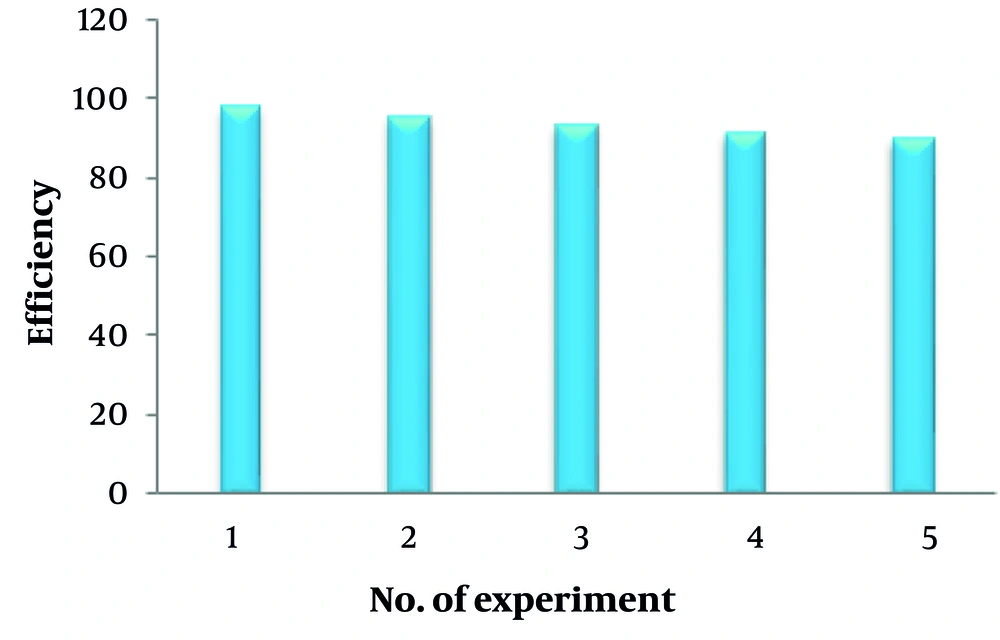
Efficiency of HKUST1@agarose nanocomposites in adsorption-desorption cycles for reuse

