
1. Background
Worldwide, herbal medicines are popular for their effectiveness in treating a wide range of diseases (1). Due to their long-term use and commercialization as natural products, traditional medicines are generally considered safe, but they may have numerous adverse effects (2, 3). Therefore, World Health Organization (WHO) considers herbal medicines a necessary matter to assess to recognize their chemicals and their potential to act as toxins (4). Despite this, most pharmaceutical studies have focused on the medicinal properties of plants instead of evaluating their toxic doses and side effects (5). To ensure the safety of herbal medicines, it is necessary to study their long-term and short-term toxic effects (6). Consequently, animal models are increasingly used to study the harmful effects of herbal medicines (7). During acute toxicity tests, animals are exposed to a single dose of a substance, and the rapid effects are measured. It is useful to determine the median lethal dose (LD50). In contrast, sub-chronic toxicity tests determine effects when an animal is repeatedly exposed to a substance. In this test, animals usually receive the substance daily for at least three months (8). One of the plants with pharmacological properties whose safety is important to assess is Achillea wilhelmsii C. Koch. This is a plant from the Asteraceae family that is used as medicine due to its antihyperlipidemic (9), antihypertensive (10), antioxidant, antimicrobial (11), anti-inflammatory (12), and anti-spasmodic (13) properties. These properties are the result of chemical compounds present in A. wilhelmsii (14). Some components of this plant can cause side effects, including minor erythema and itching from ferulic acid (15), as well as allergic reactions triggered by caffeic acid derivatives (16). Therefore, evaluating the sub-chronic effects of this plant is valuable. A comprehensive search of databases revealed that there is no sub-chronic toxicity research on A. wilhelmsii extract. Therefore, this is the first sub-chronic oral toxicity evaluation of hydroethanolic A. wilhelmsii extract in both male and female rats using Organization for Economic Co-operation and Development (OECD) protocols. Although previous acute toxicity studies were conducted using different extraction methods and routes of administration, which resulted in varying LD₅₀ values, the findings remain inconsistent. In one study, a hydroethanolic extract was administered orally to mice (17), while in another, a hydromethanolic extract was given via intraperitoneal injection in rabbits (18).
2. Objectives
Therefore, the present study was conducted to determine the acute and sub-chronic toxicity of oral consumption of A. wilhelmsii hydroethanolic extract and resolve discrepancies in previously reported LD₅₀ values.
3. Methods
3.1. Animals
Adult male and female Wistar rats were purchased from the animal house at the School of Pharmacy, Kermanshah University of Medical Sciences, Iran. The animals were controlled with a 12-hour light-dark cycle, a temperature range of 21 - 24°C, and a humidity level of 40 - 60%. Food and water were freely available to all rats. Throughout this study, rats were used following the guidelines and rules of the Ethics Committee at Kermanshah University of Medical Sciences (KUMS.REC.1395.102). In addition, this study adheres to the ARRIVE 2.0 guidelines to ensure transparent and complete reporting of animal experiments (19).
3.2. Herbal Collection and Extract Preparation
Aerial parts of the plant were collected in June of 2023 with the assistance of an expert in plant taxonomy from the Bisotun district of Kermanshah (34.3978° N, 47.4447° E). Voucher specimens of A. wilhelmsii C. Koch (2729) were prepared and deposited at the Herbarium of Razi University, at the Department of Agriculture, for reference purposes. To produce a 70% ethanol solution necessary for extraction, analytical-grade ethanol was mixed with distilled water. To obtain crude hydroethanolic extracts, 100 g of powder of dried plant aerial parts was soaked in 1000 mL of 70% ethanol for 48 hours with irregular shaking periods. To obtain a solution, the mixture was passed through two steps of filtration. Cotton wool was used in the first step, and Whatman No. 1 filter paper for the second step. This solution was concentrated to a minimal volume using a rotary evaporator operating at 40°C and a reduced pressure (70 to 100 mBar). At room temperature, concentrated crude extracts were dried in a desiccator using copper sulfate anhydrous. For further use, we stored the extract at 4°C (20). It must be noted that the yield for the hydroethanolic extract was 5.32%.
3.3. Toxicity Assessment
3.3.1. Acute Toxicity Assessment
Acute toxicity oral tests were conducted using 10 male and 10 female Wistar rats weighing 200 ± 10 g. Rats (n = 20) were randomly divided into four groups of 5 rats each using a random number table to ensure unbiased allocation. Cages were assigned randomly to prevent the environment from affecting the results. Two groups were considered controls, and two groups were designated as treatment groups. Before administration, the extract was dissolved in distilled water at various concentrations.
The rats were fasted overnight and then orally administered 2 mL of the 5000 mg/kg extract solution. Animals were monitored for signs of toxicity, including mortality, neurological symptoms (dizziness, seizures), behavioral changes, respiratory patterns, and alterations in fur/skin appearance, recorded at time intervals of 30 min, 1, 2, 4, 8, 16, and 24 hours after administration. A 14-day observation period was conducted on animals that survived for 24 hours. At the beginning of the experiment and every 3 days thereafter, animal weights were assessed (21). On the 14th day, rats were anesthetized with IP administration of pentobarbital/xylazine, and a gross necropsy was carried out. Rats were sacrificed, and the percentage weights of the major organs were calculated (22).
3.3.2. Sub-chronic Toxicity Assessment
We used the OECD guideline no. 407 for repeated oral toxicity testing of compounds to determine the sub-chronic toxicity of the A. wilhelmsii hydroethanolic extract (23). Wistar rats (n = 40) of both sexes, weighing 200 ± 10 g, were randomly divided into eight groups of 5 rats each using a random number table to ensure unbiased allocation. We randomly assigned the cages to make sure all groups were equally affected by their environment. There were four male groups (3 treatment groups and 1 control) and four female groups (3 treatment groups and 1 control). Over 60 days, animals were administered 250, 500, and 1000 mg/kg of extract orally (24, 25). Rats were monitored for toxicity signs and mortality. The weight measurement of rats was done on day 0, and then every four days thereafter. We closely observed rats for any physical skin changes, behavioral modifications, and respiratory abnormalities. Finally, all the animals were euthanized. The percentage weights of the major organs were calculated and preserved in formalin for microscopic and macroscopic investigation.
3.3.3. Hematological Analysis
The rats were anesthetized with IP administration of pentobarbital/xylazine, and a gross necropsy was carried out. With a syringe, 3 mL of blood was drawn from the heart and transferred into 3 mL heparinized sample bottles, then left for one hour. The collected blood was transferred into a separate vial for hematological analysis. These included hematocrit (HCT), red blood cells (RBCs), white blood cells (WBCs), hemoglobin (Hb), mean corpuscular volume (MCV), mean corpuscular hemoglobin (MCH), mean corpuscular hemoglobin concentration (MCHC), and platelet count (PLT) (26).
3.3.4. Biochemical Analysis
Micro-HCT capillary tubes were used to collect blood from the retro-orbital sinus of each rat and place it into non-heparinized vacutainers. Blood was centrifuged at 3000 rpm for 5 minutes to obtain serum, then analyzed with an automated chemistry analyzer (27). The measured parameters were selected based on the OECD guidelines and included glucose, urea, creatinine, cholesterol, triglyceride, total, conjugated, and non-conjugated bilirubin, and serum diagnostic enzymes aspartate aminotransferase (AST), alanine aminotransferase (ALT), creatine phosphokinase (CPK), and lactate dehydrogenase (LDH) (28).
3.3.5. Histopathological Analysis
Animals were dissected to collect lungs, kidneys, liver, heart, and spleen for histopathological analyses. Using a digital weighing scale, the weight of each organ was determined. Organs were preserved for a period of 72 hours in 10% (v/v) formalin. After fixation, tissues were cut and placed in cassettes to be processed by an automated tissue processor. Dehydration was initially achieved by placing them in tissue cassettes containing alcohol (70%, 80%, 90%, and 96%, v/v), which were then submerged in xylene solution baths to remove the alcohol. The tissues were infiltrated with molten paraffin wax. Then, the samples were allowed to air-dry. The tissues were sectioned using a rotary microtome to a thickness of 5 µm, and they were stained with hematoxylin and eosin (H&E). Preparation and examination of slides were performed using a research light microscope connected to a computerized camera. Images were obtained at a magnification of 10x, and analysis of the images was performed by an independent pathologist blinded to the biochemical and hematological data (29). In contrast to the pathologist, investigators were not blinded during treatment administration due to practical reasons in animal handling and dosing. This approach is consistent with OECD toxicity testing guidelines, which do not require blinding for routine clinical observations or standardized biochemical and hematological analyses (21, 23). Therefore, the lack of blinding among investigators did not compromise the validity of the findings.
3.4. Data Analysis
The results were reported as mean ± standard error of the mean (SEM). Statistical differences between the treatment and control groups were evaluated separately for male and female subjects using one-way analysis of variance (ANOVA), followed by Tukey’s post-hoc multiple comparison test. Statistical significance was defined as P > 0.05. All statistical analyses were performed using GraphPad Prism®, version 9.0.
4. Results
4.1. Acute Toxicity Study
All four groups, each consisting of 5 rats, were in normal condition after 14 days, and no mortality was observed with the extract consumption at 5000 mg/kg. Additionally, no significant differences in the weight of animals were observed (Figure 1A and B). The percentage weights of vital organs (heart, liver, kidney, lung, and spleen) were statistically similar in the control and treatment groups (Table 1; P > 0.05).
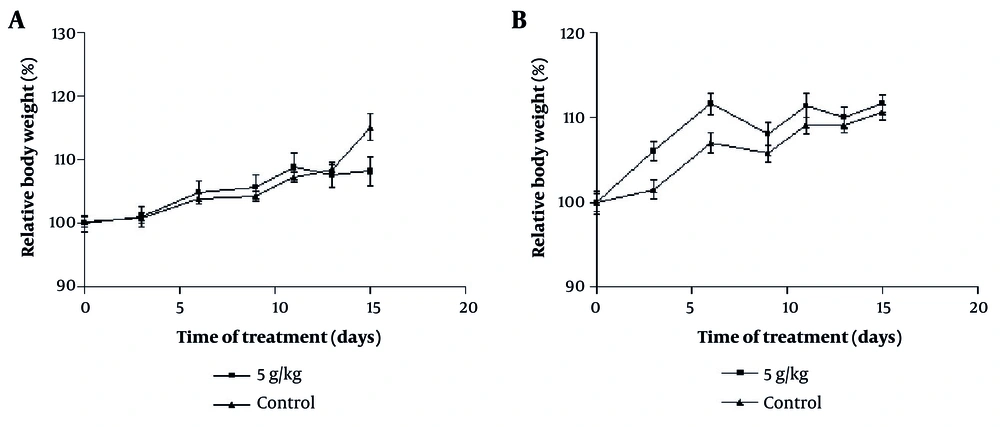
Figure 1.
The effect of oral consumption of Achillea wilhelmsii extract on changes in levels of body weights of A, male; and B, female rats during the 14-day acute phase. No clear dose-response trend was observed across 250 - 1000 mg/kg. Rats were divided into four groups: Two control groups and two treatment groups. All measures are presented as mean ± ESD for n = 5 animals per group. To examine statistical differences, one-way analysis of variance (ANOVA) and post-hoc test (Tukey) were applied.
| Sex and Groups | %Liver | %Kidney | %Heart | %Lung | %Spleen |
|---|---|---|---|---|---|
| Male | |||||
| Control | 4.02 ± 0.140 | 0.38 ± 0.022 | 0.32 ± 0.004 | 0.54 ± 0.035 | 0.31 ± 0.014 |
| Treatment | 4.37 ± 0.168 | 0.40 ± 0.019 | 0.32 ± 0.020 | 0.51 ± 0.026 | 0.33 ± 0.029 |
| Female | |||||
| Control | 3.82 ± 0.160 | 0.43 ± 0.021 | 0.38 ± 0.019 | 0.71 ± 0.032 | 0.34 ± 0.022 |
| Treatment | 3.82 ± 0.160 | 0.45 ± 0.021 | 0.36 ± 0.012 | 0.68 ± 0.054 | 0.42 ± 0.046 |
a Values are expressed as mean ± standard error of the mean (SEM).
b Treatment: 5000 mg/kg of Achillea wilhelmsii extract.
4.2. Sub-chronic Toxicity Study
After 60 days of oral administration of the extract, no death was observed in the 8 groups of 5 rats receiving the extract at different doses.
4.2.1. Effect on Body Weight and the Percentage Weights of the Major Organs
No significant differences were found in body weight between the treatment and control groups (Figure 2A and B). The weight of the heart, liver, kidney, lung, and spleen (Table 2) did not exhibit significant differences between the treatment and control groups (P > 0.05).
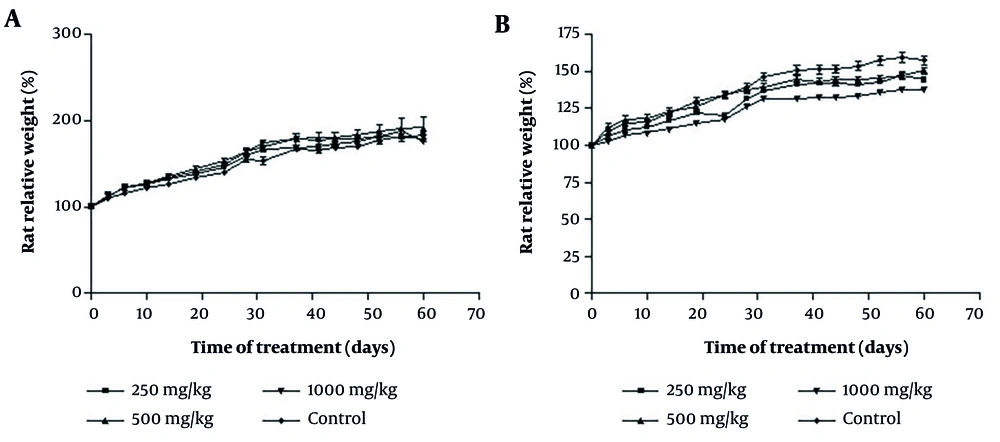
Figure 2.
The effect of oral consumption of Achillea wilhelmsii extract on changes in levels of body weights of A, male; and B, female rats during the 60-day sub-chronic phase. The data did not reveal a consistent dose-response pattern across 250 - 1000 mg/kg. Male and female rats were each divided into one control group and three treatment groups. All data are expressed as mean ± ESD for n = 5 animals per group. To examine statistical differences, one-way analysis of variance (ANOVA) and post-hoc test (Tukey) were applied (* P < 0.05).
Table 2.
Mean Percentage Weights (g) of Different Organs After 60 Days (N = 5) a
| Sex and Groups | %Liver | %Kidney | %Heart | %Lung | %Spleen |
|---|---|---|---|---|---|
| Male (mg/kg) | |||||
| Control | 2.74 ± 0.103 | 0.39 ± 0.025 | 0.31 ± 0.006 | 0.59 ± 0.017 | 0.26 ± 0.010 |
| 250 | 2.68 ± 0.071 | 0.35 ± 0.013 | 0.31 ± 0.004 | 0.66 ± 0.037 | 0.35 ± 0.030 |
| 500 | 3.056 ± 0.120 | 0.40 ± 0.014 | 0.33 ± 0.010 | 0.68 ± 0.066 | 0.31 ± 0.011 |
| 1000 | 3.056 ± 0.120 | 0.40 ± 0.014 | 0.33 ± 0.010 | 0.68 ± 0.066 | 0.31 ± 0.011 |
| Female (mg/kg) | |||||
| Control | 3.17 ± 0.237 | 0.43 ± 0.026 | 0.39 ± 0.022 | 0.71 ± 0.041 | 0.33 ± 0.025 |
| 250 | 3.16 ± 0.173 | 0.44 ± 0.033 | 0.34 ± 0.012 | 0.84 ± 0.072 | 0.35 ± 0.024 |
| 500 | 3.168 ± 0.086 | 0.40 ± 0.006 | 0.32 ± 0.018 | 0.70 ± 0.034 | 0.31 ± 0.010 |
| 1000 | 3.360 ± 0.077 | 0.45 ± 0.010 | 0.34 ± 0.11 | 0.71 ± 0.019 | 0.39 ± 0.022 |
a Values are expressed as mean ± standard error of the mean (SEM).
4.2.2. Changes in Hematological and Biochemical Parameters
In the male group treated with 250 mg/kg of extract, a significant increase in the level of WBC was observed. In other groups, no changes in hematological parameters were observed (Table 3). Regarding the biochemical parameters (Table 4), the levels of LDH and CPK decreased in the male rats that received 1000 mg/kg of the extract (P < 0.01). The dose of 250 mg/kg in male and female groups decreased the levels of total bilirubin (P < 0.05). Administration of the extract did not result in significant changes in the levels of other parameters.
Table 3.
Mean Levels of Hematological Parameters After 60 Days of Oral Consumption of the Achillea wilhelmsii Extract (N = 5) a
| Hematological Parameters | Male (mg/kg) | Female (mg/kg) | ||||||
|---|---|---|---|---|---|---|---|---|
| Control | 250 | 500 | 1000 | Control | 250 | 500 | 1000 | |
| WBC (1000/µL) | 9.175 ± 0.458 | 13.95 ± 1.060 b | 7.267 ± 1.091 | 10.400 ± 0.600 | 9.080 ± 0.836 | 8.540 ± 0.770 | 8.900 ± 0.212 | 11.550 ± 1.191 |
| RBC (106/µL) | 9.248 ± 0.222 | 9.475 ± 0.176 | 9.040 ± 0.286 | 9.104 ± 0.242 | 8.370 ± 0.264 | 8.994 ± 0.143 | 8.995 ± 0.218 | 7.960 ± 0.936 |
| Hb (g/dL) | 16.975 ± 0.278 | 16.625 ± 0.137 | 16.933 ± 0.835 | 16.940 ± 0.369 | 15.980 ± 0.439 | 16.320 ± 0.177 | 17.100 ± 0.178 | 14.820 ± 1.297 |
| HCT (%) | 49.425 ± 0.712 | 48.125 ± 0.569 | 48.567 ± 1.974 | 48.820 ± 1.037 | 46.940 ± 1.507 | 48.560 ± 0.365 | 49.225 ± 0.534 | 43.000 ± 4.863 |
| MCV (FL) | 53.550 ± 0.873 | 50.875 ± 0.631 | 53.767 ± 0.466 | 53.740 ± 0.452 | 56.200 ± 1.358 | 54.100 ± 0.809 | 55.075 ± 0.53 | 54.250 ± 0.943 |
| MCH (pg) | 18.325 ± 0.379 | 17.525 ± 0.337 | 18.633 ± 0.333 | 18.580 ± 0.131 | 19.080 ± 0.440 | 18.120 ± 0.288 | 19.075 ± 0.3816 | 18.500 ± 0.147 |
| MCHC (g/dL) | 34.300 ± 0.285 | 34.475 ± 0.259 | 34.800 ± 0.300 | 34.640 ± 0.220 | 34.020 ± 0.222 | 33.540 ± 0.296 | 34.700 ± 0.195 | 34.175 ± 0.440 |
| MPV (FL) | 6.975 ± 0.170 | 7.200 ± 0.267 | 6.900 ± 0.208 | 7.080 ± 0.086 | 6.880 ± 0.115 | 6.660 ± 0.074 | 6.375 ± 0.062 | 7.125 ± 0.368 |
| PCT (%) | 0.564 ± 0.016 | 0.516 ± 0.015 | 0.565 ± 0.027 | 0.512 ± 0.011 | 0.505 ± 0.043 | 0.546 ± 0.026 | 0.598 ± 0.025 | 0.432 ± 0.086 |
| PDW | 16.200 ± 0.070 | 16.275 ± 0.337 | 16.100 ± 0.000 | 16.200 ± 0.070 | 16.100 ± 0.044 | 16.120 ± 0.066 | 15.825 ± 0.047 | 16.400 ± 0.044 |
| Platelets (1000/µL) | 812.00 ± 33.329 | 720.25 ± 25.184 | 823.00 ± 54.308 | 725.40 ± 23.634 | 735.60 ± 58.891 | 882.60 ± 72.193 | 939.00 ± 40.336 | 615.50 ± 142.51 |
Abbreviations: WBC, white blood cell; RBC, red blood cell; Hb, hemoglobin; HCT, hematocrit; MCV, mean corpuscular volume; MCH, mean corpuscular hemoglobin; MCHC, mean corpuscular hemoglobin concentration.
a Values are expressed as mean ± standard error of the mean (SEM).
b Significant at P < 0.05.
Table 4.
Mean Levels of Biochemical Parameters After 60 Days of Oral Consumption of the Achillea wilhelmsii Extract (N = 5) a
| Biochemical Parameters | Male (mg/kg) | Female (mg/kg) | ||||||
|---|---|---|---|---|---|---|---|---|
| Control | 250 | 500 | 1000 | Control | 250 | 500 | 1000 | |
| Blood sugar (mg/dL) | 144.00 ± 5.508 | 133.25 ± 8.004 | 153.33 ± 10.682 | 156.40 ± 21.699 | 183.33 ± 24.258 | 156.25 ± 8.260 | 146.50 ± 14.575 | 177.67 ± 30.996 |
| Urea (mg/dL) | 50.275 ± 0.884 | 52.225 ± 5.015 | 48.600 ± 2.548 | 52.820 ± 2.576 | 42.633 ± 3.036 | 49.100 ± 2.138 | 54.575 ± 2.994 | 47.575 ± 2.741 |
| Creatinine (mg/dl) | 0.942 ± 0.0149 | 0.875 ± 0.0217 | 0.863 ± 0.028 | 0.904 ± 0.025 | 0.953 ± 0.020 | 0.930 ± 0.013 | 1.018 ± 0.011 | 0.925 ± 0.018 |
| Cholesterol (mg/dL) | 78.250 ± 4.498 | 84.500 ± 3.227 | 98.000 ± 6.351 | 87.800 ± 4.128 | 108.67 ± 6.227 | 103.00 ± 6.069 | 88.750 ± 5.879 | 99.500 ± 3.663 |
| Triglycerides (mg/dL) | 90.250 ± 4.956 | 107.00 ± 4.528 | 84.667 ± 3.333 | 73.800 ± 2.853 | 94.333 ± 3.480 | 104.50 ± 12.319 | 96.250 ± 13.628 | 87.500 ± 7.751 |
| CPK (g/dL) | 1121.5 ± 83.839 | 1013.0 ± 156.00 | 949.00 ± 218.86 | 461.00 ± 24.603 b | 419.67 ± 66.198 | 529.50 ± 92.895 | 550.67 ± 133.60 | 401.25 ± 84.863 |
| AST (IU/L) | 243.00 ± 10.747 | 281.75 ± 37.922 | 201.33 ± 8.950 | 171.20 ± 4.398 | 147.67 ± 18.442 | 146.50 ± 12.783 | 164.50 ± 19.427 | 159.50 ± 24.619 |
| ALT (IU/L) | 91.750 ± 5.105 | 106.25 ± 5.588 | 92.333 ± 13.920 | 94.400 ± 9.811 | 46.000 ± 3.055 | 51.250 ± 4.250 | 50.000 ± 5.553 | 66.250 ± 14.097 |
| LDH (U/L) | 3810.0 ± 877.91 | 3538.3 ± 357.06 | 2156.7 ± 606.98 | 1256.2 ± 180.62 b | 902.67 ± 162.68 | 1833.5 ± 254.91 | 1602.3 ± 249.85 | 919.25 ± 148.90 |
| T.BIL (mg/dL) | 0.507 ± 0.002 | 0.475 c ± 0.007 | 0.493 ± 0.003 | 0.494 ± 0.007 | 0.500 ± 0.000 | 0.492 ± 0.004 | 0.500 ± 0.004 | 0.507 ± 0.008 |
| D.BIL (mg/dL) | 0.065 ± 0.011 | 0.047 ± 0.004 | 0.043 ± 0.003 | 0.042 ± 0.002 | 0.046 ± 0.003 | 0.042 ± 0.002 | 0.055 ± 0.015 | 0.162 ± 0.122 |
Abbreviations: CPK, creatine phosphokinase; AST, aspartate aminotransferase; ALT, alanine aminotransferase; LDH, lactate dehydrogenase.
a Values are expressed as mean ± standard error of the mean (SEM).
b Significant at P < 0.01.
c Significant at P < 0.05.
4.2.3. Changes in the Histopathological Parameters
Pneumonia was observed in the lungs of male rats treated with 250 and 500 mg/kg of the extract. Renal hyperemia was noted in male rats across all dose groups (250, 500, and 1000 mg/kg). Hepatocyte degeneration was evident in males treated with 250 and 500 mg/kg. In female rats administered 250 mg/kg, hyperemia and mild myocardial degeneration were observed in the heart. We observed no changes in the spleen of control and treatment groups (Figure 3A and B).
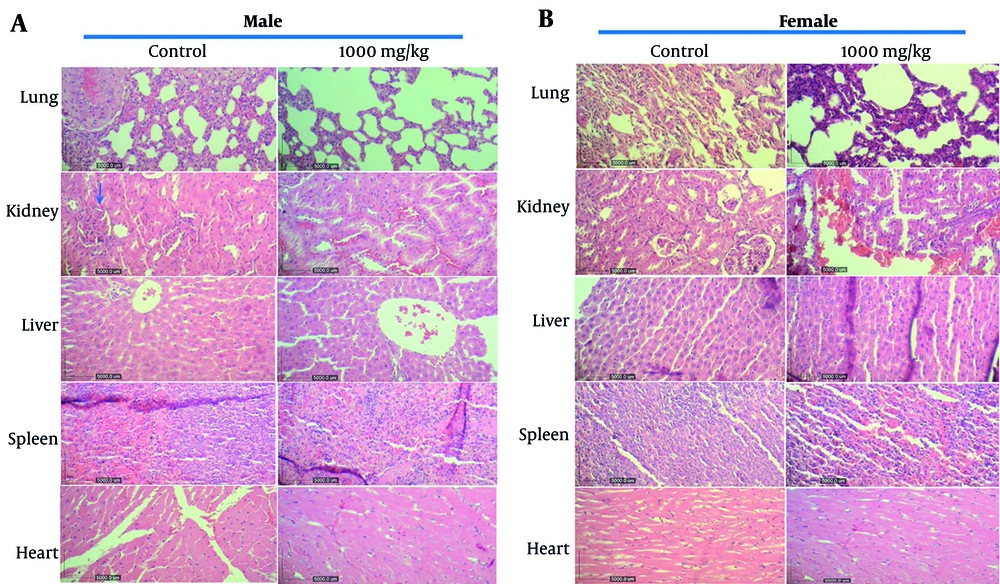
Figure 3.
The effect of oral consumption of Achillea wilhelmsii extract on histological changes in tissues of the main organs of A, male; and B, female rats. Increasing the dose from 250 to 1000 mg/kg did not produce a clear dose-response trend. The presented sections are representative of lung, kidney, liver, heart, and spleen histopathology observed through hematoxylin and eosin (H&E) staining, with observations made at 10x magnification. The blue arrow in the kidney of the control male rat indicates normal tissue (unchanged glomeruli, tubules, vessels, and interstitium).
5. Discussion
The present study was designed to investigate the acute and sub-chronic toxic effects of A. wilhelmsii hydroethanolic extract according to standard protocols. The results obtained from a single administration showed that the LD50 of the extract was greater than 5000 mg/kg. According to Loomis and Hayes’ classification, this extract is included in the non-toxic substances (30). Prior acute toxicity tests of the A. wilhelmsii extract showed different LD50 levels. In the study by Jafari et al., the LD50 of the orally administered extract was reported to be below 5000 mg/kg in the acute phase, but above 5000 mg/kg in the 14-day sub-acute phase (17). While Ali et al. reported an LD50 of 2707 ± 12.6 mg/kg for the intraperitoneal injection of the extract (18). The variation in the LD50 level reported in the previous studies can be due to differences in the animals, route of administration, and the plant’s extraction method (31). In contrast to previous studies, our experiments used Wistar rats, which are the preferred model per the OECD guideline (32).
Because losing more than 10% of body weight from the first day of the study is a principal indicator used to assess toxicity (33), we evaluated this indicator. There was no significant variation in body and organ weight between the control and treatment groups, and rats from all groups experienced an increase in body weight. Although not statistically significant, the results suggest that A. wilhelmsii may contain components potentially involved in weight gain control. Given that A. wilhelmsii is used to treat chronic conditions such as colitis (34) and cancer (35), monitoring changes after repeated administration of the extract provides valuable insight into its potential long-term toxicity. Therefore, in the next set of the study, hematological, serum biochemical, and histopathological parameters in the vital organs of Wistar rats were evaluated.
Among the hematological parameters, a mild increase in the level of WBCs (250 mg/kg, males; Table 3) was observed, which may reflect the immunomodulatory activity of A. wilhelmsii (36). Biochemical analysis demonstrated a significant reduction in total bilirubin levels in both male and female rats administered 250 mg/kg of the extract. As bilirubin serves as a key indicator of hepatic function (37), this decrease may suggest potential hepatoprotective or anti-inflammatory activity of A. wilhelmsii extract. Other biochemical factors were serum AST and ALT, whose levels showed no significant differences between treatment and control groups, suggesting the extract did not induce hepatotoxicity. While ALT is relatively liver-specific, AST is a nonspecific enzyme found in multiple tissues (including heart, skeletal muscle, and kidneys), meaning elevated levels could indicate damage to various organs (38). The stability of both enzymes supports the absence of significant liver injury. Biochemical analysis also showed that the extract failed to harm the kidneys. This was clear because creatinine and urea levels — two important kidney indicators — stayed normal in all groups (39).
The significant drop in LDH and CPK levels after administration of 1000 mg/kg extract may indicate a reduction in tissue injury, potentially indicative of a protective effect (40). However, it is important to note that LDH/CPK reduction may be due to systemic toxicity or metabolic suppression (41). Therefore, while our findings suggest reduced muscle or cellular damage, confirmation through histological or functional validation remains necessary.
Histopathological examinations in the sub-chronic phase revealed alterations, including pneumonia in lung tissue, renal hyperemia, and hepatocyte degeneration. These alterations are considered non-dose-dependent, as they do not exhibit a clear trend with increasing extract doses. Moreover, they are not reflected in the hematological and biochemical parameters, which showed no statistically significant differences. These findings suggest that the extract may exert subtle, non-linear pathological effects that are not dose-dependent. In toxicological studies, it has been reported that healthy Wistar rats can sometimes naturally develop minor lesions in their lungs, kidneys, and livers, even when they are not given any treatment (41, 42). Therefore, these findings should be interpreted with caution, as they may be natural changes and not caused by the treatment.
To understand whether the changes observed in the lungs, liver, and kidneys in this study are relevant to the extract or a natural consequence, future studies should measure oxidative stress and inflammatory markers. Moreover, due to the clinical importance of such lesions, a more detailed semi-quantitative or histopathological scoring system is needed in future studies to assess severity and distribution more precisely.
The no observed adverse effect level (NOAEL) identified (> 1000 mg/kg) in this study provides a preliminary reference for risk assessment in humans. According to the Food and Drug Administration (FDA) guidance, the human equivalent dose (HED) can be estimated by dividing the rat dose (mg/kg) by a standard conversion factor of 6.2 (43). Therefore, the NOAEL of 1000 mg/kg in rats would approximate 161 mg/kg in humans. However, further chronic toxicity and clinical safety studies are required before definitive human risk assessments can be made.
Our results align with findings from other Achillea species. Achillea millefolium aqueous extract in rodents has been reported to have no significant toxic effects at doses up to 1200 mg/kg/day over sub-chronic exposure periods. Acute studies show LD50 values > 2000 mg/kg and no mortality at high oral doses (10 g/kg) in some reports (44). Similarly, Achillea ligustica displayed no lethal effects up to 1500 mg/kg in acute testing (LD50 > 2,000 mg/kg) (45). These results support a wide safety margin, similar to our observations.
A limitation of this study is the small sample size (n = 5 per sex per group). While this is sufficient to detect major effects, it could have missed more subtle ones. Therefore, the results should be confirmed with a larger study.
Chronic toxicity studies (≥ 90 days) to evaluate cumulative effects of observed organ lesions, reproductive toxicity assays to assess risks to fertility and fetal development, genotoxicity testing such as Ames and micronucleus tests to rule out DNA damage mechanisms, and comprehensive phytochemical profiling (LC-MS) to correlate specific compounds with biological effects should be considered by researchers for future studies. The phytochemical composition of A. wilhelmsii can vary depending on the season, environmental conditions, and geographic location (11, 46). We collected our plant samples in June. Therefore, the levels of active chemicals and their potential toxicity might differ at other times of the year. Future studies, including multi-seasonal collections and phytochemical profiling, would provide a comprehensive safety assessment.
This study evaluated the hydroethanolic extract of A. wilhelmsii. However, in traditional medicine, the plant is often consumed like tea. The extraction method can influence the concentration and proportion of active phytochemicals (47). Consequently, it may alter the safety profile. For example, hydroethanolic extraction enriches certain flavonoids and phenolic acids (48), while aqueous preparations may contain different constituents (49). Therefore, comparative studies using traditional preparations would provide a more comprehensive safety assessment.
5.1. Conclusions
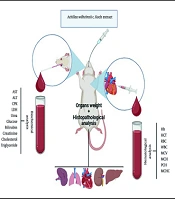
The findings of this study demonstrated that acute oral administration of A. wilhelmsii in rats has a LD50 greater than 5000 mg/kg. The repeated oral administration of this extract showed a NOAEL of 1000 mg/kg in rats (Figure 4). These results guide future safety assessments in humans. The high LD50 and NOAEL values suggest that A. wilhelmsii could be used in herbal formulations and may support setting initial doses for clinical studies. They can also help to develop dosing guidelines and safety regulations for herbal products containing this plant.
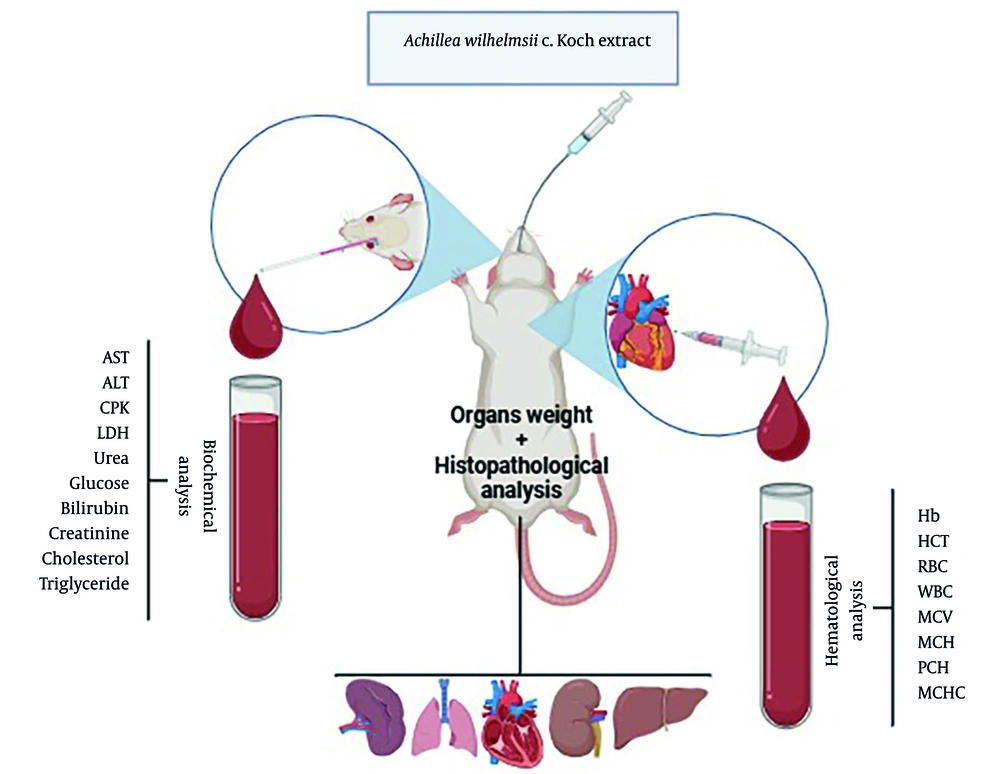
Figure 4.
Simplified schematic representation of the sub-chronic toxicity assessment applied for Achillea wilhelmsii extract (the image was created at BioRender).