


1. Background
Chronic kidney disease (CKD) is a worldwide public health complication (1). The present trajectory of risk factors suggests that chronic kidney disease will become a more prevalent cause of mortality by 2040 than it is currently (2). Renal transplantation, hemodialysis (HD), and peritoneal dialysis are standard treatment methods for patients with kidney failure (3). Approximately 90% of patients with kidney failure undergo HD, which plays a major role in increasing longevity among patients (4). To adhere to HD treatment, patients need to adapt to several problems, including fluid and diet control, painful fistulas on the day of dialysis, financial issues, and frequent hospital admissions due to accompanying illnesses; all of these conditions render patients susceptible to mental and anxiety disorders (5).
Depression and anxiety account for most of the reported psychological problems, which are independent risk factors for suicide and are strongly associated with a low quality of life among patients undergoing HD (6). More than half of the patients who underwent HD experienced anxiety, depression, and stress. Despite their high incidence rate, psychological symptoms are often unknown and not present in CKD patients (5). Mood disorders among patients undergoing dialysis endanger adherence to treatment and cause a loss of motivation and concentration, difficulty understanding information, fatigue, and sleep disorders, as well as increasing the risk of morbidity and mortality (1). Moreover, stress and anxiety cause physiological and biochemical responses (7). People with CKD can experience chronic inflammation. Cortisol hormone secretion increases under stressful conditions. Elevated cortisol levels and increased inflammation have frequently been reported in end-stage renal failure patients. Studies have revealed an association between cortisol levels and mortality (8).
The management of depression, stress, and anxiety often combines medical and nonmedical treatments. Due to the high cost and potential side effects, many prefer nonmedical methods. These include complementary therapies like massage therapy, aromatherapy, physiotherapy, relaxation techniques, and music therapy (9). The benefits of complementary therapies are their low cost, easy administration, and lack of toxic side effects (10). Reflexology is among the most commonly used complementary methods; it is regarded as a body-based manipulation therapy and is highly popular among people (9). Foot reflexology massage (FRM) is a technique that focuses specifically on the feet, applying pressure to the nerve endings located there (11). Thus, when the foot is massaged, the entire body is affected. For this reason, many massage therapists who do not have enough time to massage the entire body focus on foot massage (12). Hormones affected by massage include dopamine, serotonin, epinephrine, norepinephrine, oxytocin, and cortisol (13).
While existing evidence indicates that foot reflexology can help improve various physical and psychological symptoms, to the best of our knowledge, there are only a few studies that have specifically examined its effect on cortisol levels in patients receiving reflexology.
2. Objectives
The aim of this study was to determine the effects of foot reflexology massage on depression, anxiety, stress, and serum cortisol levels in hemodialysis patients.
3. Methods
3.1. Study Design
A clinical trial with a pretest-posttest design and a control group was conducted in 2023 at Abolfazl Hospital in Minab City, Iran, to examine the effects of foot reflexology on stress, anxiety, depression, and serum cortisol levels in patients undergoing HD.
3.2. Participants
Inclusion and exclusion criteria were established through collaboration among an internist, a psychiatrist, and the researcher. The inclusion criteria were as follows: Participants must be over 18 years old, have undergone dialysis for at least 3 months with sessions lasting 3 - 4 hours, and have no wounds. They should be free from foot neuropathy, chronic diseases, physical disabilities, and significant mental disorders affecting self-care. Additionally, participants must not have coagulation disorders that could lead to clotting or thromboembolism. Participants should have no history of drug abuse, antidepressant and sedative use, or smoking, and no history of acute crisis in the past month. They must also sign a written consent form to participate in the study.
The exclusion criteria included the use of other alternative and complementary therapies, lack of willingness to continue cooperation during the study, referral for kidney transplantation or peritoneal dialysis during the study, hemodynamic complications in most dialysis sessions, absence from more than 3 sessions, and death.
The sample size calculation formula showed that with a power of 80% and a confidence level of 95%, the significant difference between the means of the two groups was d = 4 and σ = 4.4; hence, the minimum sample size was estimated to be 26 (25.41). Due to the possibility of sample loss, for more confidence, 30 individuals were selected for each group (intervention and control) (14).
3.3. Scales
3.3.1. Depression, Anxiety and Stress
The data collection tools included demographic characteristics and an enzyme-linked immunosorbent assay (ELISA) test (IBL International GmbH kit, Germany). The Depression Anxiety Stress Scale (DASS-21) is the new brief version of DASS, with three subscales: depression, anxiety, and stress. Each subscale includes seven items, with the score for each item ranging from 0 ("does not apply to me at all") to 3 ("applies to me most of the time"). The subscale scores were calculated by summing the scores of the individual items, with the maximum sum for each subscale being 21. Higher scores represent higher psychological distress. The Persian version of this scale has been validated for healthcare professionals in Iran. The Cronbach’s alpha coefficient was acceptable for anxiety (0.79), stress (0.91), and depression (0.93). An acceptable test-retest reliability was found (0.740 - 0.881, P < 0.01). The ICCs for all dimensions ranged from 0.75 to 0.86, indicating the acceptable test-retest reliability of the scale (15).
This study was a double-blind, randomized controlled trial. The participants were unaware of their group assignments; however, the nurse was not blinded to this information due to the nature of the intervention. In contrast, the data analyst (SDT) did not know the group assignments. Additionally, the randomization codes were accessible only to a research fellow who was not involved in this study, and these codes were disclosed only after data analysis was completed.
3.4. Data Collection
The sampling method used was completely random. The patients were divided into intervention and control groups based on even and odd days. It was agreed that if the coin landed on heads, the even day would be for intervention, and if it landed on tails, the even day would be for control (Figure 1). Then, the patients who met the eligibility criteria were successively enrolled and allocated into the study groups according to the randomization schedule.
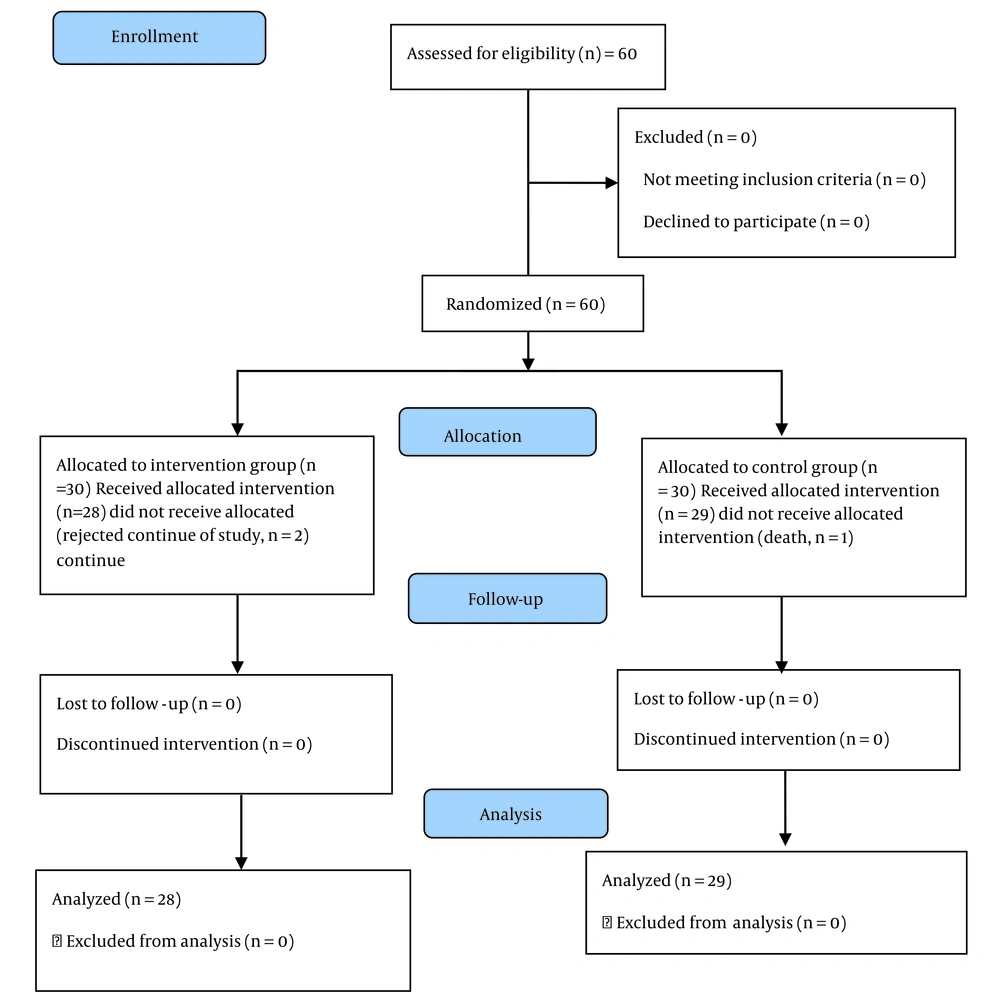
Figure 1.
The flow diagram of the study
The participants were asked to lie on the HD bed, close their eyes, and remain relaxed. The FRM was performed for 30 minutes (15 minutes for each foot), first for the left foot and then for the right foot (14), an hour after the start of dialysis. To massage the feet, first, the hands were warmed; then, the heel was held with the left hand, and the heel was bent and straightened from the ankle by pressing the sole. After that, the solar plexus point was pressed with the thumb. The action was performed 3 times per week for 4 weeks, with each session lasting 15 minutes for each foot (6 minutes of pressing, 3 minutes of resting, and again 6 minutes of pressing). A total of 12 sessions were rotated, and pressure was applied to the extent tolerable for the patient.
In the control group, by creating the same conditions applied in the intervention group, a simple foot massage was performed without pressing the standard FRM points for the same duration as in the intervention group. The blood samples collected before and after the intervention were sent to the laboratory for ELISA to measure cortisol levels.
3.5. Data Analysis
The data were analyzed using statistical tests, including paired t-tests, independent t-tests, chi-square tests, and Fisher’s exact tests, in SPSS software (version 18.0, SPSS Inc., Chicago, IL, USA).
3.6. Ethical Considerations
The Ethics Committee of Rafsanjan University of Medical Sciences, Rafsanjan, Iran, approved this study (with the code IR.RUMS.REC.1397.049). In addition, the study was registered as a clinical trial in the Iranian Registry of Clinical Trials (code: IRCT20180304038936N2).
4. Results
There was no statistically significant difference between the demographic characteristics of the patients, indicating that the studied groups were homogeneous (Table 1). As shown in Table 2, there was no significant difference between the intervention group and the control group in terms of the mean anxiety, depression, stress, and cortisol scores before the intervention (P > 0.05). However, after the intervention, the mean stress in the intervention group was significantly lower than that in the control group (P < 0.0001). There was a significant difference between the mean stress score before and after the intervention in the intervention group (P < 0.0001), but this difference was not significant in the control group (P = 0.39) (Table 2).
Table 1.Patient Demographic and Disease Information a
| Group Frequency and Demographics, and Disease Information | Intervention | Control | Total | P-Value |
|---|---|---|---|---|
| Gender | 0.23 | |||
| Men | 16 (57.14) | 12 (41.38) | 28 (49.12) | |
| Women | 12 (42.86) | 17 (58.62) | 29 (50.88) | |
| Total | 28 (100) | 29 (100) | 57 (100) | |
| Marital status | 0.50 | |||
| Single | 9 (32.14) | 7 (24.14) | 16 (28.07) | |
| Married | 19 (67.86) | 22 (75.86) | 41 (71.92) | |
| Total | 28 (100) | 29 (100) | 57 (100) | |
| Education | 0.47 | |||
| Below diploma | 23 (82.14) | 26 (89.66) | 49 (85.96) | |
| Diploma or higher | 5 (17.86) | 3 (10.34) | 8 (14.04) | |
| Total | 28 (100) | 29 (100) | 57 (100) | |
| Occupation | 0.67 | |||
| Unemployed | 6 (21.43) | 7 (24.14) | 13 (22.81) | |
| Employee | 4 (14.29) | 3 (10.34) | 7 (12.28) | |
| Housekeeper | 8 (28.57) | 12 (41.38) | 20 (35.09) | |
| Freelancer | 10 (35.71) | 7 (24.14) | 17 (29.82) | |
| Total | 28 (100) | 29 (100) | 57 (100) | |
| Economic situation | 0.33 | |||
| Good | 6 (21.43) | 4 (13.79) | 10 (17.54) | |
| Moderate | 8 (28.57) | 5 (17.24) | 13 (22.81) | |
| Weak | 14 (50) | 20 (68.97) | 34 (59.65) | |
| Total | 28 (100) | 29 (100) | 57 (100) | |
| Residence status | 0.47 | |||
| Urban | 19 (67.86) | 17 (58.62) | 36 (63.16) | |
| Rural | 9 (32.14) | 12 (41.38) | 21 (36.84) | |
| Total | 28 (100) | 29 (100) | 57 (100) | |
| Statistical indices; mean ± SD | ||||
| Age | 52.178 ± 17.786 | 54.931 ± 14.650 | - | 0.526 |
| HD history (y) | 1.892 ± 0.628 | 2.034 ± 0.498 | - | 0.34 |
Abbreviation: HD, hemodialysis.
a Values are expressed as No. (%) unless otherwise indicated.
After the intervention, the mean anxiety in the intervention group was significantly lower than that in the control group (P = 0.01). There was a significant difference between the mean anxiety score before and after the intervention in the intervention group (P < 0.0001), but this difference was not significant in the control group (P = 0.36) (Table 2).
Table 2.Intergroup and Intragroup Comparisons of the Mean Stress, Anxiety, Depression, and Cortisol Levels in Both the Intervention and Control Groups Before and After the Intervention a
| Variables and Time of Examinations | Before Intervention | After Intervention | P-Value b |
|---|---|---|---|
| Stress | |||
| The intervention group | 12.53 ± 4.11 | 12.14 ± 3.41 | 0.69 |
| The control group | 6.86 ± 4.11 | 11.86 ± 3.08 | < 0.0001 |
| Paired t-test | P < 0.0001 | P = 0.39 | - |
| Anxiety | |||
| The intervention group | 9.39 ± 2.79 | 9.07 ± 2.78 | 0.69 |
| The control group | 6.89 ± 2.73 | 95.10 ± 79.8 | 0.01 |
| Paired t-test | P < 0.0001 | P = 0.36 | - |
| Depression | |||
| The intervention group | 11.00 ± 2.65 | 11.45 ± 2.77 | 0.54 |
| The control group | 7.25 ± 2.03 | 11.14 ± 2.63 | < 0.0001 |
| Paired t-test | P < 0.0001 | P = 0.17 | - |
| Cortisol | |||
| The intervention group | 124.07 ± 19.08 | 125.48 ± 16.56 | 0.76 |
| The control group | 93.55 ± 13.88 | 127.63 ± 23.36 | < 0.0001 |
| Paired t-test | P < 0.0001 | P = 0.58 | - |
a Values are expressed as mean ± SD.
b Independent t-test.
After the intervention, the mean depression in the intervention group was significantly lower than that in the control group (P < 0.00001). There was a significant difference between the mean depression score before and after the intervention in the intervention group (P < 0.00001); however, this difference was not significant in the control group (P = 0.17) (Table 2).
The difference in cortisol concentration between the two groups was significant (P < 0.00001), with the cortisol mean in the intervention group being significantly lower than that in the control group. There was a significant difference between the mean cortisol score before and after the intervention in the intervention group (P < 0.00001), but this difference was not significant in the control group (P = 0.58) (Table 2).
5. Discussion
Feelings of powerlessness, inadequate control over illness, limited treatment options, changes in mental image, and financial problems can cause depression, anxiety, and stress in hemodialysis patients. The present study was conducted to determine the effect of FRM on depression, anxiety, stress, and serum cortisol levels among patients. The FRM was associated with lower depression, anxiety, stress, and cortisol levels in the intervention group compared to the control group.
In the literature, few studies have examined the effect of reflexology massage on depression, anxiety, stress, and serum cortisol levels among patients. Dehghanmehr et al. applied acupressure to one group and FRM to another group, 3 days a week for 4 weeks. In the measurements conducted after four weeks, a decrease in anxiety levels was observed in both groups (16). Similar results have been obtained in other research, confirming FRM's effectiveness in reducing anxiety (17). In the study by Goktuna and Arslan, the effect of FRM on sleep, anxiety, and quality of life was investigated. The FRM effectively reduced anxiety levels compared to foot massage alone in patients undergoing hemodialysis treatment (18). The study by Amini et al. in 2017 showed that FRM can reduce depression among patients (14). In a study by Lee et al., the effects of foot reflexology on anxiety and depression in cancer patients showed no significant difference between the experimental and control groups (19). These differences appear to be a result of variations in participant characteristics and the tools used to measure anxiety and depression. It is not expected that a shorter intervention will have a positive effect in this regard.
Reflexology is a safe, touch-based technique practiced in various parts of the world. It involves applying pressure to reflex points that stimulate nerve points responsible for transmitting electrochemical messages. By activating neurons through direct pressure, tension and stress are reduced, helping to maintain the body's balance. This reduction in anxiety seems to be achieved through parasympathetic activation and inhibition of the sympathetic nervous system. As a result, these effects may decrease the associated elevation of catecholamines, induce the release of endorphins, and promote hormone secretion in the body, leading to positive feelings (18). This is supported by theories like the gate control theory of pain, which helps reduce anxiety, stress, and depression (16).
In this study, the level of blood cortisol was evaluated. The intervention group showed a decrease, while the control group remained unchanged. The results of the study by Choi and Lee showed that FRM can reduce the rate of fatigue, stress, depression, and urine cortisol levels among women after delivery (20). Cortisol hormone increases in anxiety, stress, and depression. The FRM decreases cortisol levels and causes a decrease in anxiety, stress, and depression (21). Evaluation of blood cortisol levels was not a focus in most hemodialysis studies, but it could be a unique feature of this study that confirms the results of the questionnaire.
5.1. Conclusions
The positive findings of this study indicate that FRM can improve patients' mental health. This intervention is known for its affordability, simplicity of implementation, and lack of side effects, making it one of the best available methods. This study highlights the importance of integrating FRM into patient care.
5.2. Limitations
The study’s single-center design may limit the generalizability of the findings to broader hemodialysis populations, as participants were drawn from a specific geographic and clinical setting.
