


1. Background
The incidence of preterm birth is 9% - 13% of births (1). Tocolytic agents such as beta mimetics, calcium channel blockers, oxytocin receptor antagonists, and magnesium sulfate (MgSO4) are used to suppress preterm labor (2, 3). The first-line tocolytic drug in North America is MgSO4 (4, 5). But in European countries, MgSO4 is seldom used for tocolysis (6). Crowther in a systematic review in 2014 declared that MgSO4 administration did not result in a statistical reduction in birth < 48 hours (7). In addition, MgSO4 may be associated with an increase in maternal and neonatal adverse effects (8, 9). MgSO4 is recommended as a neuroprotective drug for the neonate < 32 weeks (10-12). Nifedipine as a calcium channel blocker is one of the best drugs for inhibition of preterm labor. Ease of administration, maternal tolerance, low neonatal mortality and respiratory distress syndrome, and low maternal adverse effects are the advantages of nifedipine (13). Flenady in a systematic review in 2014 claimed that calcium channel blockers reduce the risk of delivery within 48 hours without any serious neonatal morbidity and maternal adverse effects (1). Nifedipine is vasodilator and it may cause nausea, flushing, headache, dizziness, palpitations, and transient hypotension (13). An optimal nifedipine dosing regimen for treatment of preterm labor has not been yet established. The American College of Obstetricians and Gynecologists suggests a 30 mg loading dose and then 10 to 20 mg every 4 to 6 hours (14).
2. Objectives
A few studies have compared nifedipine versus MgSO4. For this reason, in this trial we compared the efficacy and safety of nifedipine and MgSO4 for inhibition of preterm labor.
3. Methods
This single-blind randomized-control trial was performed on pregnant women admitted to Arash Hospital, Tehran, Iran, during 2014 - 2016.
This study was approved by the institutional review board and the ethics committee of Tehran University of Medical Sciences, Tehran, Iran (ethics committee code: 85 - 2592 and IRCT code: IRCT2016120711020N8). An informed written consent was taken from each participant. A total of 220 patients were enrolled. They were low risk singleton pregnant women with gestational age of 32 - 34 weeks and preterm labor as inclusion criteria. Preterm labor was defined as one or more contractions every 10 minutes with cervical change, or ≥ 2 cm and < 4 cm dilation and 80% effacement.
Women with diabetes, hypertension, hypotension, cardiac arrhythmia, myasthenia, or any other medical or surgical complications, uterine malformation, poly hydramnious, vaginal bleeding, ruptured membranes, and history of previous preterm delivery were excluded. Pre-hydration with Ringer solution (500 mL) and betamethasone intramuscularly 12 mg was administrated daily for two days to all the patients. The women were randomly assigned equally to either nifedipine or MgSO4 groups. Randomization was performed through sequentially numbered opaque envelopes using a random numbers table.
Patients in the MgSO4 group received intravenous 6 g bolus MgSO4 20% (obtained from Institue Pasteur, Iran) followed by a 2 g/h infusion. Patients in the nifedipine group received oral nifedipine 10 mg (obtained from Toliddaru, Iran) every 20 minutes for three doses, followed by 10 mg orally every 6 hours (Figure 1). The treatment continued for 48 hours in both groups. All the patients were assessed for pulse rate, blood pressure every 30 minutes for the first 4 hours, and then every 4 hours until 48 hours. Moreover, the patients in MgSO4 group were examined for MgSO4 toxicity every 4 hours until 48 hours. Adverse effects were assessed in each patient and recorded. Fetal heart rate was continuously monitored. The primary outcome was inhibition of uterine contraction and prevention of delivery for 48 hours. The secondary outcome was major or minor maternal adverse effects. Serious maternal adverse effects included chest pain, pulmonary edema, and severe hypotension (< 60 mmHg). When an episode of hypotension occurred, nifedipine was withdrawn until the systolic blood pressure returned above 90 mmHg. If a serious complication occurred, the patient would be withdrawn from the study. In mothers that their active delivery process did not stop (neither by nifedipine nor by MgSO4) and the delivery occurred, the neonate outcomes would be compared between the two groups.
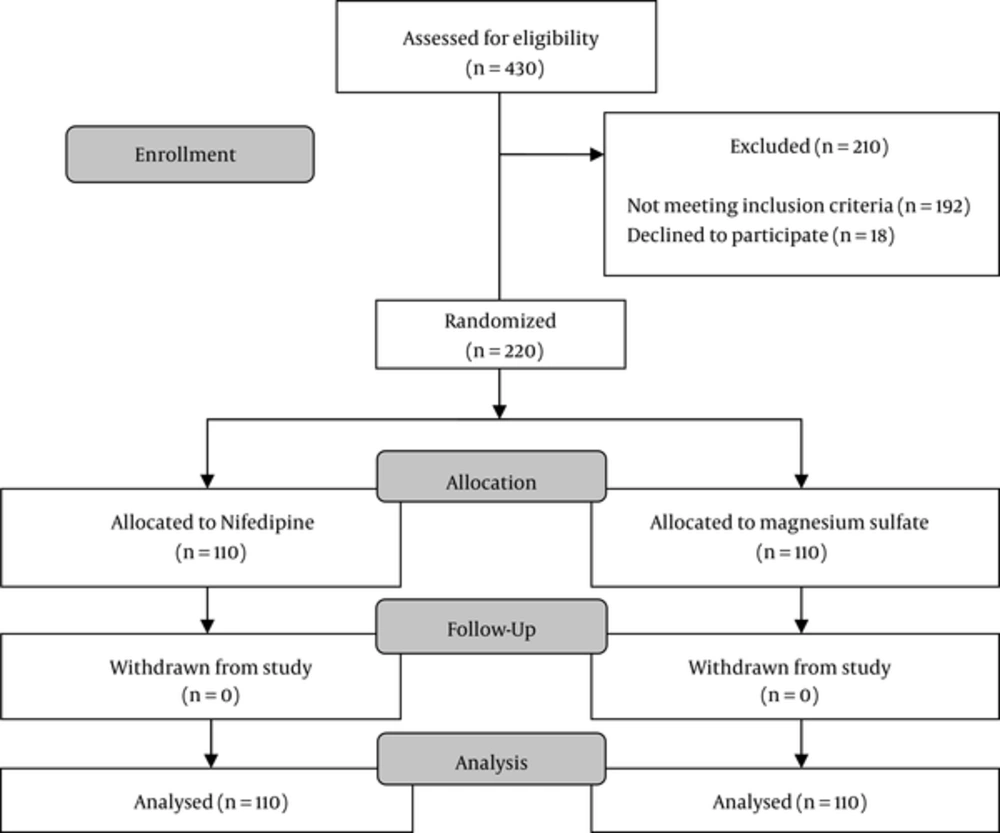
Figure 1.
Summary of Patients Flow
All data were analyzed using SPSS version 16.0 for windows (SPSS Inc., Chicago, IL, USA). Descriptive statistics for continuous variables were presented as mean ± standard deviation (SD) and for categorical variables as numbers (percentages). The baseline characteristics of the two groups were compared using independent t test for continuous variables and Chi-square test for categorical variables. All the statistical tests were two-sided and P < 0.05 was considered statistically significant. The analysis of the trial obeyed the 2010 CONSORT guidelines.
4. Results
There were no differences between the two groups with regard to the patients’ demographic and obstetric characteristics (Table 1). There were no significant differences in birth within 24 hours [80 (72.2%) in the MgSO4 group vs. 77 (70%) in the nifedipine group; P = 0.65] and 48 hours [15 (13.6%) in the MgSO4 group vs. 16 (14.5%) in the nifedipine group; P = 0.84] between the groups (Table 2).
Table 1. Baseline and Obstetric Demographics Characteristics
| MgSO4 Group (n = 110) | Nifedipine Group (n = 110) | P Value | |
|---|---|---|---|
| Age (years)a | 22.32 ± 6.51 | 22.54 ± 5.58 | 0.62 |
| BMI (kg/m2) | 24.38 ± 2.72 | 24.68 ± 2.74 | 0.27 |
| Gestational age (Weeks) | 33.21 ± 1.10 | 33.32 ± 1.41 | 0.31 |
| Pre treatment cervical dilatation (cm) | 2.12 ± 0.54 | 2.21 ± 0.46 | 0.43 |
| Parity | 2.16 ± 1.24 | 2.2 ± 1.25 | 0.62 |
| Frequency of contraction/10 min | 2.43 ± 1.12 | 2.52 ± 1.02 | 0.5 |
| Systolic blood pressure before treatment (mmHg) | 113.47 ± 1.89 | 111.68 ± 1.98 | 0.3 |
aValues given as mean ± SD.
Table 2. The Comparison of Outcomes Between the Two Groups
| MgSO4 Group (n = 110) | Nifedipine Group (n = 110) | P Value | |
|---|---|---|---|
| Inhibition of contractions in the first 24 hoursa | 80 (72.7%) | 77 (70%) | 0.65 |
| Inhibition of contractions in the second 24 hours | 15 (13.6%) | 16 (14.5%) | 0.84 |
| No inhibition | 15 (13.6%) | 17 (15.5%) | 0.7 |
| Maternal side effects | |||
| Hypotension ≤ 80 mmHg | 2 (1.8%) | 7 (6.4%) | 0.08 |
| Dyspnea | 6 (5.5%) | 0 (0%) | 0.01 |
| Minor side effectsb | 41 (37.3%) | 14 (12.7%) | < 0.001 |
| Postpartum hemorrhage | 4 (3.6%) | 1 (0.9) | 0.17 |
| Fetal outcomes | |||
| Respiratory distress syndrome | 9 (8.2%) | 5 (4.5%) | 0.26 |
| NICU admission | 11 (10%) | 7 (6.4%) | 0.32 |
| Apgar 1 minutes < 7 | 10 (9%) | 11 (10%) | 0.81 |
| Apgar 5 minutes < 7 | 8 (7.3%) | 7 (6.4%) | 0.7 |
aValues given as number (percentage).
bMinor side effects included flushing, nausea, vomiting, and headache.
In the MgSO4 group, 4 (3.6%) women suffered postpartum hemorrhage. 8 women (7.3%) experienced hypotension [n = 2, (1,8%)], or dyspnea [n = 6, (5.5%)]. Minor adverse effects were observed in 41 women (45.5%) including flushing [n = 32, (29%)], nausea or vomiting [n = 25 (22.7%)] and headache [n = 3 (2.7%)]. In the nifedipine group, 1 (0.9%) woman experienced postpartum hemorrhage. 7 (6.4%) women had hypotension, 2 (1.8%) women had nausea or vomiting, 6 of them suffered headache (5.5%), and another 6 women had palpitation (5.5%) (Table 2).
Dyspnea (P = 0.01) and minor maternal side effects were significantly higher in the MgSO4 group than the nifedipine group [41 (37.3%) in the MgSO4 group vs. 14 (12.7%) in the nifedipine group; P ≤ 0.001].
Maternal hypotension (defined as a mean arterial pressure of 80 mm Hg or less) was higher in the nifedipine groupalthough the difference was not significant (P = 0.08). Fortunately, serious maternal adverse effects and severe hypotension (< 6 mmHg) were not seen in any of the groups.
There were no statistically significant differences in one-minute and five-minute Apgar scores in neonates (Table 2).
Also, there were not any statistically significant difference in neonatal respiratory distress syndrome and NICU admission between the two groups (Table 2).
5. Discussion
In this study, both drugs were equally effective in arresting labor and delaying delivery for 48 hours. Maternal side effects were higher in the MgSO4 group. Neonatal Apgar scores were not different between the groups.
Similar to our study, Glock reported in a study that oral nifedipine is as effective as MgSO4 in arresting and preventing preterm labor (15). Lyell reported in line with our study that maternal adverse effects were significantly more frequent with MgSO4 than with nifedipine (16).
The incidence of hypotension in this study was higher in the nifedipine group than the MgSO4 group (6.4% vs. 1.8%). However, severe hypotension (BP < 60 mmHg) was not seen in the nifedipine group. Glock (15) described transient hypotension, lasting less than 10 minutes, among 41% of nifedipine recipient patients. Peripheral vasodilatation can result in the decreased vascular resistance, which is complemented by a compensatory increase in cardiac output (increase in heart rate and stroke volume). These compensatory changes preserve blood pressure in women who have no myocardial dysfunction (1). Prehydration of Ringer solutions also helped the patients in our study maintain an acceptable blood pressure. A blood pressure less than 80 mmHg in our study was considered as hypotension; thus, the incidence of hypotension in our study was higher than the incidence of hypotension in the study of Lyell et al. (16) that considered blood pressure less than 60 mmHg as hypotension.
We included women with preterm labor above 32 weeks in this study, because many studies reported that MgSO4 would be neuroprotective in preterm newborns < 32 weeks gestation (10-12). However, Lyell et al. included women in preterm labor between 24 and 34 weeks in their study (16).
Many studies reported that nifedipine is a superior drug compared to MgSO4 in decreasing the rate of respiratory distress syndrome (17, 18) and NICU admission in preterm and very preterm neonates (15). Some authors reported that MgSO4 may lead to respiratory suppression in neonates (6, 19). In the present study, we have not found any significant difference in the incidence of respiratory distress syndrome and NICU admission between the two groups. We did not also find any respiratory suppression in neonates in our study. The participants in our study comprised a sample that was not large enough in size to allow us to compare the adverse effects between the two groups of neonates.
5.1. Conclusion
Oral nifedipine is as effective as magnesium sulfate with regard to inhibition of preterm labor. However, nifedipine was associated with fewer maternal adverse effects. Future clinical research should focus on large controlled trials powered for perinatal outcomes.
