


1. Background
2. Objectives
3. Methods
3.1. Tissue and Blood Samples
3.2. Expression Evaluation
3.3. Statistical Methods
4. Results
a Chi-square test was used.
b t-test was used.
4.1. Expression Assays
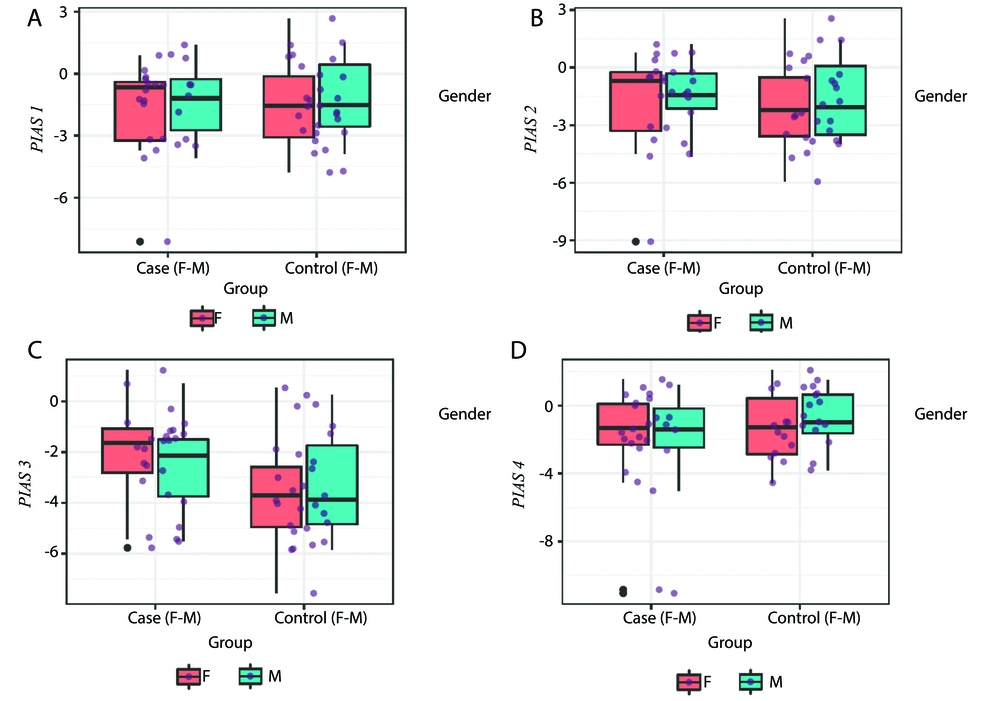
A - D, PIAS1, PIAS2, PIAS3 and PIAS4 expressions in tissues of cases compared with controls (P-values = 0.83, 0.73, 0.05 and 0.17 for PIAS1-4, respectively in total population; P-values = 0.93, 0.84, 0.10 and 0.37 for comparisons in female subgroups; and P-values = 0.97, 0.63, 0.37 and 0.34 for comparisons in male subgroups, respectively).
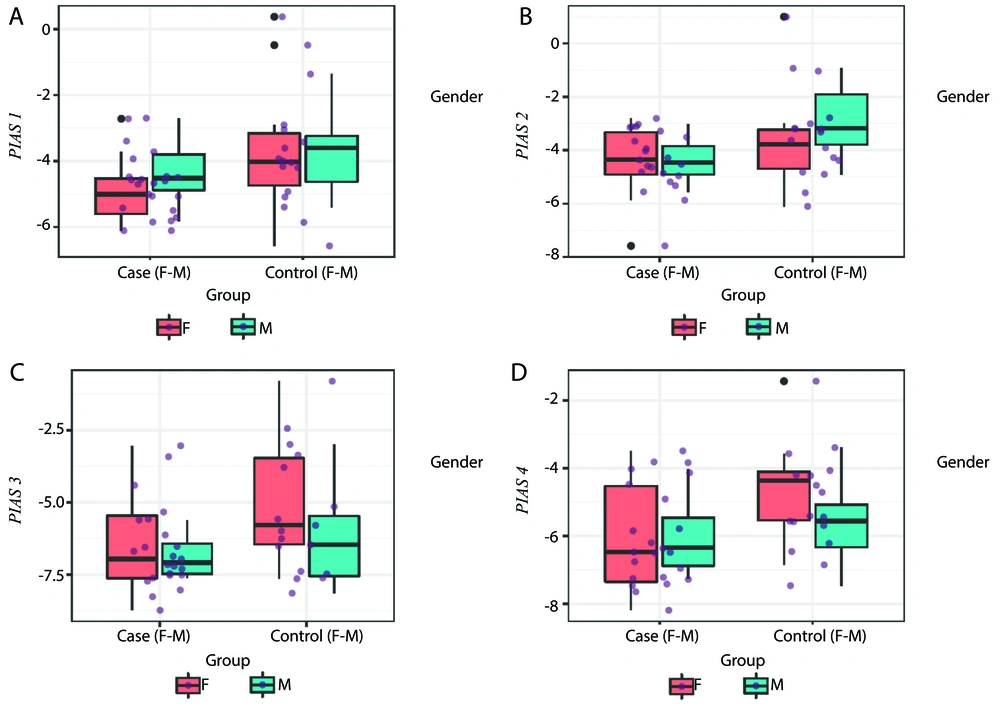
A - D, Expression of PIAS genes in blood of cases compared with controls (P-values = 0.04, 0.05, 0.08 and 0.03 for PIAS1-4, respectively in total population; P-values = 0.11, 0.35, 0.10 and 0.03 for comparisons in female subgroups; and P-values = 0.32, 0.05, 0.40 and 0.53 for comparisons in male subgroups, respectively).
| Number of Samples | PIAS1 a | PIAS2 a | PIAS3 a | PIAS4 a | ||||||||||||||||
|---|---|---|---|---|---|---|---|---|---|---|---|---|---|---|---|---|---|---|---|---|
| SE | RME | P-Value | 95% CI | SE | RME | P-Value | 95% CI | SE | RME | P-Value | 95% CI | SE | RME | P-Value | 95% CI | |||||
| Tissue (Patients samples/controls samples) | ||||||||||||||||||||
| Total (26/28) | 0.55 | 0.92 | 0.83 | -1.21 | 0.98 | 0.60 | 1.16 | 0.73 | -1.00 | 1.42 | 0.54 | 2.12 | 0.05 | -0.01 | 2.18 | 0.70 | 0.51 | 0.17 | -2.39 | 0.44 |
| Female (16/12) | 0.87 | 0.95 | 0.93 | -1.88 | 1.73 | 0.97 | 1.15 | 0.84 | -1.81 | 2.21 | 0.81 | 2.58 | 0.10 | -0.30 | 3.04 | 1.11 | 0.50 | 0.37 | -3.29 | 1.27 |
| Male (10/16) | 0.70 | 0.98 | 0.97 | -1.50 | 1.45 | 0.73 | 1.28 | 0.63 | -1.16 | 1.87 | 0.80 | 1.66 | 0.37 | -0.94 | 2.41 | 0.74 | 0.60 | 0.34 | -2.29 | 0.83 |
| Blood (Patients samples/controls samples) | ||||||||||||||||||||
| Total (23/17) | 0.49 | 0.49 | 0.04 | -2.05 | -0.03 | 0.49 | 0.50 | 0.05 | -1.99 | 0.02 | 0.60 | 0.47 | 0.08 | -2.33 | 0.13 | 0.47 | 0.49 | 0.03 | -1.98 | -0.09 |
| Female (15/10) | 0.73 | 0.42 | 0.11 | -2.85 | 0.34 | 0.70 | 0.63 | 0.35 | -2.16 | 0.82 | 0.85 | 0.36 | 0.10 | -3.26 | 0.33 | 0.62 | 0.36 | 0.03 | -2.76 | -0.18 |
| Male (8/7) | 0.63 | 0.64 | 0.32 | -2.02 | 0.73 | 0.65 | 0.37 | 0.05 | -2.90 | 0.03 | 0.72 | 0.64 | 0.40 | -2.32 | 1.03 | 0.65 | 0.75 | 0.53 | -1.84 | 1.00 |
Abbreviations: RME, ratio of mean expression; PIAS, protein inhibitor of activated STAT.
a Mann-Whitney U test was used for statistical analyses.
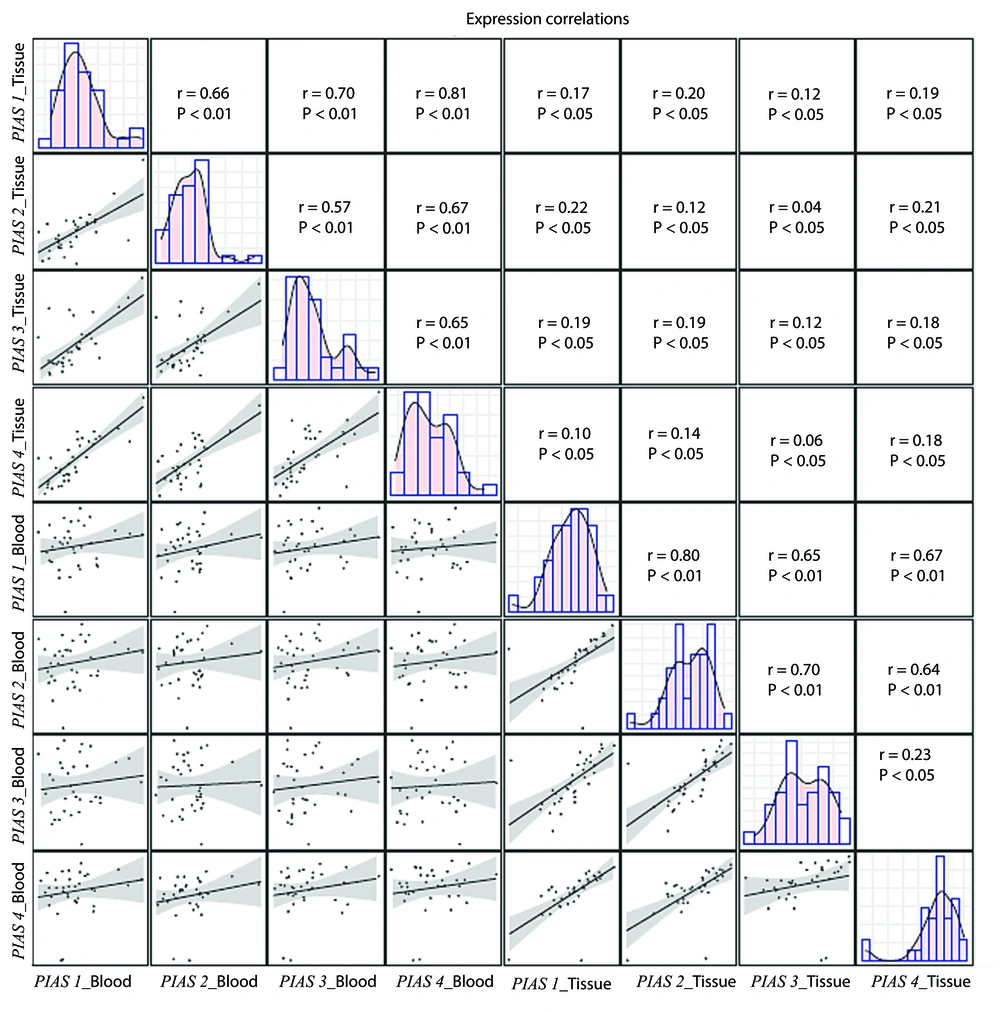
Correlation between levels of PIAS1, PIAS2, PIAS3 and PIAS4 genes in blood and gingiva. Distribution of parameters is designated on the diagonals. A bivariate scatter plot with a fitted line has been depicted in the lower part of the diagonals to show the correlations. The upper divisions of the diagonal show the r and P-values.
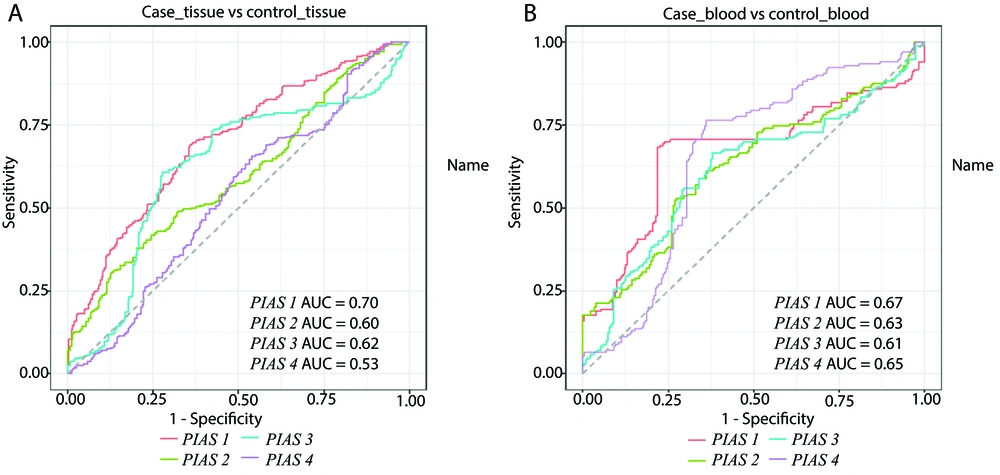
A and B, ROC curves of PIAS genes in periodontitis (P-values for PAIS1-4 in blood were 0.04, 0.05, 0.05 and 0.04, respectively. For tissue samples, P-values were 0.09, 0.1, 0.08 and 0.14, respectively).
| Variables | PIAS1 | PIAS2 | PIAS3 | PIAS4 | All | |||||||||||||||
|---|---|---|---|---|---|---|---|---|---|---|---|---|---|---|---|---|---|---|---|---|
| AUC | Sensitivity | Positive predictive value | P a | AUC | Sensitivity | Positive predictive value | P a | AUC | Sensitivity | Positive predictive value | P a | AUC | Sensitivity | Positive predictive value | P a | AUC | Sensitivity | Positive predictive value | P a | |
| Tissue | 0.70 | 0.69 | 0.64 | 0.09 | 0.60 | 0.30 | 0.68 | 0.1 | 0.62 | 0.61 | 0.67 | 0.08 | 0.53 | 0.66 | 0.53 | 0.14 | 0.70 | 0.87 | 0.63 | 0.05 |
| Blood | 0.67 | 0.68 | 0.81 | 0.04 | 0.63 | 0.53 | 0.73 | 0.05 | 0.61 | 0.66 | 0.70 | 0.05 | 0.65 | 0.76 | 0.74 | 0.04 | 0.57 | 0.58 | 0.72 | 0.05 |
Abbreviations: PIAS, protein inhibitor of activated STAT.
a Two tailed P-values are presented.

