


1. Background
Traffic accidents remain a persistent public health crisis, contributing to millions of injuries and fatalities across the globe annually. Beyond the incalculable human cost, road traffic accidents also impose a significant economic burden, with substantial resources expended on medical care, lost productivity, and broader societal impacts (1). In this context, predictive analytics emerges as a pivotal tool with the potential to help avert such outcomes.
Machine learning (ML) has been extensively applied in accident data analysis to predict road accident severity, identify contributing factors, and enhance road safety. Various studies have employed ML techniques such as Naive Bayes, random forest, logistic regression, and artificial neural networks to develop predictive models based on factors such as accident severity, number of vehicles involved, casualties, region, road type, lighting, and weather conditions (2-4). These studies have focused on tasks including data preprocessing, feature selection, and model building to accurately predict accident risk and severity. By analyzing large datasets of road accidents, ML algorithms have demonstrated promising results in classifying accidents into different severity categories and forecasting injury severity with high accuracy (2, 4). The application of ML in accident data analysis holds the potential to revolutionize road safety measures by offering insights into critical factors influencing accidents and enabling the development of effective preventive strategies based on data-driven predictions (2, 4). Another study analyzed road accidents in a metropolitan city using ML algorithms such as linear regression, polynomial regression, decision tree, support vector machine (SVM), and random forest to examine accident-prone or hotspot areas and their root causes (5). Additionally, ML can be employed to analyze the determinants of road accidents and derive valuable insights to support targeted interventions and promote organizational growth (6).
By analyzing the root causes of accidents using ML techniques, valuable insights can be gained into the factors contributing to such incidents. This information can be leveraged to develop strategies and interventions aimed at reducing the occurrence of traffic accidents.
2. Objectives
The present study aims to employ ML techniques to thoroughly examine data on risky driving behavior and its determinants, collected through self-report questionnaires, with a specific emphasis on identifying the most significant factors influencing the occurrence and severity of traffic accidents. Understanding the nuanced interplay between individual psychological traits, economic constraints, and observable behaviors presents an opportunity for policymakers to implement customized regulations and design safety programs that specifically address the underlying causes of accidents.
3. Methods
For this research, participants were selected using a convenience sampling approach. Data were collected from drivers across five distinct districts in Shiraz, with the aim of achieving a diverse representation of drivers throughout the city. To ensure the inclusion of taxi and heavy vehicle drivers, outreach was conducted at their respective terminals, and invitations to participate were extended.
All data in this study were self-reported by the participants. Trained researchers administered the questionnaires in face-to-face settings, during which respondents shared their perspectives and experiences. The survey comprised a comprehensive compilation of several instruments, each designed to capture factors associated with driving behavior and experiences. It included demographic information and driving habits, such as age, gender, marital status, education level, income relative to expenses, total daily driving duration, duration of non-stop driving, cellphone use while driving, frequency of fatigue-related driving, and substance use prior to driving.
Personality traits were evaluated using the Mini International Personality Item Pool (Mini-IPIP) Questionnaire, which has been validated in Persian (7). This 20-item instrument measures the big five personality traits: Openness, conscientiousness, extraversion, agreeableness, and emotional stability. Additionally, three items from the NEO-PI Questionnaire, previously utilized in an Iranian study (8), were used to assess sensation seeking. To evaluate normlessness, the standard four-item version developed by Kohn and Schooler (9) was employed, which has been used in several prior studies (10, 11).
Risky driving behavior was assessed using the Manchester Driving Behavior Questionnaire (DBQ), developed by Lajunen et al. (12), which consists of 27 items. This instrument explores four dimensions of risky driving behavior: Violations, aggressive violations, slips (errors), and lapses.
Participants also provided information about their vehicles, including whether their primary vehicle was foreign or Iranian-made, as well as assessments of its safety and comfort levels. Questions regarding vehicle safety and comfort were developed by the authors with input from an expert panel. The comfort questionnaire included five items evaluating features such as wheel comfort, seat comfort, air conditioning effectiveness, seatbelt comfort, and the presence of automatic transmission. In addition, participants were asked about the types of roads they typically use, including whether the roads are predominantly rural (inter-city) or urban (inner-city), and the degree of traffic congestion experienced. Road feature assessments included experiences with surface smoothness and potholes, road width or the number of lanes, adequacy of lighting, road markings and signage, the presence of risky or abrupt turns, and whether opposite lanes were separated.
Questions concerning participants’ history of psychological disorders and medical conditions that could affect driving were derived from cited studies. Participants were also asked about the use of medications with high-risk warnings. Additional inquiries addressed smoking habits, alcohol consumption, and history of recreational drug use. Furthermore, participants were questioned about their encounters with law enforcement while driving, including the frequency of such encounters and the types of enforcement typically encountered (e.g., police officers or remote monitoring through traffic cameras).
The outcome (target) variables in this study were involvement in traffic accidents within the past year. Accident severity was categorized as accidents resulting in property damage only, injuries, or fatalities.
Quantitative variables were discretized into categorical bins, and categorical variables underwent one-hot encoding, converting them into binary vectors suitable for use with ML algorithms.
During the data structuring phase, we applied the k-means clustering algorithm to group variables into coherent categories. This unsupervised technique segmented the multivariate space into clusters, ensuring high internal homogeneity—where data points within each cluster are similar—and high external heterogeneity—where clusters are distinct from one another. To evaluate the quality of clustering and determine the optimal number of clusters, we used the Silhouette Index, which ranges from -1 to 1. A higher Silhouette Index reflects better-defined clusters by capturing both strong internal cohesion and clear separation between groups.
Specifically, for each data point, the Silhouette Index calculates the difference between the average distance to all other points within the same cluster and the average distance to points in the nearest neighboring cluster. This difference is then normalized by the larger of the two average distances. After several iterations, the silhouette method indicated that a dichotomous (two-cluster) categorization was the most appropriate for our dataset. As a result, variables were classified into binary categories: ‘Low’ and ‘high’. This binary classification enhanced the interpretability of the ML models. Appendix 1 in Supplementary File provides a detailed overview of the variables after cleaning and clustering, along with their corresponding attributes.
Feature selection was crucial in our analytical process, as it identified the most relevant predictors of our target variables: Accident occurrence and severity. To achieve this, we adopted a dual approach. We first used the random forest algorithm to compute the Gini Index for each feature, summarizing the results in a bar graph. The index quantified each variable’s discriminative power, where a higher value implied greater influence. For a secondary assessment, we used SHapley Additive exPlanations (SHAP) values with an eXtreme Gradient Boosting (XGBoost) model. The SHAP values apply a game-theoretic approach to explain individual predictions, assigning each feature a value that quantifies its contribution to the model’s output. This enabled us to assess each feature’s impact on predicting accident occurrence and severity. Comparing the outputs from both methods (Gini Index and SHAP values) provided a robust understanding of feature relevance and validated the findings using two complementary interpretability techniques. Graphical representations allowed researchers and stakeholders to clearly identify key factors influencing accident probability and severity.
To further enhance the robustness and transparency of feature importance interpretation, we also evaluated the stability of selected features across multiple random seeds and sampling variations, ensuring consistency in selection regardless of sampling noise.
Extracting decision rules was an integral part of our analysis, implemented using the C5.0 algorithm (an advanced decision tree technique). The C5.0 distilled complex data into simple, interpretable rules derived from features identified during the selection phase. These rules provided insights into accident conditions and factors affecting their severity and facilitated the anticipation of accidents and the formulation of tailored safety interventions.
For predictive modeling of accident occurrence and severity, we employed a set of ML models, each with unique statistical attributes, to undertake a thorough analysis. This suite included the random forest algorithm, logistic regression, SVM, Naive Bayes, and decision trees. We divided the data into training (70%) and testing (30%) subsets to validate the models’ predictive robustness. This standard practice in ML research prevents overfitting and tests model generalizability to new data. To safeguard against bias and variance and ensure the models’ generalizability, we used K-fold cross-validation with K set to 10. This technique divided the training data into 10 subsets or 'folds', each taking turns as the validation set. After 10 iterations and the averaging of results, we obtained an accurate performance estimate, validating the reliability of our models on unseen data. This safeguarded the robustness of our investigative approach.
Hyper parameter optimization plays an essential role in ensuring the optimal performance of ML models. While deep learning models are particularly sensitive to hyper parameter tuning, traditional algorithms such as decision trees, random forests, and SVMs also benefit significantly from appropriate configuration. In this study, we employed standard and widely accepted hyper parameter values to ensure model reliability, transparency, and reproducibility.
Specifically, for the random forest algorithm, we set the number of trees (n_estimators) to 100, the maximum depth (max_depth) to none, and the minimum number of samples required to split an internal node (min_samples_split) to 2. For the SVM, we used the 'rbf' kernel, with the regularization parameter (C) set to 1.0 and gamma set to 'scale'. The decision tree classifier was configured with a maximum depth of none and the Gini Index as the splitting criterion. Logistic regression was implemented with L2 regularization, using the default solver ('lbfgs') and a maximum of 100 iterations. The Naive Bayes classifier was applied with default prior assumptions.
The analytical soundness of our predictive models was reinforced by various evaluation metrics, each capturing different aspects of performance in relation to accident prediction. Accuracy provided a general assessment of prediction correctness, while precision and recall were especially critical in contexts where prediction errors carry significant consequences—precision for minimizing false positives, and recall for identifying relevant instances. The F1 score, calculated as the harmonic mean of precision and recall, served to balance the importance of false positives and false negatives. The receiver operating characteristic (ROC) curve and the area under the curve (AUC)-ROC were used to distinguish between sensitivity and specificity, proving essential for evaluating the efficacy of the ML models in this study.
We conducted the computational analysis using the R programming language, known for its advanced capabilities in statistical computation and data visualization. R’s flexibility, combined with its extensive collection of CRAN packages, provided the necessary tools for implementing the ML algorithms used in our study. Key packages such as random forest, e1071, nnet, Naive Bayes, and C50 were essential for model development and analysis, while ggplot2 enabled advanced graphing, and caret streamlined the processes of model training and evaluation. The XGBoost package was vital for implementing gradient-boosting algorithms, and preprocessing tasks—such as normalization and imputation—were efficiently managed using dplyr and tidyr. By utilizing RStudio as our integrated development environment, we established a consistent system for scripting, debugging, and version control, which significantly enhanced the workflow and efficiency of the research process. This comprehensive suite of R-based tools supported a rigorous and transparent analytical process, underpinning the scientific integrity of our investigation into accident data.
4. Results
The study sample consisted of 617 participants, the majority of whom were male (78.3%). Most participants were aged between 25 and 59 years, representing 88.6% of the respondents. In terms of marital status, a majority (69.2%) were married. A substantial proportion of participants held a university degree (77%). Income levels varied considerably; however, the largest segment (50.6%) reported incomes closely aligned with their expenditures. In terms of vehicle type, only 1% reported using a motorcycle, while 71.6% used a light vehicle, and 27.4% used a heavy vehicle.
Based on the two target variables of this research, 433 participants (70.2%) reported not having experienced an accident in the past year, while 184 (29.8%) reported having had at least one accident during that time. Among the 184 individuals who had experienced at least one accident, 142 (77.2%) reported an accident that resulted in financial damage, and 42 (22.8%) reported an accident that led to injury or death.
The attribute importance assessment revealed several key findings essential for understanding the factors influencing the occurrence and severity of accidents. Utilizing the random forest algorithm, we prioritized variables based on their contribution to predicting the target outcomes. A bar chart visually represents the importance of each variable, as measured by their respective Gini coefficients (Figure 1A).
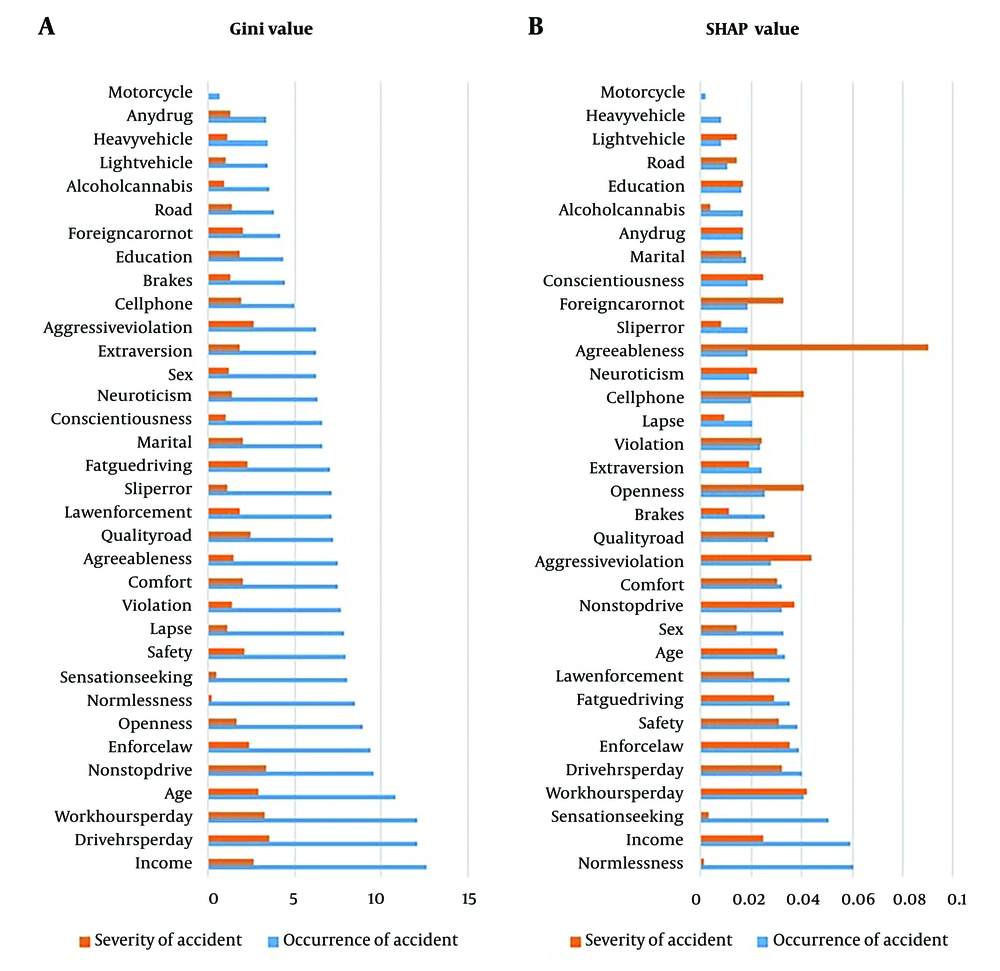
Figure 1.
The plot for importance of variables as determined by A, the random forest algorithm; and B, eXtreme Gradient Boosting (XGBoost) model
For the occurrence of accidents, the variables income, drive hours per day, work hours per day, age, non-stop drive, enforce law type, openness, normlessness, sensation seeking, and vehicle safety emerged with higher Gini importance scores. Specifically, the income-to-expenditure ratio (income) was the most significant, bearing the highest Gini Index of 12.6. In the analysis of accident severity, significant predictors included drive hours per day, non-stop drive, work hours per day, age, aggressive violation, income, quality road, enforce law type, fatigue driving, vehicle safety, foreign car or not, and vehicle comfort, with daily driving hours (drive hours per day) exhibiting the highest Gini Index of 3.6.
Complementing the Gini importance analysis, the SHAP evaluation performed through the XGBoost model reinforced the relevance of these variables from an interpretability perspective. The SHAP values showed agreement with the Gini Index results, identifying aggressive violation, work hours per day, openness, cellphone, non-stop drive, enforce law type, foreign car or not, drive hours per day, vehicle safety, age, and vehicle comfort as among the top influences for accident occurrence. For accident severity, key influencing factors identified through SHAP included enforce law type, drive hours per day, foreign car or not, aggressive violation, non-stop drive, vehicle safety, work hours per day, fatigue driving, and age. Graphical representations of the SHAP values (Figure 1B) illustrate the magnitude of these variables’ impacts on the two target variables.
Among the multitude of rules generated by the C5.0 algorithm, a subset was extracted to elucidate the underlying patterns affecting crash occurrence and severity (Table 1).
Table 1.A Subset of the Rule Extraction from C5.0 Algorithm
| Occurrence of Accident | Severity of Accident |
|---|---|
| Rule 1: If; income is less than the cost; drive hours per day is more than 2 h; normlessness = high; sensation seeking = high; openness = low; then yes [error = 29.4%] | Rule 1: If; enforce law type = police and camera; fatigue driving = high; car is not foreign; then wounded or dead [error = 11.1%] |
| Rule 2: If; drive hours per day is more than 4 h; enforce law type = police; normlessness = high; sensation seeking = high; fatigue driving = high; then yes [error = 29.2%] | Rule 2: If; drive hours per day is more than 2 h; safety = low; car is not foreign; then wounded or dead [error = 27.6%] |
| Rule 3: If; drive (hours per day is more than 4 h; normlessness = high; sensation seeking = high; vehicle safety= low; then yes [error = 40%] | Rule 3: If; enforce law type = police; car is not foreign; fatigue driving = low; then damage [error = 11.1%] |
| Rule 4: If; normlessness = low; then no [error = 6.5%] | Rule 4: If; drive hours per day is less than 2 h; safety = high; fatigue driving = low; then damage [error = 18.2 %] |
| Rule 5: If; income is more than cost; drive hours per day is less than 2 h; openness = low; then no [error = 7.7%] | Rule 5: If ; car is foreign; then damage [error = 20.9%] |
| Rule 6: If; income is more than cost; enforce law type = police and camera; then no [error = 8.3%] | - |
| Rule 7: If; income is equal to the cost; enforce law type = police and camera; vehicle safety = high; then no [error = 10.4%] | - |
| Rule 8: If; openness = high vehicle safety = high then no [error = 11.8%] | - |
For instance, one extracted rule reveals that a combination of high normlessness, an income lower than expenditures, and driving more than two hours per day significantly increases the probability of accident occurrence. Notably, when normlessness is low, the likelihood of not having an accident increases to 93.5%. According to the obtained rules, the variables income, drive hours per day, normlessness, sensation seeking, openness, enforce law type, fatigue driving, and vehicle safety played a more significant role in determining accident occurrence. In general, it can be concluded that high normlessness, income less than expenses, driving more than two hours per day, police-based enforce law type, high sensation seeking, low vehicle safety, low openness, and high fatigue driving are associated with a higher likelihood of accidents. Conversely, in the absence of accidents, the contributing factors include low normlessness, income equal to or greater than expenses, driving fewer than two hours per day, enforce law type involving both police and cameras, low sensation seeking, and high vehicle safety. On the other hand, accident severity is primarily influenced by a combination of factors such as enforce law type, fatigue driving, foreign car or not, drive hours per day, and vehicle safety. Accidents with lesser severity are more likely when the car is foreign. In contrast, use of non-foreign vehicles, high fatigue, low vehicle safety, and longer driving hours increase the risk of severe accidents. Overall, it can be concluded that for accidents resulting in property damage only, the contributing factors include having a foreign car, low fatigue, driving less than two hours per day, high vehicle safety, and enforcement primarily by police. In contrast, accidents resulting in injury or fatality are more likely when the car is not foreign, fatigue is high, vehicle safety is low, enforcement is conducted by both police and cameras, and daily driving exceeds two hours.
Based on the results of the C5.0 algorithm, the variables used in the modeling for the accident occurrence variable are income, drive hours per day, normlessness, sensation seeking, openness, enforce law type, fatigue driving, and vehicle safety. Additionally, the variables used to model the severity of accidents are enforce law type, fatigue driving, foreign car or not, drive hours per day, and vehicle safety.
The comparative performance analysis of ML models provides an understanding of their efficacy in predicting accident occurrence and severity. Our investigation assessed several algorithms, including random forest, Naive Bayes, logistic regression, SVM, and decision trees, using metrics of accuracy, precision, recall, F1 score, and AUC-ROC. These performance outcomes are presented in Table 2, based on the predictive strength of the models applied to 30% of the test data.
Table 2.Validation Indices of the Models
| Variables | Accuracy | Recall | Specificity | Sensitivity | Precision | AUC Score | F1 Score |
|---|---|---|---|---|---|---|---|
| Occurrence of accident | |||||||
| Random forest | 0.772 | 0.455 | 0.907 | 0.455 | 0.676 | 0.681 | 0.543 |
| Decision tree | 0.761 | 0.400 | 0.915 | 0.400 | 0.667 | 0.657 | 0.500 |
| Logistic regression | 0.728 | 0.382 | 0.876 | 0.382 | 0.568 | 0.629 | 0.457 |
| Naive Bayes | 0.728 | 0.636 | 0.767 | 0.636 | 0.538 | 0.702 | 0.583 |
| Severity of accident | |||||||
| Random forest | 0.796 | 0.646 | 0.905 | 0.646 | 0.896 | 0.788 | 0.754 |
| SVM | 0.778 | 0.568 | 0.944 | 0.568 | 0.912 | 0.763 | 0.709 |
| Decision tree | 0.651 | 0.532 | 0.694 | 0.532 | 0.635 | 0.620 | 0.589 |
| Logistic regression | 0.632 | 0.724 | 0.511 | 0.724 | 0.507 | 0.599 | 0.571 |
Abbreviations: AUC, area under the curve; SVM, support vector machine.
Among these, the random forest classifier emerged as the most effective, exhibiting superior predictive accuracy (77.2% for occurrence of accident) and specificity (90.7% for occurrence of accident). The robust nature of random forest—capable of handling a large number of input variables and identifying complex patterns—was evident in its performance. Naive Bayes demonstrated high sensitivity (63.6% for occurrence of accident), effectively minimizing false negatives, which is critical in accident prediction to avoid overlooking high-risk cases. Logistic regression performed commendably with respect to recall (72.4% for severity of accident), ensuring that a significant proportion of actual positives were correctly identified. The SVM and decision trees showed competitive performance; however, they were marginally outperformed by the aforementioned models. The consistency across various metrics underscores the robustness of the selected features and the reliability of our advanced analytic approach in forecasting the occurrence and severity of accidents. The analytical proficiency demonstrated by random forest suggests its preferential utility in developing predictive models within the realm of traffic accident analysis, due to its ability to offer nuanced risk assessments and evidence-based insights for accident prevention initiatives.
In the ML method, determining the direction of the variables can be somewhat complex. However, in the decision tree model, certain rules were extracted that indicate the directional influence of these features. In conclusion, based on the results of the extracted rules, the direction of some features is specified in the text below. Here, reverse means that an increase in the variable reduces the occurrence or severity of accidents, while direct means that an increase in the variable increases the occurrence or severity of accidents.
The random forest analysis and Gini Index revealed the following predictors of accident occurrence: Income (reverse), drive hours per day (direct), work hours per day (direct), age, non-stop drive (direct), enforce law type, openness (reverse), normlessness (direct), sensation seeking (direct), and vehicle safety (reverse). Additionally, the following predictors were identified for accident severity: Drive hours per day (direct), non-stop drive (direct), work hours per day (direct), age, aggressive violation (direct), income (reverse), quality road (reverse), enforce law type, fatigue driving (direct), vehicle safety (reverse), foreign car or not, and vehicle comfort (reverse).
The SHAP analysis highlighted the following predictors of accident occurrence: Aggressive violation (direct), work hours per day (direct), openness (reverse), cellphone, non-stop drive (direct), enforce law type, foreign car or not, drive hours per day (direct), vehicle safety (reverse), age, and vehicle comfort (reverse).
Moreover, the predictors of accident severity identified through SHAP analysis included: Enforce law type, drive hours per day (direct), foreign car or not, aggressive violation (direct), non-stop drive (direct), vehicle safety (reverse), work hours per day (direct), fatigue driving (direct), and age.
5. Discussion
This study has illustrated the innovative application of ML techniques in the sophisticated realm of accident data analysis, significantly enhancing our ability to model and predict the occurrence and severity of accidents. By employing algorithms such as k-means, random forest, SHAP analysis, and the C5.0 algorithm, we have deciphered the complexity of multidimensional data derived from self-reported questionnaires. The insights gained from this analysis can be considered valuable inputs for data-driven health policies and accident prevention strategies.
The high importance of the income-to-expenditure ratio (income) in predicting accident occurrence surpassed traditional variables such as age and type of vehicle driven. Previous studies have indicated that individuals in deprived areas or those from lower socioeconomic backgrounds experience more injuries from traffic accidents or are involved in more severe crashes (13-15). Conversely, some studies have reported that income does not correlate with motor vehicle fatalities (16). An observational study in the United States found that individuals from higher socioeconomic classes were more likely to violate traffic laws while driving (17). The likelihood that wealthier individuals possess higher-quality vehicles, while those with lower incomes may need to drive more frequently due to financial constraints, suggests that economic circumstances could significantly influence driving habits and, consequently, the likelihood or severity of accidents. These findings underscore the importance for policymakers to recognize the potential impact of economic factors on accident prevention strategies, highlighting the need for policies that provide economic support as a means to effectively mitigate accident risks.
Additionally, the prominent roles of normlessness and sensation seeking as significant predictors of accident occurrence stood out, challenging the conventional emphasis on external factors such as road conditions and vehicle type. Proposed as a personality construct and a facet of the extraversion trait, sensation seeking is defined as the desire for and engagement in varied, novel, complex, and arousing sensations and experiences (18). Numerous studies have investigated the relationship between sensation seeking and risky driving behavior (19-27). It is theorized that sensation seekers tend to underestimate risk in various road situations. Their perceived level of risk often remains low unless they have personally encountered negative consequences (24, 28). Alternatively, sensation seekers may be fully aware of the dangers associated with their behavior but choose to act on it regardless, driven by the thrill it provides (24). In one of the extracted rules, it was revealed that when the normlessness variable is low, the likelihood of not having an accident increases to 93.5%. According to the literature, individuals with higher levels of normlessness are more likely to commit traffic violations and engage in risky driving behaviors compared to those with lower levels of normlessness (10). Normlessness refers to a lack of respect for and adherence to social norms. In the context of driving, this implies that individuals exhibiting high levels of normlessness are more inclined to disregard traffic regulations and engage in hazardous behavior behind the wheel (29-32).
Driving hours per day, non-stop driving, and work hours per day were identified as predictors of accidents. These variables are key determinants of individual fatigue and may serve as indicators of fatigue-related driving. Additionally, factors such as time of day, age, gender, medical conditions, substance and medication use, and environmental conditions—including lighting, traffic density, terrain, and even road landscape—have been linked to drowsy or fatigued driving (33, 34). Fatigue or drowsiness has detrimental effects on a driver’s attention, decision-making ability, coordination, alertness, and reaction time, in addition to increasing the risk of falling asleep at the wheel (35, 36). Drowsy drivers may struggle to maintain proper speed and keep a safe distance from other vehicles (37). They are also more likely to unintentionally deviate from their lane or change lanes frequently (38), and are at greater risk of colliding with stationary objects (39).
Moreover, the type of law enforcement (enforce law type) emerged as a double-edged sword in the analysis: Enforcement using both police and cameras was associated with reduced accident severity, yet paradoxically appeared to increase the likelihood of accident occurrence. These counterintuitive findings may stem from recall bias due to the self-reported nature of the data. Previous studies have shown that increased police presence and enhanced monitoring systems can raise driver awareness and promote safer driving behaviors (40, 41). Effective law enforcement has been demonstrated to reduce both accident occurrence and injury severity (42). Both police patrols and traffic cameras play significant roles in achieving these outcomes (43, 44).
It was found that accidents with lesser severity are more likely when the car is foreign and vehicle safety is higher, suggesting that foreign cars equipped with advanced safety technologies offer better protection. This finding highlights the underdeveloped state of the Iranian automotive sector and warrants careful consideration (45).
The implications of these findings for policy and public health strategies are multifaceted. They advocate for a holistic approach that incorporates psychological evaluations, assessments of socioeconomic status, and nuanced law enforcement strategies in the design of effective accident prevention programs.
The reliability of our conclusions is reinforced by a meticulous statistical methodology, ensuring that the results are both valid and meaningful. To determine the optimal clustering of questionnaire components, we employed the k-means technique and validated the clustering quality using the Silhouette Index. This index revealed a clear separation into two clusters for the majority of components, supporting our categorization into 'low' and 'high' groups and affirming the consistency of our variable construction. To identify key predictive features, we utilized the random forest algorithm and calculated Gini indices, which helped pinpoint the most influential variables affecting both accident occurrence and severity. Additionally, SHAP values derived from the XGBoost model offered complementary validation, reinforcing the relevance of the selected features. In particular, factors such as the income-to-expenditure ratio and daily driving time emerged as critical predictors, confirming their significance in accident modeling. For rule extraction, we applied the C5.0 algorithm, which produced a decision-making framework with rules aligned with the most important features. This coherence between extracted rules and key predictors further strengthens the interpretability and trustworthiness of our analytical models. The rules demonstrated high precision in forecasting the likelihood of accidents, as evidenced by their individual success rates. The validation of our ML models employed a comprehensive array of fit indices, including accuracy, recall, precision, F1 score, and AUC-ROC—each serving as a critical indicator of predictive efficacy and model robustness. The use of these metrics, particularly the AUC-ROC, provided a well-rounded evaluation of model performance, ensuring that the outcomes were not biased by data imbalance or overfitting to the training set.
The statistical significance of our findings was further confirmed through k-fold cross-validation, which reinforced the models’ generalizability and their practical applicability in real-world scenarios. This multifaceted evaluation framework highlights the reliability of our results and their potential to inform the development of evidence-based health policies, support targeted prevention strategies, and deliver consistent performance across varied contexts within the domain of traffic safety and accident prevention.
5.1. Conclusions
In conclusion, this study demonstrates the innovative application of ML techniques in analyzing accident data, offering actionable insights into the prediction and understanding of accident occurrence and severity. By employing algorithms such as k-means, random forest, and C5.0, we effectively processed multidimensional data obtained from self-reported questionnaires. The analysis revealed several critical factors influencing accident risk and severity, including income, daily driving duration, personality traits such as normlessness and sensation seeking, and the type of law enforcement. These findings provide a valuable foundation for data-driven approaches in road safety policy, targeted interventions, and preventative strategies.

